
|
|||||
|
 | |
| |
| |
| |
| |
| |
|
Gene: DDRGK1 |
Gene summary for DDRGK1 |
| Gene information | Species | Human | Gene symbol | DDRGK1 | Gene ID | 65992 |
| Gene name | DDRGK domain containing 1 | |
| Gene Alias | C20orf116 | |
| Cytomap | 20p13 | |
| Gene Type | protein-coding | GO ID | GO:0001501 | UniProtAcc | Q96HY6 |
Top |
Malignant transformation analysis |
| Identification of the aberrant gene expression in precancerous and cancerous lesions by comparing the gene expression of stem-like cells in diseased tissues with normal stem cells |
| Entrez ID | Symbol | Replicates | Species | Organ | Tissue | Adj P-value | Log2FC | Malignancy |
| 65992 | DDRGK1 | HTA11_3410_2000001011 | Human | Colorectum | AD | 1.94e-03 | 1.59e-01 | 0.0155 |
| 65992 | DDRGK1 | HTA11_2487_2000001011 | Human | Colorectum | SER | 3.25e-04 | 2.45e-01 | -0.1808 |
| 65992 | DDRGK1 | HTA11_1938_2000001011 | Human | Colorectum | AD | 8.89e-12 | 4.02e-01 | -0.0811 |
| 65992 | DDRGK1 | HTA11_347_2000001011 | Human | Colorectum | AD | 2.38e-09 | 2.53e-01 | -0.1954 |
| 65992 | DDRGK1 | HTA11_2112_2000001011 | Human | Colorectum | SER | 7.60e-03 | 5.04e-01 | -0.2196 |
| 65992 | DDRGK1 | HTA11_3361_2000001011 | Human | Colorectum | AD | 1.08e-02 | 2.27e-01 | -0.1207 |
| 65992 | DDRGK1 | HTA11_696_2000001011 | Human | Colorectum | AD | 3.42e-13 | 3.38e-01 | -0.1464 |
| 65992 | DDRGK1 | HTA11_866_2000001011 | Human | Colorectum | AD | 2.66e-03 | 1.71e-01 | -0.1001 |
| 65992 | DDRGK1 | HTA11_1391_2000001011 | Human | Colorectum | AD | 3.64e-14 | 4.43e-01 | -0.059 |
| 65992 | DDRGK1 | HTA11_2992_2000001011 | Human | Colorectum | SER | 3.30e-03 | 3.71e-01 | -0.1706 |
| 65992 | DDRGK1 | HTA11_5212_2000001011 | Human | Colorectum | AD | 3.99e-04 | 3.33e-01 | -0.2061 |
| 65992 | DDRGK1 | HTA11_866_3004761011 | Human | Colorectum | AD | 6.35e-13 | 3.61e-01 | 0.096 |
| 65992 | DDRGK1 | HTA11_6801_2000001011 | Human | Colorectum | SER | 1.57e-02 | 3.00e-01 | 0.0171 |
| 65992 | DDRGK1 | HTA11_10711_2000001011 | Human | Colorectum | AD | 2.36e-08 | 3.41e-01 | 0.0338 |
| 65992 | DDRGK1 | HTA11_7696_3000711011 | Human | Colorectum | AD | 5.86e-13 | 3.81e-01 | 0.0674 |
| 65992 | DDRGK1 | HTA11_6818_2000001011 | Human | Colorectum | AD | 1.58e-05 | 4.28e-01 | 0.0112 |
| 65992 | DDRGK1 | HTA11_99999970781_79442 | Human | Colorectum | MSS | 2.67e-04 | 2.18e-01 | 0.294 |
| 65992 | DDRGK1 | HTA11_99999965062_69753 | Human | Colorectum | MSI-H | 4.77e-02 | 5.06e-01 | 0.3487 |
| 65992 | DDRGK1 | HTA11_99999965104_69814 | Human | Colorectum | MSS | 9.11e-08 | 3.50e-01 | 0.281 |
| 65992 | DDRGK1 | HTA11_99999973899_84307 | Human | Colorectum | MSS | 1.07e-03 | 2.92e-01 | 0.2585 |
| Page: 1 2 3 4 5 6 7 8 |
| Tissue | Expression Dynamics | Abbreviation |
| Colorectum (GSE201348) |  | FAP: Familial adenomatous polyposis |
| CRC: Colorectal cancer | ||
| Colorectum (HTA11) |  | AD: Adenomas |
| SER: Sessile serrated lesions | ||
| MSI-H: Microsatellite-high colorectal cancer | ||
| MSS: Microsatellite stable colorectal cancer | ||
| Esophagus |  | ESCC: Esophageal squamous cell carcinoma |
| HGIN: High-grade intraepithelial neoplasias | ||
| LGIN: Low-grade intraepithelial neoplasias | ||
| Liver |  | HCC: Hepatocellular carcinoma |
| NAFLD: Non-alcoholic fatty liver disease | ||
| Oral Cavity | 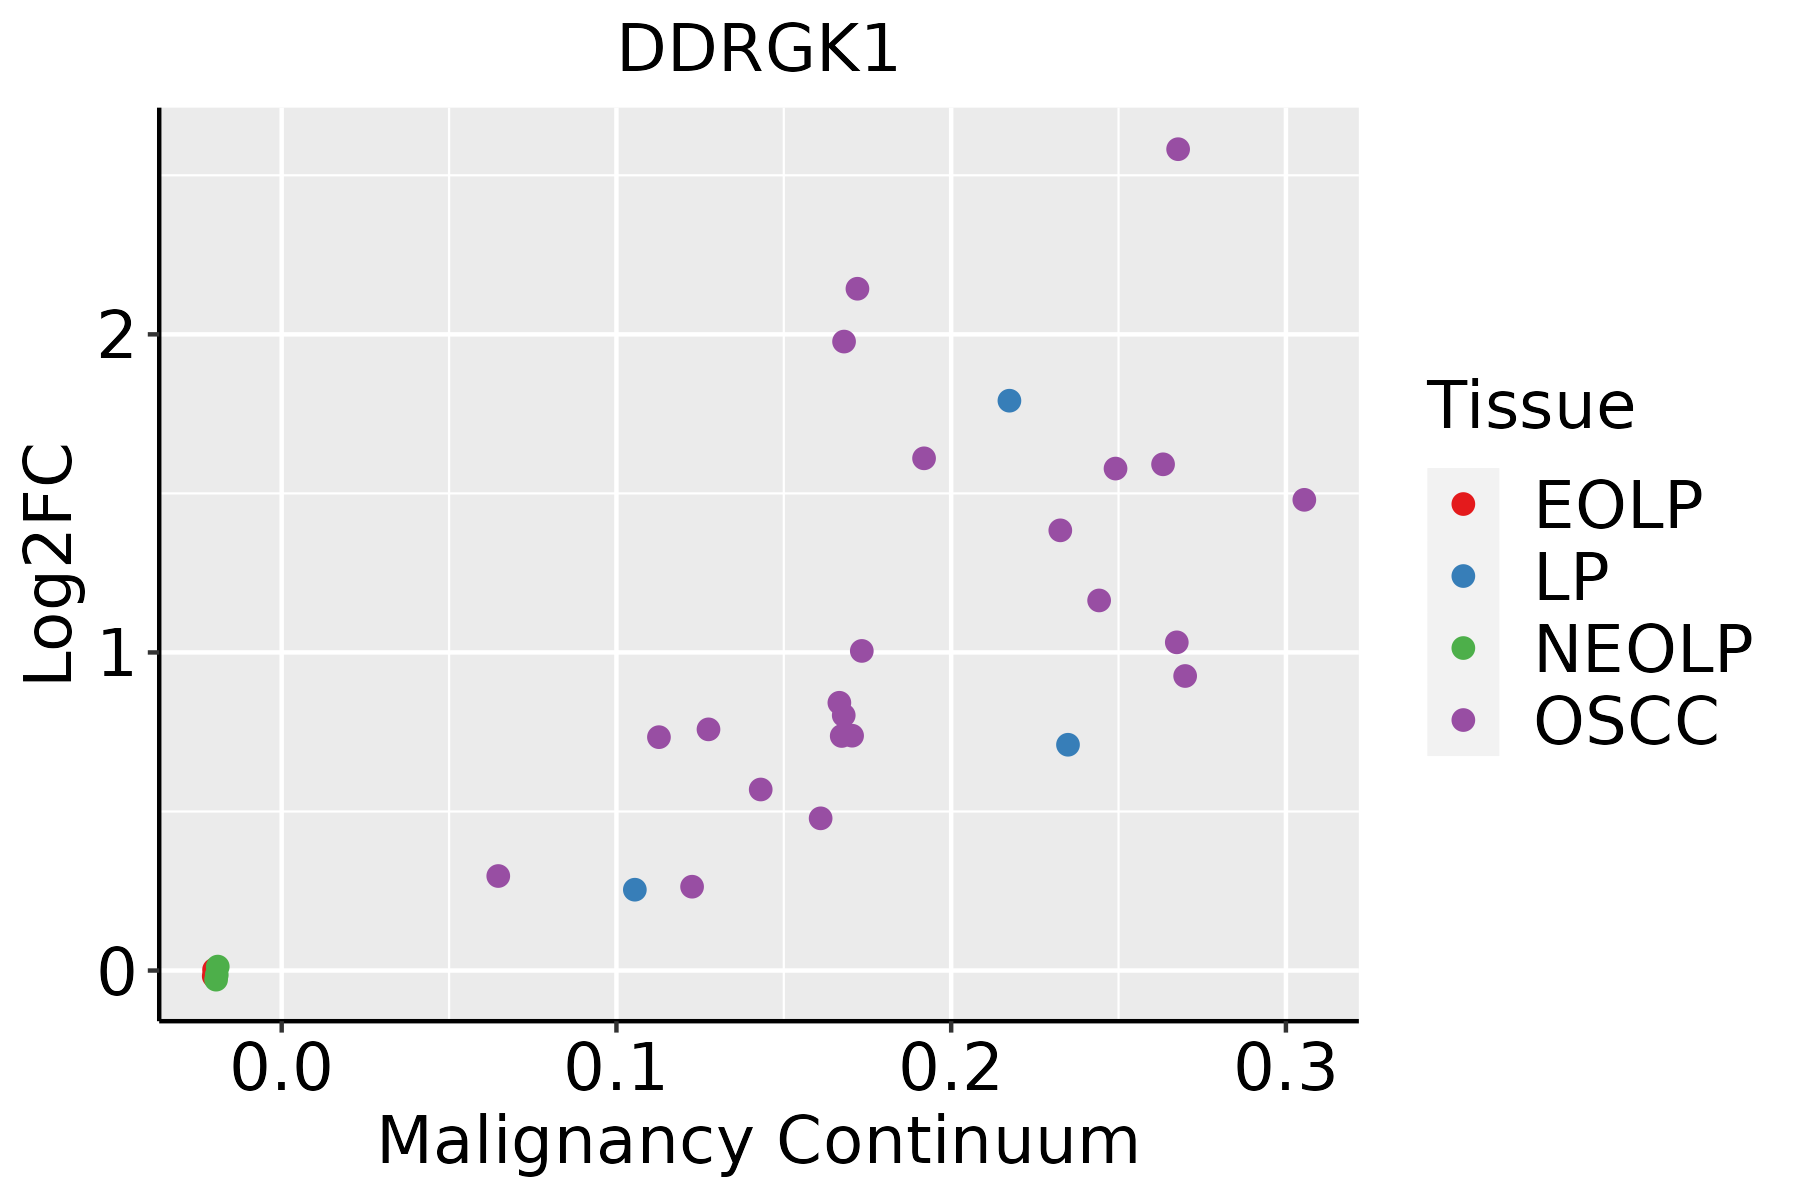 | EOLP: Erosive Oral lichen planus |
| LP: leukoplakia | ||
| NEOLP: Non-erosive oral lichen planus | ||
| OSCC: Oral squamous cell carcinoma | ||
| Prostate | 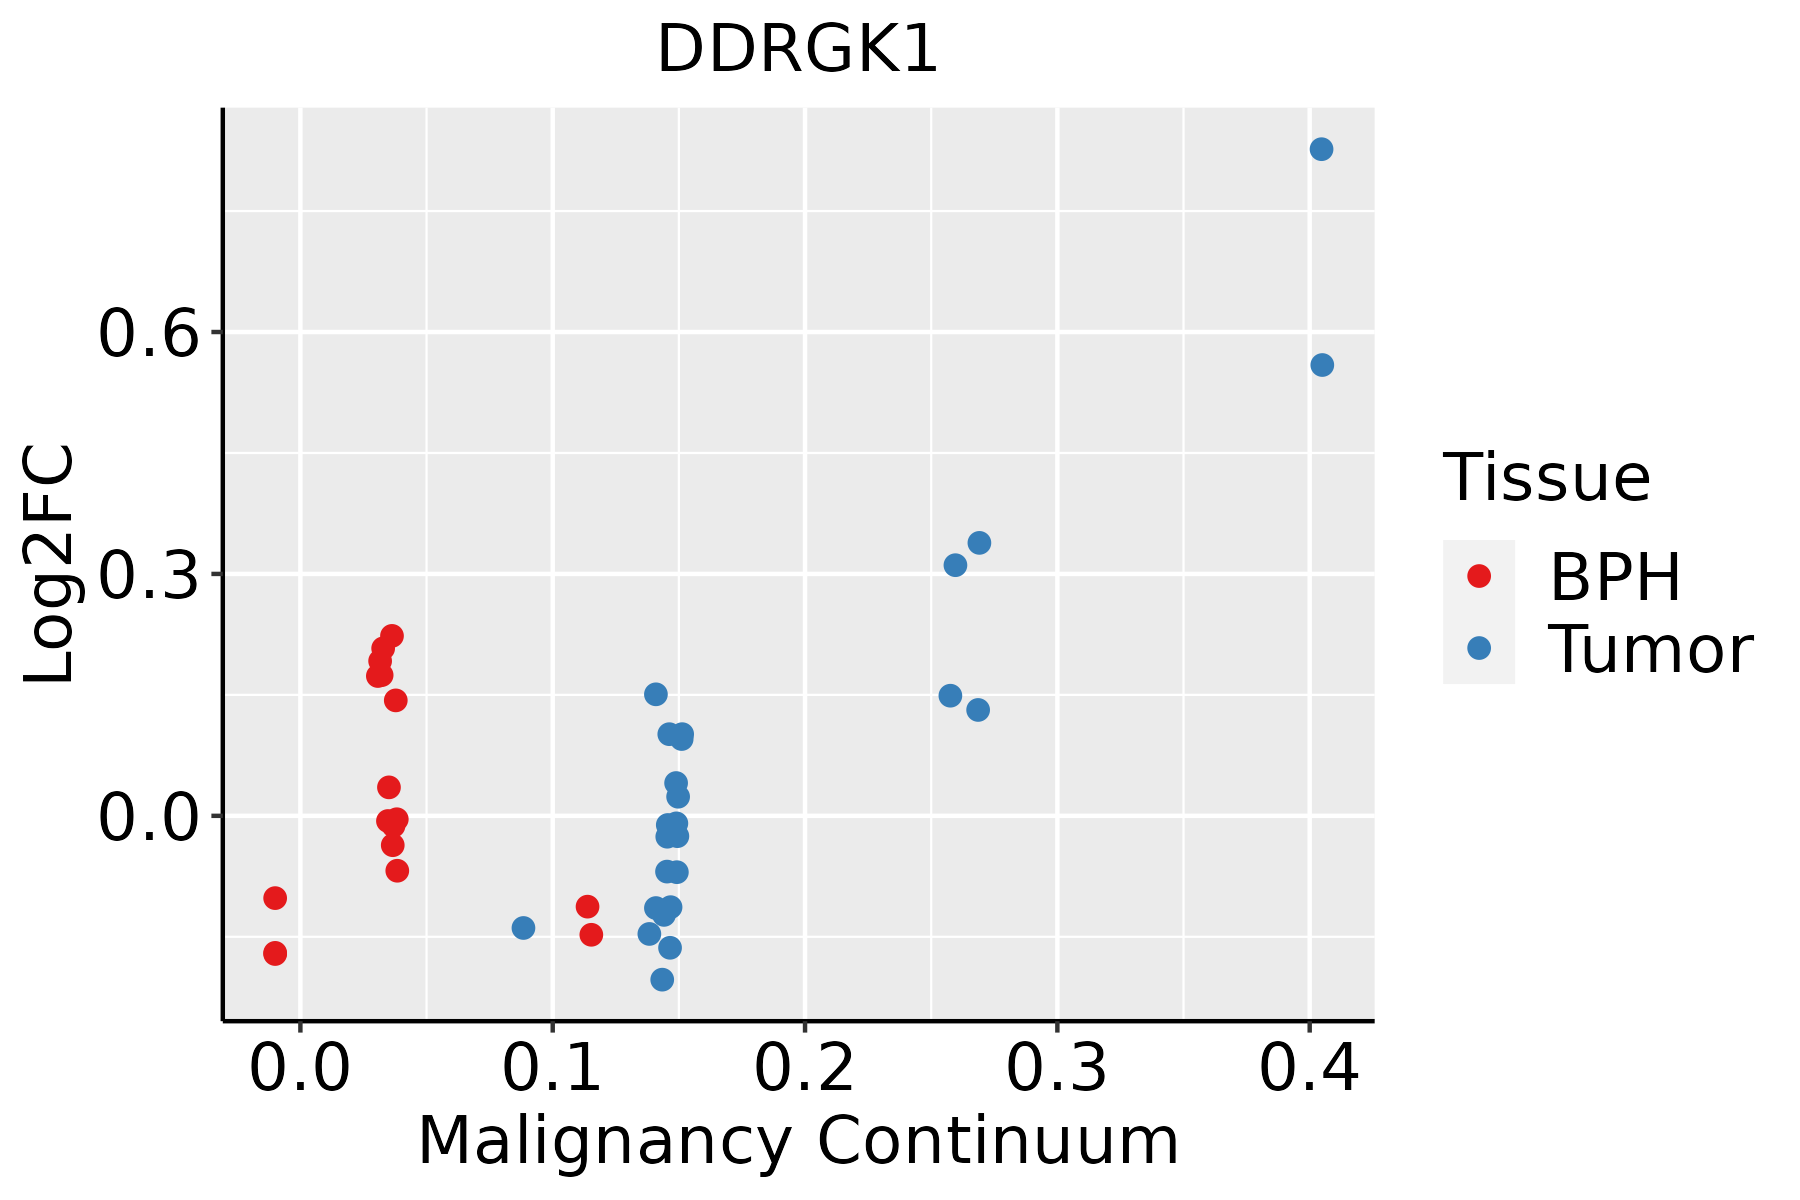 | BPH: Benign Prostatic Hyperplasia |
| Skin | 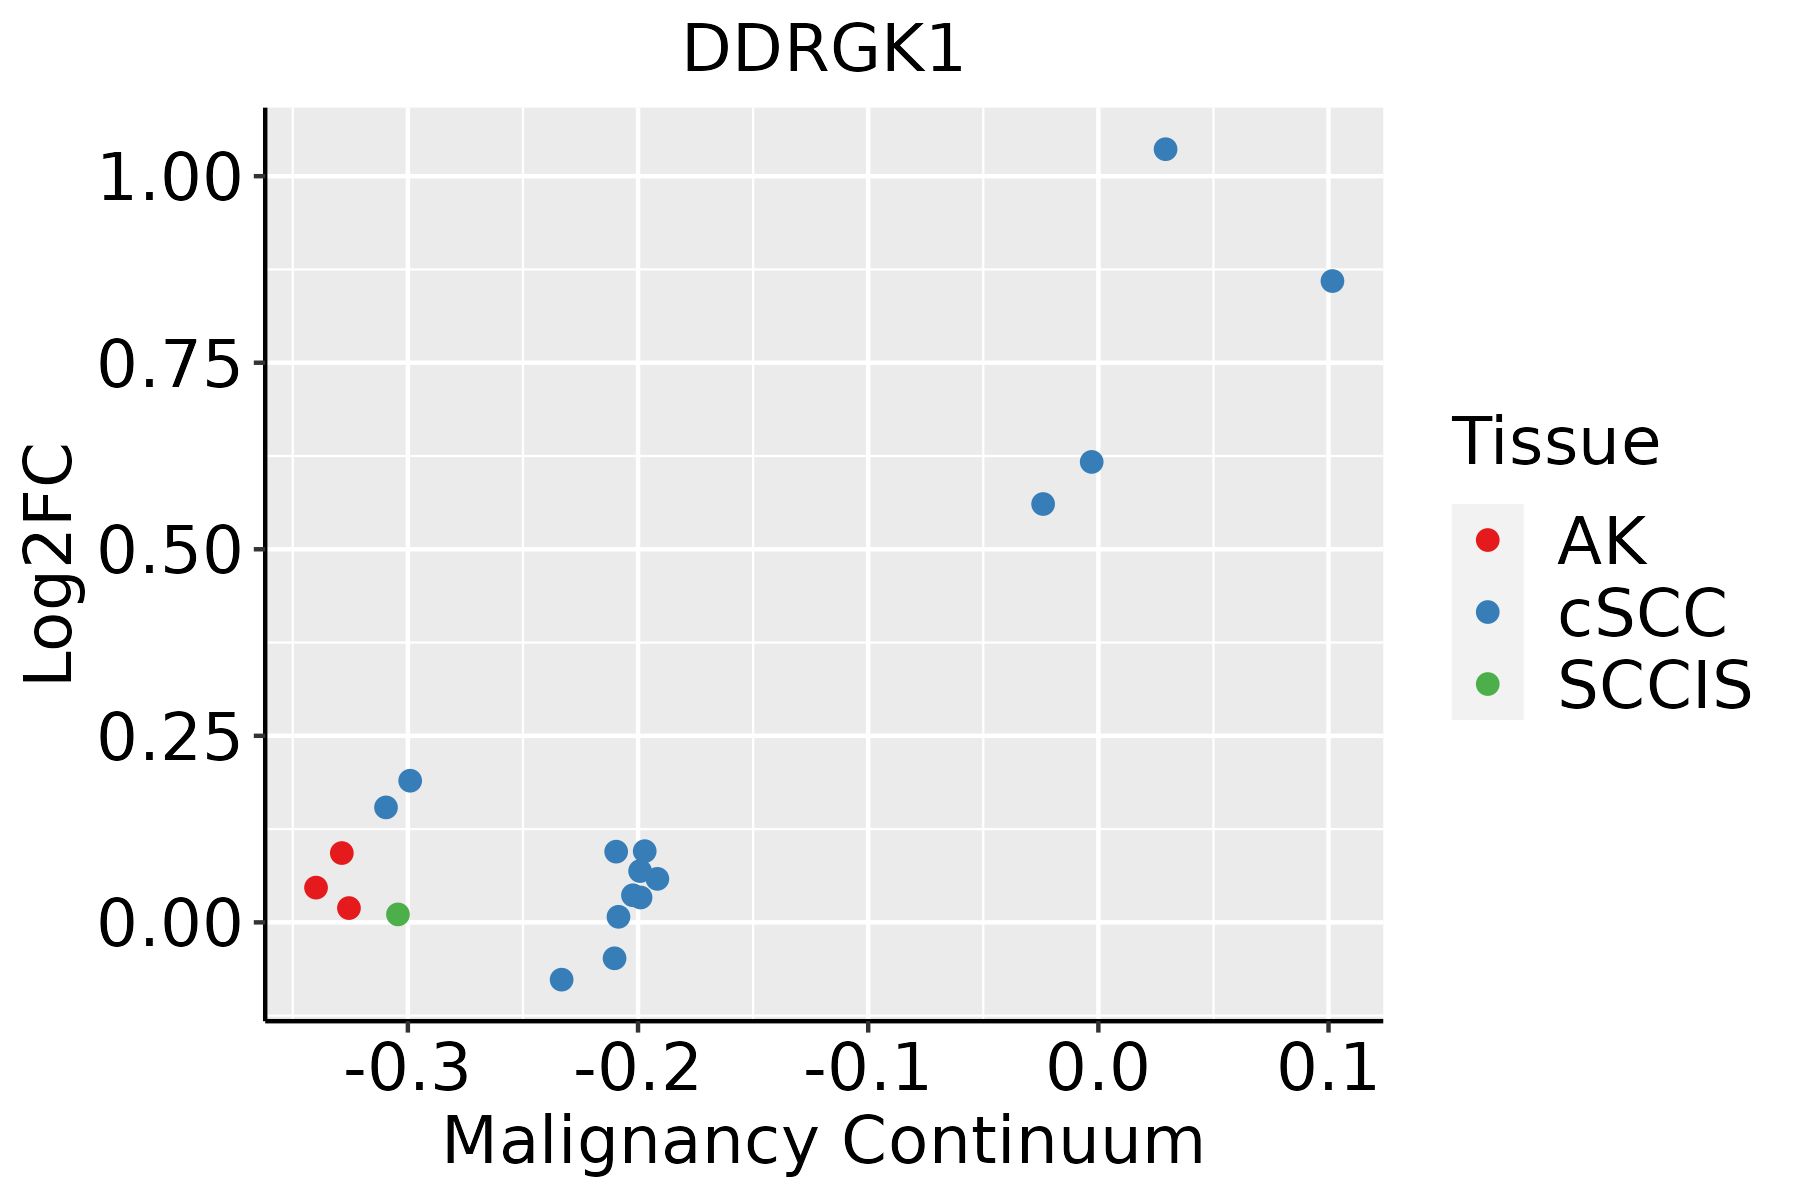 | AK: Actinic keratosis |
| cSCC: Cutaneous squamous cell carcinoma | ||
| SCCIS:squamous cell carcinoma in situ | ||
| Thyroid | 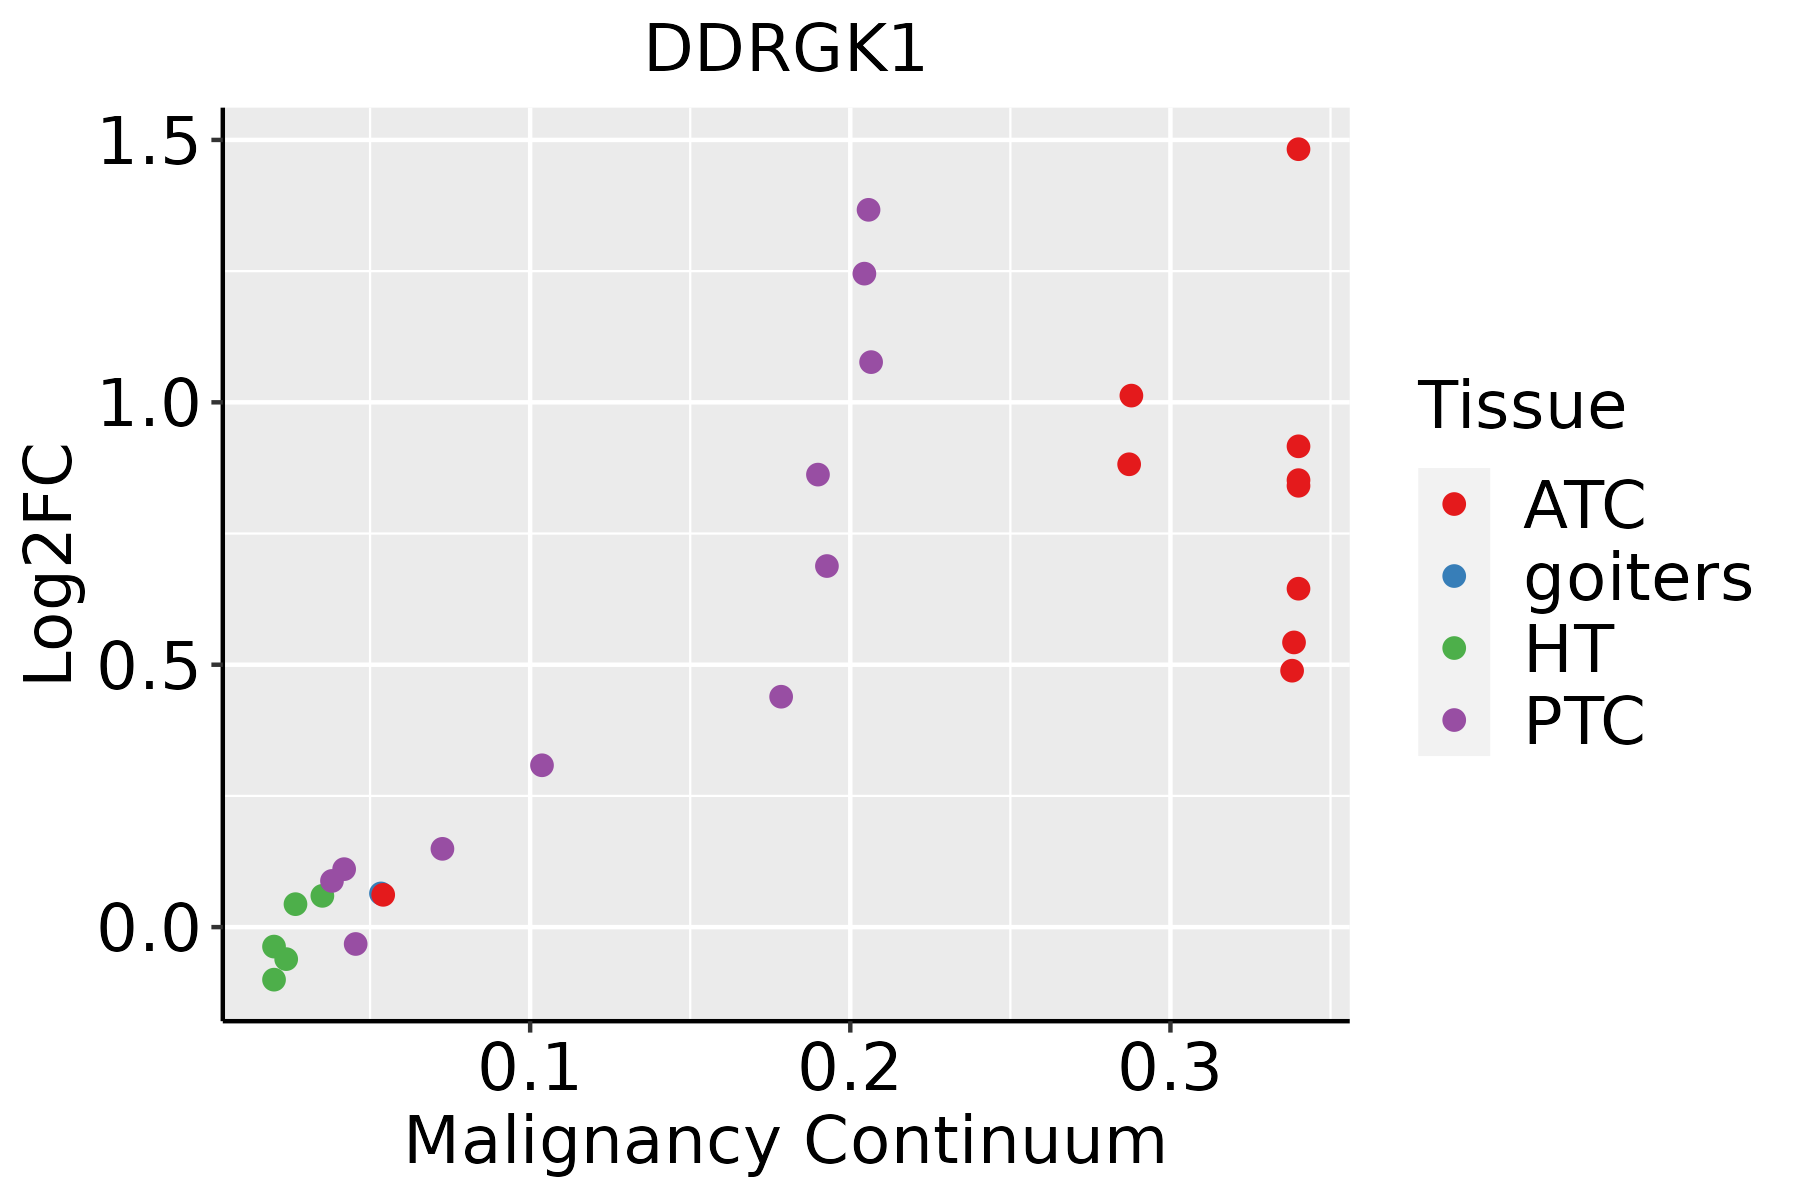 | ATC: Anaplastic thyroid cancer |
| HT: Hashimoto's thyroiditis | ||
| PTC: Papillary thyroid cancer |
| ∗log2FC in expression of this searched gene in stem-like cells from each diseased tissue sample relative to stem-like cells in normal samples in each tissue plotted against the malignancy continuum. Samples are colored based on if they are from different disease stage. |
Top |
Malignant transformation related pathway analysis |
| Find out the enriched GO biological processes and KEGG pathways involved in transition from healthy to precancer to cancer |
| Tissue | Disease Stage | Enriched GO biological Processes |
| Colorectum | AD |  |
| Colorectum | SER |  |
| Colorectum | MSS |  |
| Colorectum | MSI-H |  |
| Colorectum | FAP |  |
| ∗Top 15 enriched GO BP terms are showed in the bar plot of each disease state in each tissue. Each row represents a significant GO biological process which is colored according to the -log10(p.adjust). |
| Page: 1 2 3 4 5 6 7 8 9 |
| GO ID | Tissue | Disease Stage | Description | Gene Ratio | Bg Ratio | pvalue | p.adjust | Count |
| GO:0042176 | Colorectum | AD | regulation of protein catabolic process | 160/3918 | 391/18723 | 1.06e-19 | 7.34e-17 | 160 |
| GO:0009896 | Colorectum | AD | positive regulation of catabolic process | 180/3918 | 492/18723 | 4.33e-16 | 1.94e-13 | 180 |
| GO:1903362 | Colorectum | AD | regulation of cellular protein catabolic process | 109/3918 | 255/18723 | 2.14e-15 | 6.08e-13 | 109 |
| GO:0010498 | Colorectum | AD | proteasomal protein catabolic process | 174/3918 | 490/18723 | 3.18e-14 | 7.66e-12 | 174 |
| GO:0031331 | Colorectum | AD | positive regulation of cellular catabolic process | 156/3918 | 427/18723 | 4.68e-14 | 1.05e-11 | 156 |
| GO:0009895 | Colorectum | AD | negative regulation of catabolic process | 124/3918 | 320/18723 | 1.66e-13 | 3.35e-11 | 124 |
| GO:1903829 | Colorectum | AD | positive regulation of cellular protein localization | 110/3918 | 276/18723 | 4.58e-13 | 8.44e-11 | 110 |
| GO:1903050 | Colorectum | AD | regulation of proteolysis involved in cellular protein catabolic process | 92/3918 | 221/18723 | 2.04e-12 | 3.19e-10 | 92 |
| GO:0031330 | Colorectum | AD | negative regulation of cellular catabolic process | 104/3918 | 262/18723 | 2.66e-12 | 3.96e-10 | 104 |
| GO:0045732 | Colorectum | AD | positive regulation of protein catabolic process | 92/3918 | 231/18723 | 3.85e-11 | 4.47e-09 | 92 |
| GO:0043161 | Colorectum | AD | proteasome-mediated ubiquitin-dependent protein catabolic process | 141/3918 | 412/18723 | 1.77e-10 | 1.68e-08 | 141 |
| GO:0045862 | Colorectum | AD | positive regulation of proteolysis | 129/3918 | 372/18723 | 4.04e-10 | 3.46e-08 | 129 |
| GO:0051098 | Colorectum | AD | regulation of binding | 126/3918 | 363/18723 | 6.01e-10 | 4.88e-08 | 126 |
| GO:0031647 | Colorectum | AD | regulation of protein stability | 108/3918 | 298/18723 | 6.33e-10 | 5.08e-08 | 108 |
| GO:0022411 | Colorectum | AD | cellular component disassembly | 147/3918 | 443/18723 | 8.53e-10 | 6.76e-08 | 147 |
| GO:0042177 | Colorectum | AD | negative regulation of protein catabolic process | 55/3918 | 121/18723 | 1.19e-09 | 8.85e-08 | 55 |
| GO:0061136 | Colorectum | AD | regulation of proteasomal protein catabolic process | 75/3918 | 187/18723 | 1.65e-09 | 1.20e-07 | 75 |
| GO:2000058 | Colorectum | AD | regulation of ubiquitin-dependent protein catabolic process | 68/3918 | 164/18723 | 1.82e-09 | 1.31e-07 | 68 |
| GO:1903363 | Colorectum | AD | negative regulation of cellular protein catabolic process | 39/3918 | 75/18723 | 2.69e-09 | 1.87e-07 | 39 |
| GO:0016236 | Colorectum | AD | macroautophagy | 103/3918 | 291/18723 | 6.76e-09 | 4.15e-07 | 103 |
| Page: 1 2 3 4 5 6 7 8 9 10 11 12 13 14 15 16 17 18 19 20 21 22 23 24 25 26 27 28 29 30 31 32 33 34 35 36 37 38 39 40 41 42 43 44 45 46 |
| Pathway ID | Tissue | Disease Stage | Description | Gene Ratio | Bg Ratio | pvalue | p.adjust | qvalue | Count |
| Page: 1 |
Top |
Cell-cell communication analysis |
| Identification of potential cell-cell interactions between two cell types and their ligand-receptor pairs for different disease states |
| Ligand | Receptor | LRpair | Pathway | Tissue | Disease Stage |
| Page: 1 |
Top |
Single-cell gene regulatory network inference analysis |
| Find out the significant the regulons (TFs) and the target genes of each regulon across cell types for different disease states |
| TF | Cell Type | Tissue | Disease Stage | Target Gene | RSS | Regulon Activity |
| ∗The dot plots of a searched regulon are shown for all cell subpopulations in each disease state of each tissue based on the regulon specific score inferred using pySCENIC and by calculating the average expression. |
| Page: 1 |
Top |
Somatic mutation of malignant transformation related genes |
| Annotation of somatic variants for genes involved in malignant transformation |
| Hugo Symbol | Variant Class | Variant Classification | dbSNP RS | HGVSc | HGVSp | HGVSp Short | SWISSPROT | BIOTYPE | SIFT | PolyPhen | Tumor Sample Barcode | Tissue | Histology | Sex | Age | Stage | Therapy Types | Drugs | Outcome |
| DDRGK1 | SNV | Missense_Mutation | rs751324528 | c.490N>T | p.Arg164Cys | p.R164C | Q96HY6 | protein_coding | deleterious(0) | probably_damaging(0.998) | TCGA-AN-A046-01 | Breast | breast invasive carcinoma | Female | >=65 | I/II | Unknown | Unknown | SD |
| DDRGK1 | SNV | Missense_Mutation | c.559N>A | p.Glu187Lys | p.E187K | Q96HY6 | protein_coding | deleterious(0.03) | probably_damaging(0.992) | TCGA-C5-A1BM-01 | Cervix | cervical & endocervical cancer | Female | >=65 | I/II | Unknown | Unknown | SD | |
| DDRGK1 | SNV | Missense_Mutation | novel | c.131N>G | p.Ala44Gly | p.A44G | Q96HY6 | protein_coding | tolerated(0.14) | benign(0.027) | TCGA-C5-A8XH-01 | Cervix | cervical & endocervical cancer | Female | <65 | I/II | Unknown | Unknown | SD |
| DDRGK1 | SNV | Missense_Mutation | c.205G>A | p.Asp69Asn | p.D69N | Q96HY6 | protein_coding | tolerated(1) | benign(0.07) | TCGA-AA-3984-01 | Colorectum | colon adenocarcinoma | Female | <65 | I/II | Unknown | Unknown | SD | |
| DDRGK1 | SNV | Missense_Mutation | rs763621314 | c.857N>A | p.Arg286Gln | p.R286Q | Q96HY6 | protein_coding | deleterious(0.02) | benign(0.041) | TCGA-CK-4951-01 | Colorectum | colon adenocarcinoma | Female | >=65 | I/II | Unknown | Unknown | PD |
| DDRGK1 | SNV | Missense_Mutation | novel | c.55N>A | p.Leu19Ile | p.L19I | Q96HY6 | protein_coding | tolerated(0.3) | benign(0) | TCGA-A5-A1OF-01 | Endometrium | uterine corpus endometrioid carcinoma | Female | <65 | I/II | Unknown | Unknown | SD |
| DDRGK1 | SNV | Missense_Mutation | rs753666292 | c.367C>T | p.Arg123Trp | p.R123W | Q96HY6 | protein_coding | deleterious(0) | probably_damaging(0.986) | TCGA-AJ-A8CT-01 | Endometrium | uterine corpus endometrioid carcinoma | Female | <65 | I/II | Unknown | Unknown | SD |
| DDRGK1 | SNV | Missense_Mutation | c.750N>T | p.Gln250His | p.Q250H | Q96HY6 | protein_coding | tolerated(0.05) | benign(0.202) | TCGA-AP-A0LM-01 | Endometrium | uterine corpus endometrioid carcinoma | Female | <65 | III/IV | Chemotherapy | cisplatin | SD | |
| DDRGK1 | SNV | Missense_Mutation | rs764215113 | c.341N>T | p.Ser114Leu | p.S114L | Q96HY6 | protein_coding | deleterious(0.05) | benign(0) | TCGA-AX-A2IO-01 | Endometrium | uterine corpus endometrioid carcinoma | Female | >=65 | I/II | Chemotherapy | carboplatin | SD |
| DDRGK1 | SNV | Missense_Mutation | novel | c.813N>G | p.Ile271Met | p.I271M | Q96HY6 | protein_coding | deleterious(0) | possibly_damaging(0.828) | TCGA-B5-A1MX-01 | Endometrium | uterine corpus endometrioid carcinoma | Female | <65 | I/II | Hormone Therapy | megace | SD |
| Page: 1 2 3 4 |
Top |
Related drugs of malignant transformation related genes |
| Identification of chemicals and drugs interact with genes involved in malignant transfromation |
| (DGIdb 4.0) |
| Entrez ID | Symbol | Category | Interaction Types | Drug Claim Name | Drug Name | PMIDs |
| 65992 | DDRGK1 | NUCLEAR HORMONE RECEPTOR | azathioprine | AZATHIOPRINE | 21961091 |
| Page: 1 |

Copyright 2023-Present -The University of Texas Health Science Center at Houston |