Schematic overview of the cellular and molecular mechanisms involved in the cancer progression, including the proposed cellular and molecular mechanisms in cancer cells trajectory. AT1: alveolar type 1 cells; AT2: alveolar type 2 cells; AAH: atypical adenomatous hyperplasia; AIS: adenocarcinoma in situ; MIA: minimally invasive adenocarcinoma; IA: invasive adenocarcinoma; EMT: epithelial-mesenchymal transition

Home

Download

Statistics

Help

Contact

Center for Computational Systems Medicine
leaf

Gene summary

leaf

Malignant transformation analysis

leaf

Malignant transformation related pathway analysis

leaf

Cell-cell communication analysis

leaf

Single-cell gene regulatory network inference analysis

leaf

Somatic mutation of malignant transformation related genes

leaf

Related drugs of malignant transformation related genes

Gene: DDR1

Gene summary for DDR1

check button Gene summary.

Gene informationSpeciesHuman
Gene symbol

DDR1

Gene ID

780

Gene namediscoidin domain receptor tyrosine kinase 1
Gene AliasCAK
Cytomap6p21.33
Gene Typeprotein-coding
GO ID

GO:0000003

UniProtAcc

Q08345


Top

Malignant transformation analysis

check button Identification of the aberrant gene expression in precancerous and cancerous lesions by comparing the gene expression of stem-like cells in diseased tissues with normal stem cells
check button Malignant transformation involving gene list.
Entrez IDSymbolReplicatesSpeciesOrganTissueAdj P-valueLog2FCMalignancy
780DDR1HTA11_3410_2000001011HumanColorectumAD3.19e-123.20e-010.0155
780DDR1HTA11_2487_2000001011HumanColorectumSER2.77e-268.34e-01-0.1808
780DDR1HTA11_2951_2000001011HumanColorectumAD1.13e-033.98e-010.0216
780DDR1HTA11_1938_2000001011HumanColorectumAD1.83e-271.07e+00-0.0811
780DDR1HTA11_78_2000001011HumanColorectumAD3.35e-258.03e-01-0.1088
780DDR1HTA11_347_2000001011HumanColorectumAD1.82e-541.10e+00-0.1954
780DDR1HTA11_411_2000001011HumanColorectumSER8.78e-141.31e+00-0.2602
780DDR1HTA11_2112_2000001011HumanColorectumSER1.77e-151.28e+00-0.2196
780DDR1HTA11_3361_2000001011HumanColorectumAD2.78e-135.15e-01-0.1207
780DDR1HTA11_83_2000001011HumanColorectumSER6.88e-147.87e-01-0.1526
780DDR1HTA11_696_2000001011HumanColorectumAD8.96e-409.80e-01-0.1464
780DDR1HTA11_866_2000001011HumanColorectumAD8.83e-257.00e-01-0.1001
780DDR1HTA11_1391_2000001011HumanColorectumAD1.58e-301.04e+00-0.059
780DDR1HTA11_2992_2000001011HumanColorectumSER1.39e-037.07e-01-0.1706
780DDR1HTA11_5212_2000001011HumanColorectumAD1.08e-117.10e-01-0.2061
780DDR1HTA11_5216_2000001011HumanColorectumSER2.00e-056.57e-01-0.1462
780DDR1HTA11_546_2000001011HumanColorectumAD2.38e-075.53e-01-0.0842
780DDR1HTA11_7862_2000001011HumanColorectumAD1.20e-137.94e-01-0.0179
780DDR1HTA11_866_3004761011HumanColorectumAD5.68e-389.01e-010.096
780DDR1HTA11_4255_2000001011HumanColorectumSER8.83e-045.54e-010.0446
Page: 1 2 3 4 5 6 7 8 9 10 

check button Transcriptomic changes along malignancy continuum.
TissueExpression DynamicsAbbreviation
Colorectum (GSE201348)The image shows the transcriptomic changes along malignancy continuum.log2FC in expression of this searched gene in stem-like cells from each diseased tissue sample relative to stem-like cells in normal samples in each tissue plotted against the malignancy continuum. Samples are colored based on if they are from different disease stage.FAP: Familial adenomatous polyposis
CRC: Colorectal cancer
Colorectum (HTA11)The image shows the transcriptomic changes along malignancy continuum.log2FC in expression of this searched gene in stem-like cells from each diseased tissue sample relative to stem-like cells in normal samples in each tissue plotted against the malignancy continuum. Samples are colored based on if they are from different disease stage.AD: Adenomas
SER: Sessile serrated lesions
MSI-H: Microsatellite-high colorectal cancer
MSS: Microsatellite stable colorectal cancer
EsophagusThe image shows the transcriptomic changes along malignancy continuum.log2FC in expression of this searched gene in stem-like cells from each diseased tissue sample relative to stem-like cells in normal samples in each tissue plotted against the malignancy continuum. Samples are colored based on if they are from different disease stage.
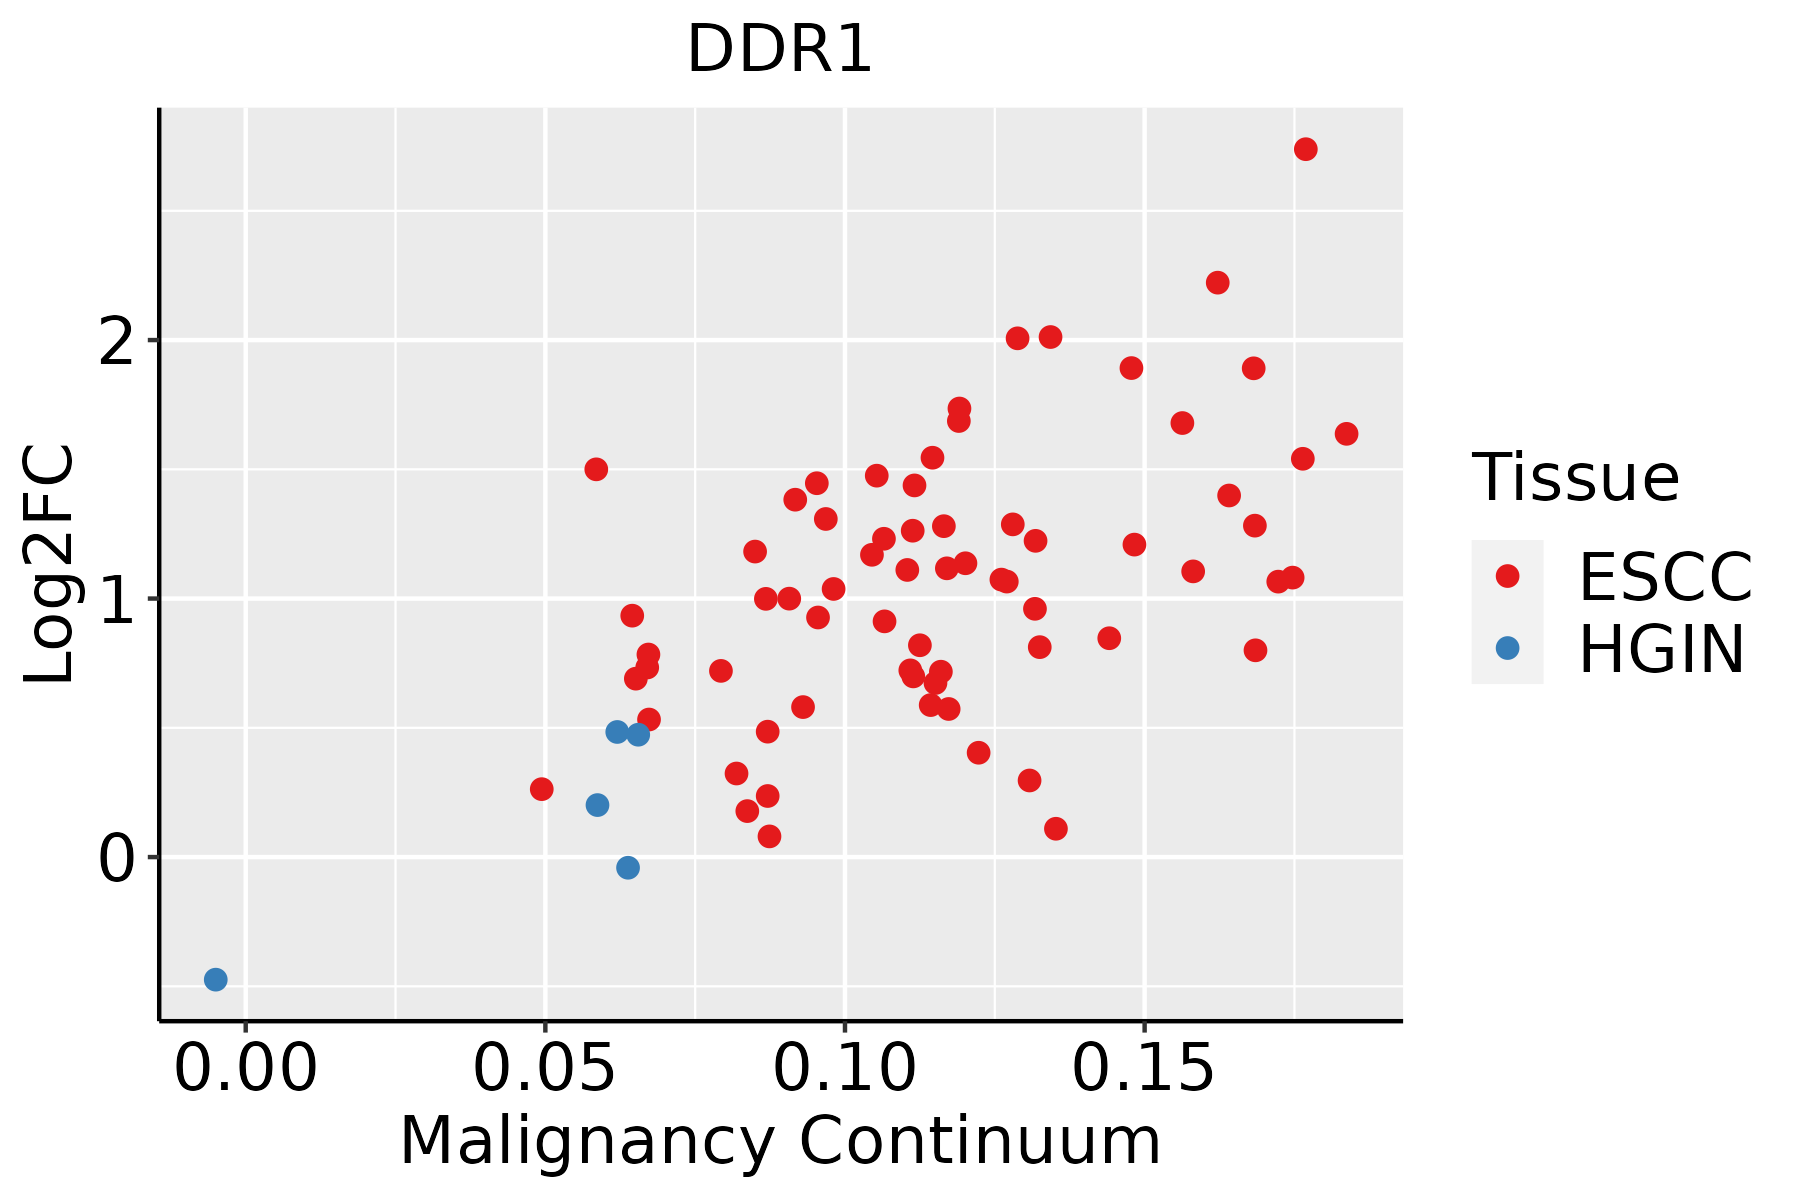
ESCC: Esophageal squamous cell carcinoma
HGIN: High-grade intraepithelial neoplasias
LGIN: Low-grade intraepithelial neoplasias
LiverThe image shows the transcriptomic changes along malignancy continuum.log2FC in expression of this searched gene in stem-like cells from each diseased tissue sample relative to stem-like cells in normal samples in each tissue plotted against the malignancy continuum. Samples are colored based on if they are from different disease stage.
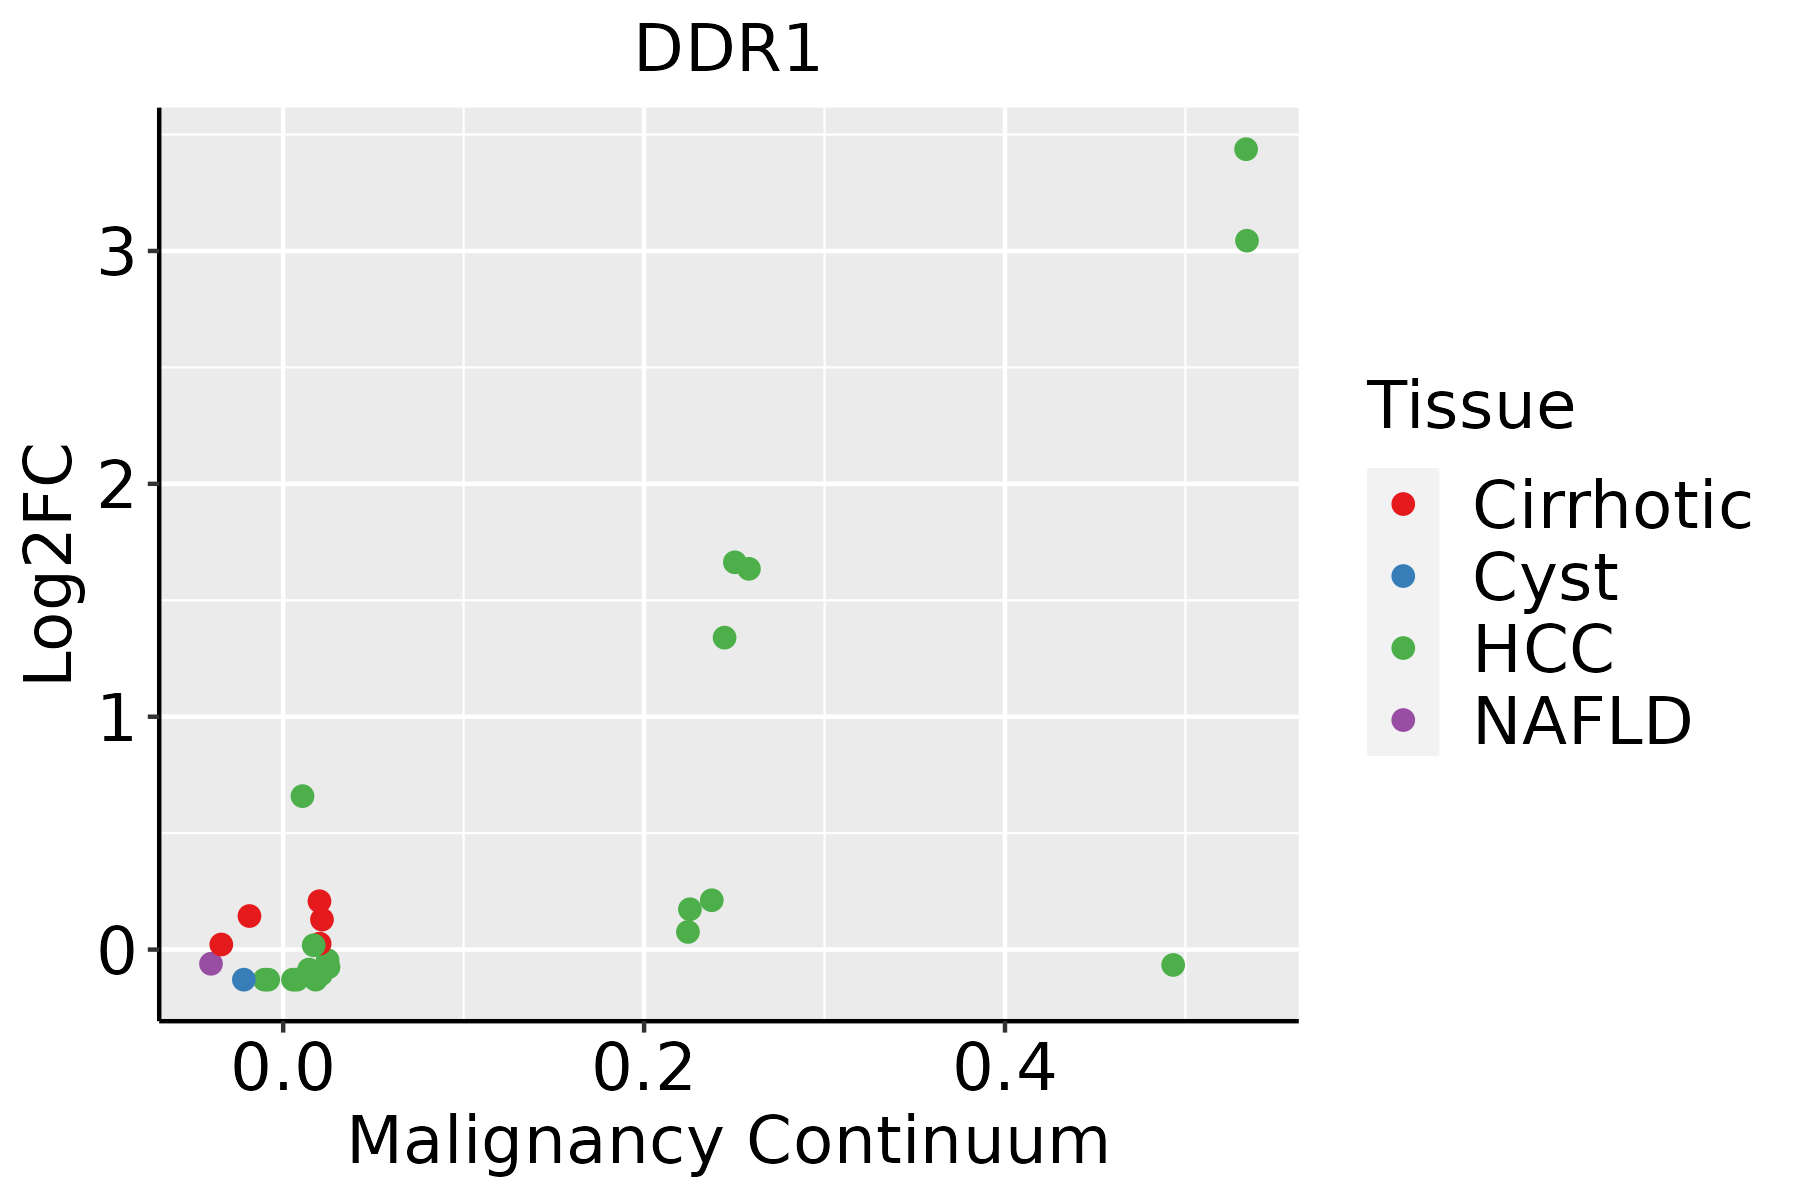
HCC: Hepatocellular carcinoma
NAFLD: Non-alcoholic fatty liver disease
Oral CavityThe image shows the transcriptomic changes along malignancy continuum.log2FC in expression of this searched gene in stem-like cells from each diseased tissue sample relative to stem-like cells in normal samples in each tissue plotted against the malignancy continuum. Samples are colored based on if they are from different disease stage.
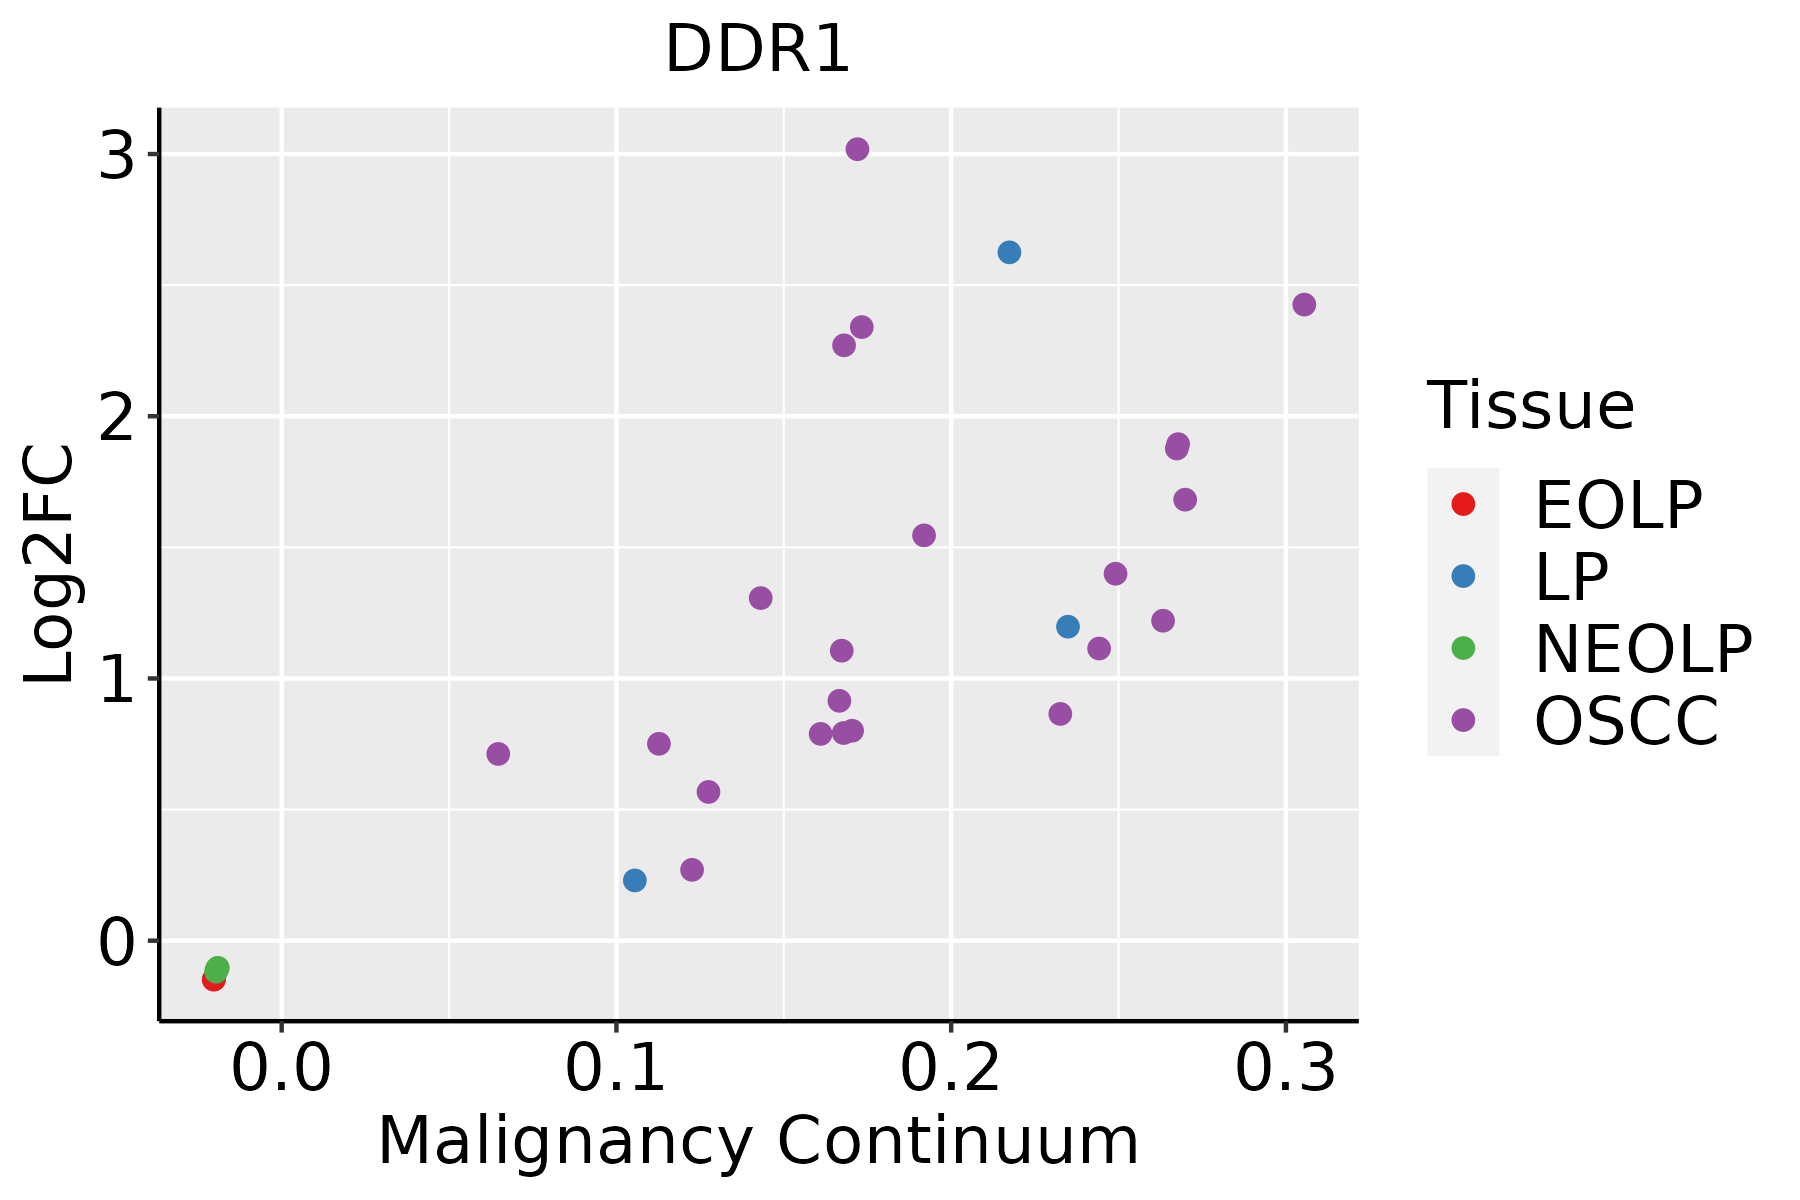
EOLP: Erosive Oral lichen planus
LP: leukoplakia
NEOLP: Non-erosive oral lichen planus
OSCC: Oral squamous cell carcinoma
ProstateThe image shows the transcriptomic changes along malignancy continuum.log2FC in expression of this searched gene in stem-like cells from each diseased tissue sample relative to stem-like cells in normal samples in each tissue plotted against the malignancy continuum. Samples are colored based on if they are from different disease stage.BPH: Benign Prostatic Hyperplasia
SkinThe image shows the transcriptomic changes along malignancy continuum.log2FC in expression of this searched gene in stem-like cells from each diseased tissue sample relative to stem-like cells in normal samples in each tissue plotted against the malignancy continuum. Samples are colored based on if they are from different disease stage.AK: Actinic keratosis
cSCC: Cutaneous squamous cell carcinoma
SCCIS:squamous cell carcinoma in situ
ThyroidThe image shows the transcriptomic changes along malignancy continuum.log2FC in expression of this searched gene in stem-like cells from each diseased tissue sample relative to stem-like cells in normal samples in each tissue plotted against the malignancy continuum. Samples are colored based on if they are from different disease stage.ATC: Anaplastic thyroid cancer
HT: Hashimoto's thyroiditis
PTC: Papillary thyroid cancer
∗log2FC in expression of this searched gene in stem-like cells from each diseased tissue sample relative to stem-like cells in normal samples in each tissue plotted against the malignancy continuum. Samples are colored based on if they are from different disease stage.

Top

Malignant transformation related pathway analysis

check buttonFind out the enriched GO biological processes and KEGG pathways involved in transition from healthy to precancer to cancer
check button Figure of enriched GO biological processes.
TissueDisease StageEnriched GO biological Processes
ColorectumADGO analysis - Figure of enriched GO biological processes: Top 15 enriched GO BP terms are showed in the bar plot of each disease state in each tissue. Each row represents a significant GO biological process which is colored according to the -log10(p.adjust).
ColorectumSERGO analysis - Figure of enriched GO biological processes: Top 15 enriched GO BP terms are showed in the bar plot of each disease state in each tissue. Each row represents a significant GO biological process which is colored according to the -log10(p.adjust).
ColorectumMSSGO analysis - Figure of enriched GO biological processes: Top 15 enriched GO BP terms are showed in the bar plot of each disease state in each tissue. Each row represents a significant GO biological process which is colored according to the -log10(p.adjust).
ColorectumMSI-HGO analysis - Figure of enriched GO biological processes: Top 15 enriched GO BP terms are showed in the bar plot of each disease state in each tissue. Each row represents a significant GO biological process which is colored according to the -log10(p.adjust).
ColorectumFAPGO analysis - Figure of enriched GO biological processes: Top 15 enriched GO BP terms are showed in the bar plot of each disease state in each tissue. Each row represents a significant GO biological process which is colored according to the -log10(p.adjust).
∗Top 15 enriched GO BP terms are showed in the bar plot of each disease state in each tissue. Each row represents a significant GO biological process which is colored according to the -log10(p.adjust).
Page: 1 2 3 4 5 6 7 8 9 

check button Enriched GO biological processes.
GO IDTissueDisease StageDescriptionGene RatioBg Ratiopvaluep.adjustCount
GO:0048732ColorectumADgland development149/3918436/187236.07e-116.33e-09149
GO:0022411ColorectumADcellular component disassembly147/3918443/187238.53e-106.76e-08147
GO:0010810ColorectumADregulation of cell-substrate adhesion81/3918221/187234.80e-082.55e-0681
GO:0031589ColorectumADcell-substrate adhesion116/3918363/187234.68e-071.76e-05116
GO:0030879ColorectumADmammary gland development53/3918137/187231.46e-064.58e-0553
GO:0001952ColorectumADregulation of cell-matrix adhesion50/3918128/187232.05e-066.05e-0550
GO:0042060ColorectumADwound healing128/3918422/187232.73e-067.89e-05128
GO:0016049ColorectumADcell growth143/3918482/187232.83e-068.09e-05143
GO:0001558ColorectumADregulation of cell growth124/3918414/187237.67e-061.86e-04124
GO:0046777ColorectumADprotein autophosphorylation74/3918227/187232.48e-054.76e-0474
GO:0007160ColorectumADcell-matrix adhesion75/3918233/187233.56e-056.45e-0475
GO:0061564ColorectumADaxon development132/3918467/187238.40e-051.31e-03132
GO:0061180ColorectumADmammary gland epithelium development28/391867/187238.74e-051.35e-0328
GO:0033674ColorectumADpositive regulation of kinase activity131/3918467/187231.28e-041.85e-03131
GO:0022612ColorectumADgland morphogenesis42/3918118/187231.62e-042.23e-0342
GO:0050878ColorectumADregulation of body fluid levels108/3918379/187232.54e-043.20e-03108
GO:0060562ColorectumADepithelial tube morphogenesis93/3918325/187235.65e-046.00e-0393
GO:0007589ColorectumADbody fluid secretion33/391893/187238.26e-048.13e-0333
GO:0060443ColorectumADmammary gland morphogenesis18/391843/187231.51e-031.27e-0218
GO:0048588ColorectumADdevelopmental cell growth67/3918234/187233.03e-032.25e-0267
Page: 1 2 3 4 5 6 7 8 9 10 11 12 13 14 15 16 17 18 19 20 

check button Enriched KEGG pathways.
Pathway IDTissueDisease StageDescriptionGene RatioBg Ratiopvaluep.adjustqvalueCount
Page: 1 

Top

Cell-cell communication analysis

check buttonIdentification of potential cell-cell interactions between two cell types and their ligand-receptor pairs for different disease states
LigandReceptorLRpairPathwayTissueDisease Stage
Page: 1 

Top

Single-cell gene regulatory network inference analysis

check buttonFind out the significant the regulons (TFs) and the target genes of each regulon across cell types for different disease states
TFCell TypeTissueDisease StageTarget GeneRSSRegulon Activity
∗The dot plots of a searched regulon are shown for all cell subpopulations in each disease state of each tissue based on the regulon specific score inferred using pySCENIC and by calculating the average expression.
Page: 1 

Top

Somatic mutation of malignant transformation related genes

check buttonAnnotation of somatic variants for genes involved in malignant transformation
Hugo SymbolVariant ClassVariant ClassificationdbSNP RSHGVScHGVSpHGVSp ShortSWISSPROTBIOTYPESIFTPolyPhenTumor Sample BarcodeTissueHistologySexAgeStageTherapy TypesDrugsOutcome
DDR1SNVMissense_Mutationc.1852N>Cp.Glu618Glnp.E618QQ08345protein_codingdeleterious(0)probably_damaging(0.998)TCGA-A8-A07U-01Breastbreast invasive carcinomaFemale>=65III/IVChemotherapy5-fluorouracilSD
DDR1SNVMissense_Mutationrs527938479c.1826N>Ap.Arg609Glnp.R609QQ08345protein_codingtolerated(0.69)benign(0.019)TCGA-A8-A097-01Breastbreast invasive carcinomaFemale>=65I/IIHormone TherapytamoxiphenSD
DDR1SNVMissense_Mutationnovelc.1438G>Ap.Glu480Lysp.E480KQ08345protein_codingtolerated(0.82)benign(0.291)TCGA-AN-A046-01Breastbreast invasive carcinomaFemale>=65I/IIUnknownUnknownSD
DDR1SNVMissense_Mutationrs370113205c.1696N>Ap.Val566Ilep.V566IQ08345protein_codingtolerated(0.06)probably_damaging(0.964)TCGA-D8-A1X6-01Breastbreast invasive carcinomaFemale>=65III/IVHormone TherapytamoxiphenSD
DDR1SNVMissense_Mutationnovelc.571C>Tp.Leu191Phep.L191FQ08345protein_codingdeleterious(0)probably_damaging(0.953)TCGA-E2-A574-01Breastbreast invasive carcinomaFemale<65I/IIChemotherapyadriamycinSD
DDR1deletionFrame_Shift_Delnovelc.949delNp.Met318CysfsTer5p.M318Cfs*5Q08345protein_codingTCGA-EW-A2FV-01Breastbreast invasive carcinomaFemale<65III/IVChemotherapydocetaxelSD
DDR1SNVMissense_Mutationrs557271556c.586G>Ap.Ala196Thrp.A196TQ08345protein_codingtolerated(0.09)benign(0.192)TCGA-2W-A8YY-01Cervixcervical & endocervical cancerFemale<65I/IIChemotherapycisplatinCR
DDR1SNVMissense_Mutationrs370297461c.2282G>Ap.Arg761Hisp.R761HQ08345protein_codingdeleterious(0)probably_damaging(0.91)TCGA-2W-A8YY-01Cervixcervical & endocervical cancerFemale<65I/IIChemotherapycisplatinCR
DDR1SNVMissense_Mutationnovelc.2569G>Ap.Glu857Lysp.E857KQ08345protein_codingdeleterious(0)possibly_damaging(0.699)TCGA-2W-A8YY-01Cervixcervical & endocervical cancerFemale<65I/IIChemotherapycisplatinCR
DDR1SNVMissense_Mutationrs776556090c.2648N>Tp.Pro883Leup.P883LQ08345protein_codingdeleterious(0)probably_damaging(1)TCGA-C5-A2LV-01Cervixcervical & endocervical cancerFemale<65I/IIUnknownUnknownSD
Page: 1 2 3 4 5 6 7 8 9 10 

Top

Related drugs of malignant transformation related genes

check buttonIdentification of chemicals and drugs interact with genes involved in malignant transfromation
(DGIdb 4.0)
Entrez IDSymbolCategoryInteraction TypesDrug Claim NameDrug NamePMIDs
780DDR1DRUGGABLE GENOME, KINASE, TYROSINE KINASE, CLINICALLY ACTIONABLEinhibitor381118865
780DDR1DRUGGABLE GENOME, KINASE, TYROSINE KINASE, CLINICALLY ACTIONABLEUS9567304, Compound N-9
780DDR1DRUGGABLE GENOME, KINASE, TYROSINE KINASE, CLINICALLY ACTIONABLEVAPBGCRAUJRZPO-UHFFFAOYSA-N
780DDR1DRUGGABLE GENOME, KINASE, TYROSINE KINASE, CLINICALLY ACTIONABLEBDBM50080408
780DDR1DRUGGABLE GENOME, KINASE, TYROSINE KINASE, CLINICALLY ACTIONABLEUS9695118, 4
780DDR1DRUGGABLE GENOME, KINASE, TYROSINE KINASE, CLINICALLY ACTIONABLENG7
780DDR1DRUGGABLE GENOME, KINASE, TYROSINE KINASE, CLINICALLY ACTIONABLEinhibitor328083456
780DDR1DRUGGABLE GENOME, KINASE, TYROSINE KINASE, CLINICALLY ACTIONABLEinhibitor178102314IMATINIB
780DDR1DRUGGABLE GENOME, KINASE, TYROSINE KINASE, CLINICALLY ACTIONABLEinhibitor252827391
780DDR1DRUGGABLE GENOME, KINASE, TYROSINE KINASE, CLINICALLY ACTIONABLEinhibitor363894135MERESTINIB
Page: 1 2 3