
|
|||||
|
 | |
| |
| |
| |
| |
| |
|
Gene: DDOST |
Gene summary for DDOST |
| Gene information | Species | Human | Gene symbol | DDOST | Gene ID | 1650 |
| Gene name | dolichyl-diphosphooligosaccharide--protein glycosyltransferase non-catalytic subunit | |
| Gene Alias | AGER1 | |
| Cytomap | 1p36.12 | |
| Gene Type | protein-coding | GO ID | GO:0001775 | UniProtAcc | A0A024RAD5 |
Top |
Malignant transformation analysis |
| Identification of the aberrant gene expression in precancerous and cancerous lesions by comparing the gene expression of stem-like cells in diseased tissues with normal stem cells |
| Entrez ID | Symbol | Replicates | Species | Organ | Tissue | Adj P-value | Log2FC | Malignancy |
| 1650 | DDOST | CA_HPV_1 | Human | Cervix | CC | 3.55e-06 | -2.44e-01 | 0.0264 |
| 1650 | DDOST | CA_HPV_3 | Human | Cervix | CC | 2.87e-04 | -1.79e-02 | 0.0414 |
| 1650 | DDOST | N_HPV_2 | Human | Cervix | N_HPV | 2.11e-03 | -3.11e-02 | -0.0131 |
| 1650 | DDOST | CCI_1 | Human | Cervix | CC | 4.21e-03 | -5.45e-01 | 0.528 |
| 1650 | DDOST | CCI_3 | Human | Cervix | CC | 3.56e-04 | -5.28e-01 | 0.516 |
| 1650 | DDOST | CCII_1 | Human | Cervix | CC | 1.00e-18 | -6.64e-01 | 0.3249 |
| 1650 | DDOST | sample3 | Human | Cervix | CC | 8.27e-05 | -1.84e-01 | 0.1387 |
| 1650 | DDOST | H2 | Human | Cervix | HSIL_HPV | 1.37e-03 | -3.01e-01 | 0.0632 |
| 1650 | DDOST | L1 | Human | Cervix | CC | 3.07e-06 | -3.70e-01 | 0.0802 |
| 1650 | DDOST | T3 | Human | Cervix | CC | 1.30e-02 | -1.18e-01 | 0.1389 |
| 1650 | DDOST | HTA11_3410_2000001011 | Human | Colorectum | AD | 1.22e-09 | 3.36e-01 | 0.0155 |
| 1650 | DDOST | HTA11_2487_2000001011 | Human | Colorectum | SER | 2.08e-07 | 3.94e-01 | -0.1808 |
| 1650 | DDOST | HTA11_1938_2000001011 | Human | Colorectum | AD | 1.34e-08 | 5.14e-01 | -0.0811 |
| 1650 | DDOST | HTA11_78_2000001011 | Human | Colorectum | AD | 1.07e-05 | 3.55e-01 | -0.1088 |
| 1650 | DDOST | HTA11_347_2000001011 | Human | Colorectum | AD | 1.21e-25 | 6.06e-01 | -0.1954 |
| 1650 | DDOST | HTA11_411_2000001011 | Human | Colorectum | SER | 2.13e-03 | 6.15e-01 | -0.2602 |
| 1650 | DDOST | HTA11_3361_2000001011 | Human | Colorectum | AD | 1.06e-02 | 2.54e-01 | -0.1207 |
| 1650 | DDOST | HTA11_83_2000001011 | Human | Colorectum | SER | 8.91e-04 | 4.01e-01 | -0.1526 |
| 1650 | DDOST | HTA11_696_2000001011 | Human | Colorectum | AD | 2.44e-30 | 7.39e-01 | -0.1464 |
| 1650 | DDOST | HTA11_866_2000001011 | Human | Colorectum | AD | 4.53e-06 | 3.05e-01 | -0.1001 |
| Page: 1 2 3 4 5 6 7 8 9 10 |
| Tissue | Expression Dynamics | Abbreviation |
| Cervix |  | CC: Cervix cancer |
| HSIL_HPV: HPV-infected high-grade squamous intraepithelial lesions | ||
| N_HPV: HPV-infected normal cervix | ||
| Colorectum (GSE201348) | 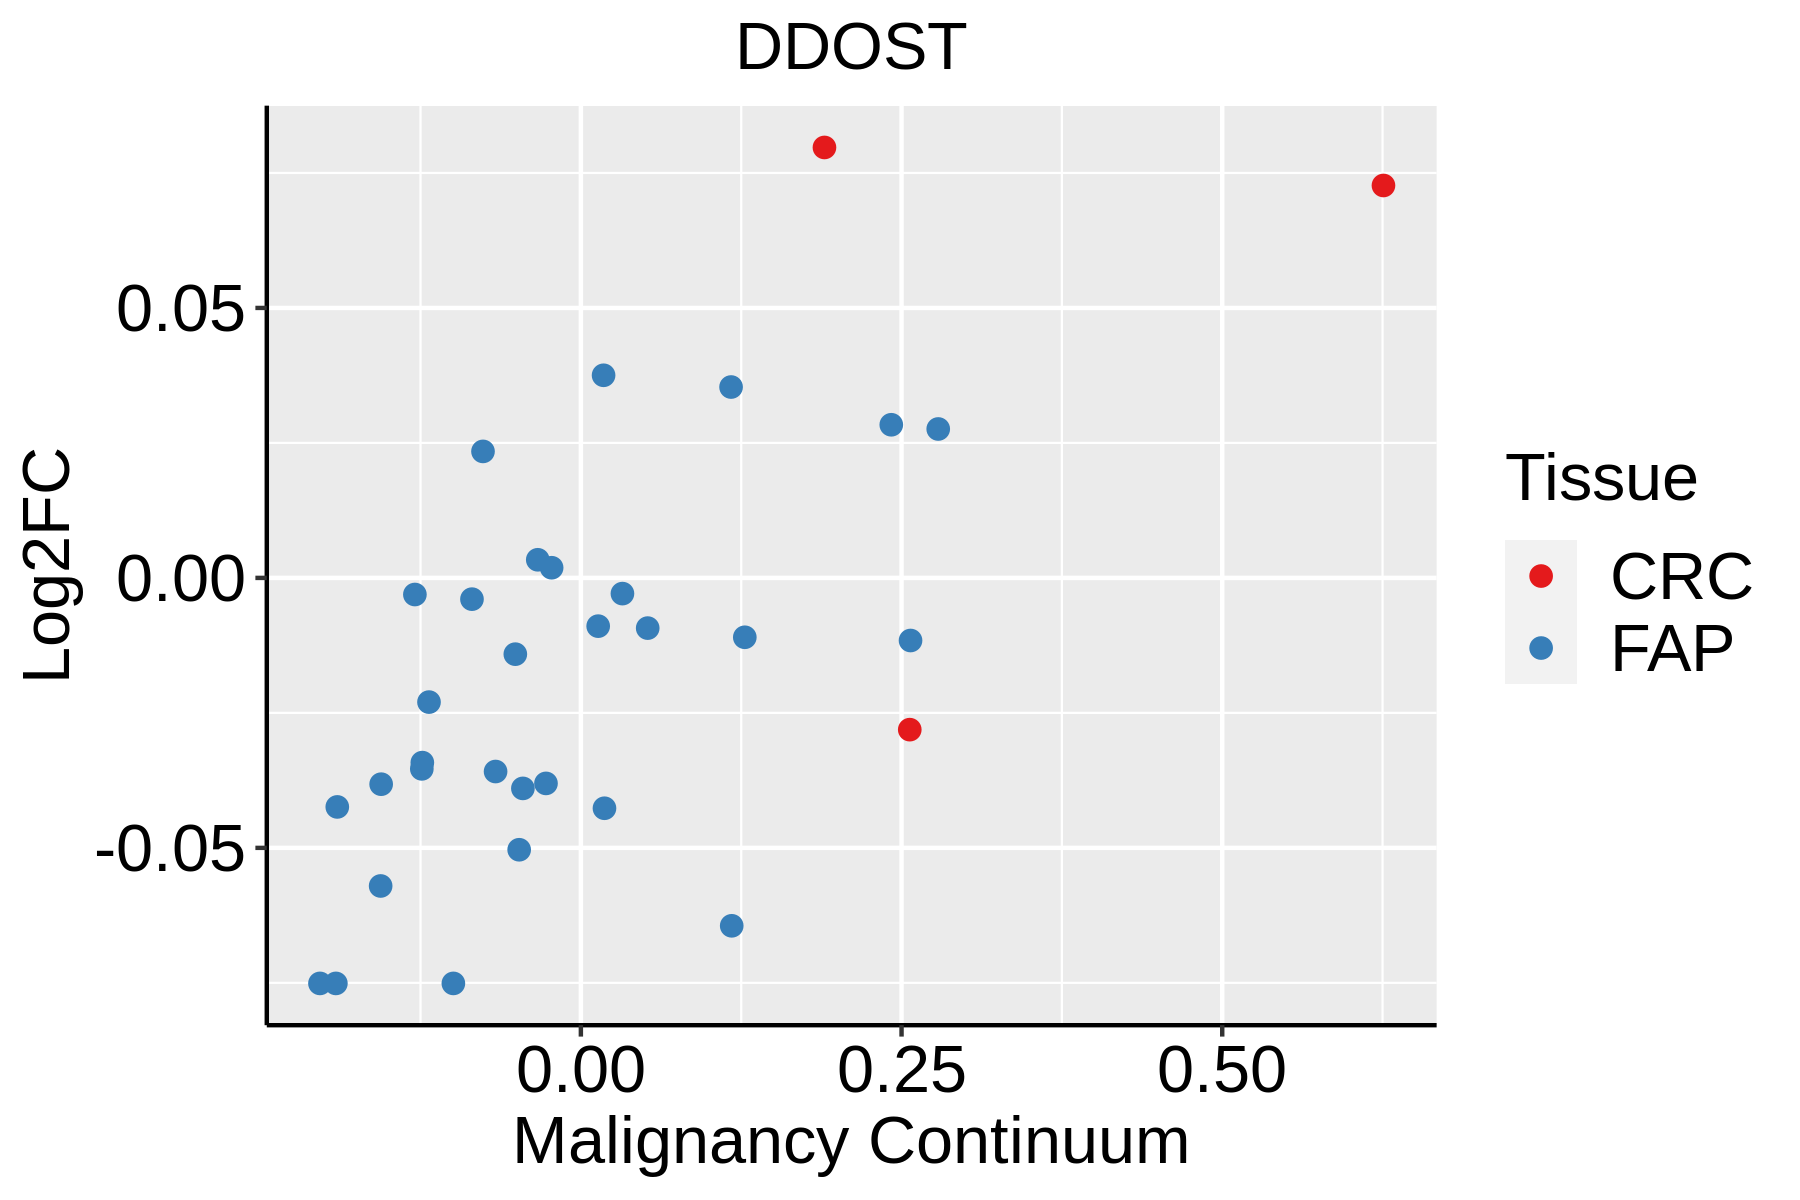 | FAP: Familial adenomatous polyposis |
| CRC: Colorectal cancer | ||
| Colorectum (HTA11) |  | AD: Adenomas |
| SER: Sessile serrated lesions | ||
| MSI-H: Microsatellite-high colorectal cancer | ||
| MSS: Microsatellite stable colorectal cancer | ||
| Endometrium | 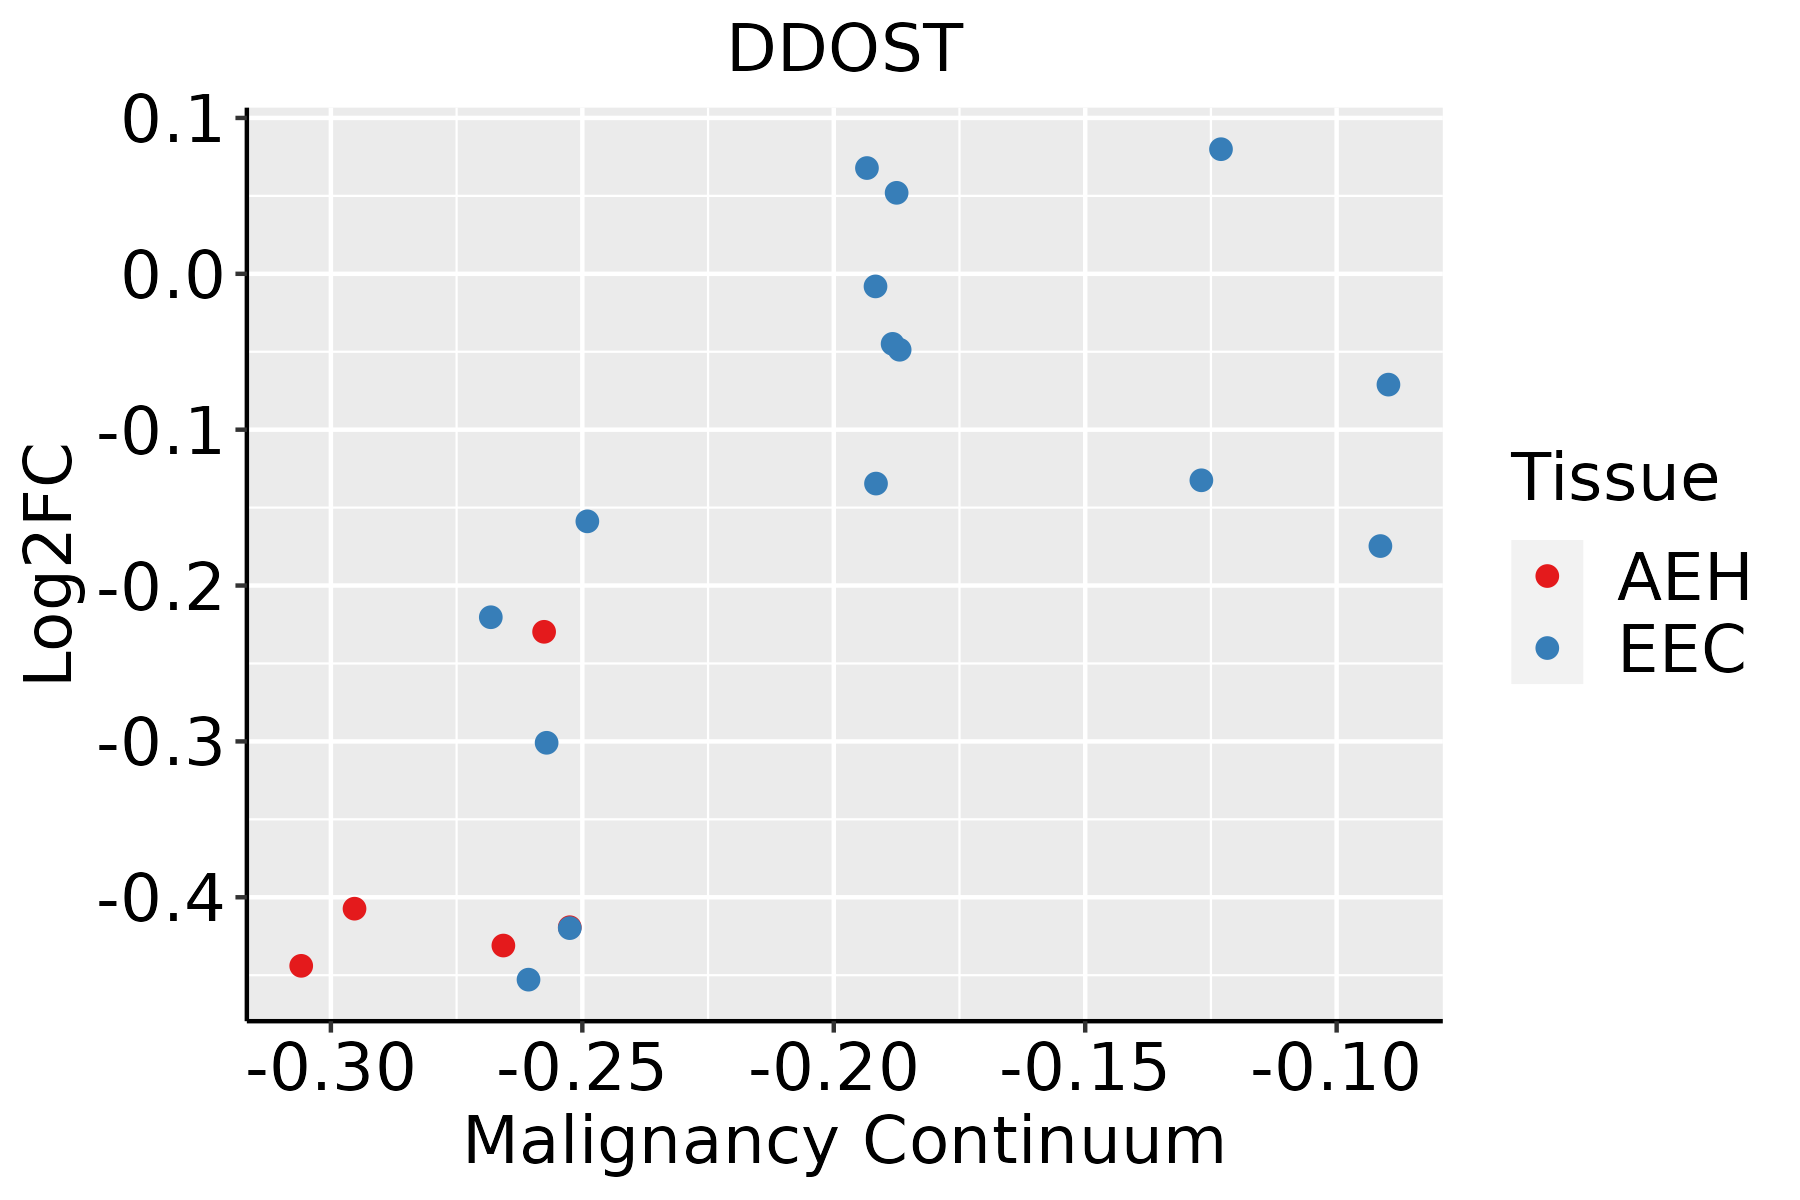 | AEH: Atypical endometrial hyperplasia |
| EEC: Endometrioid Cancer | ||
| Esophagus | 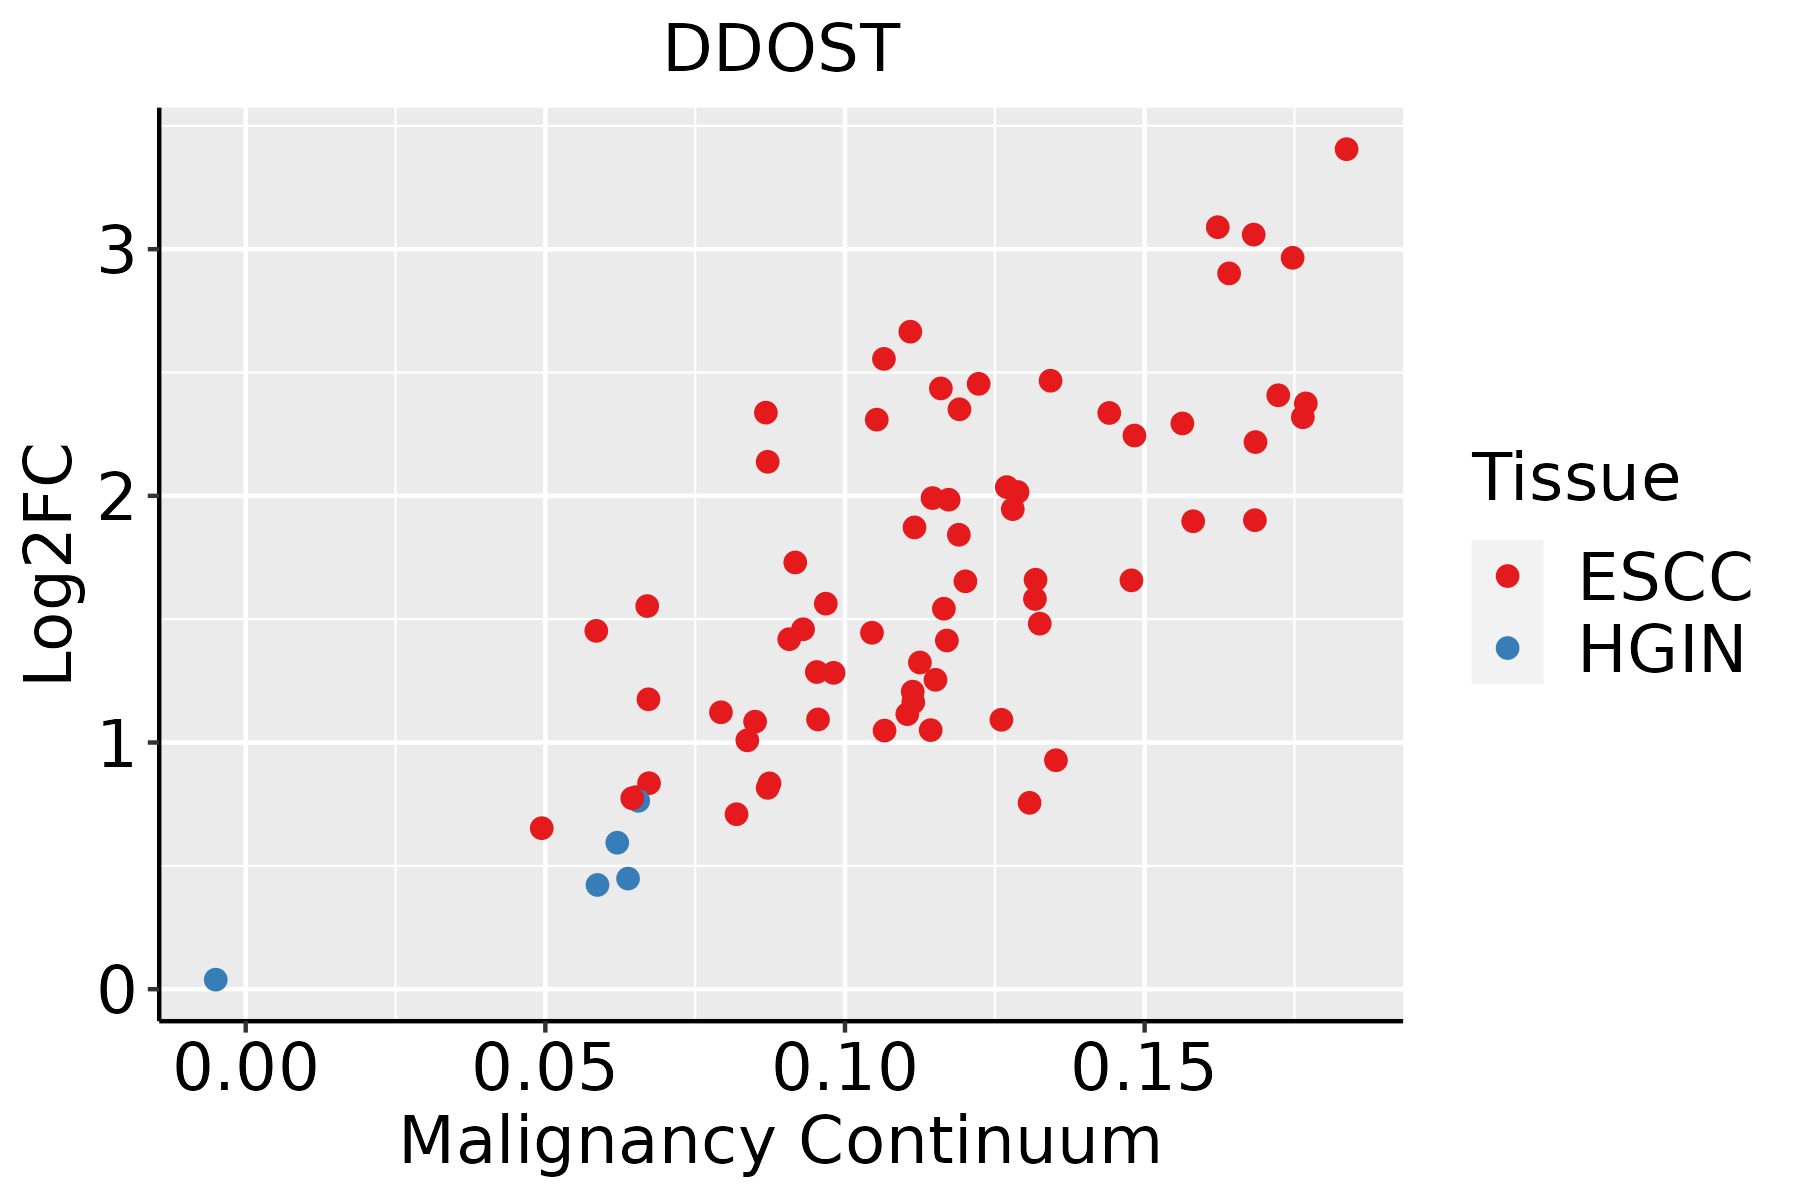 | ESCC: Esophageal squamous cell carcinoma |
| HGIN: High-grade intraepithelial neoplasias | ||
| LGIN: Low-grade intraepithelial neoplasias | ||
| Liver | 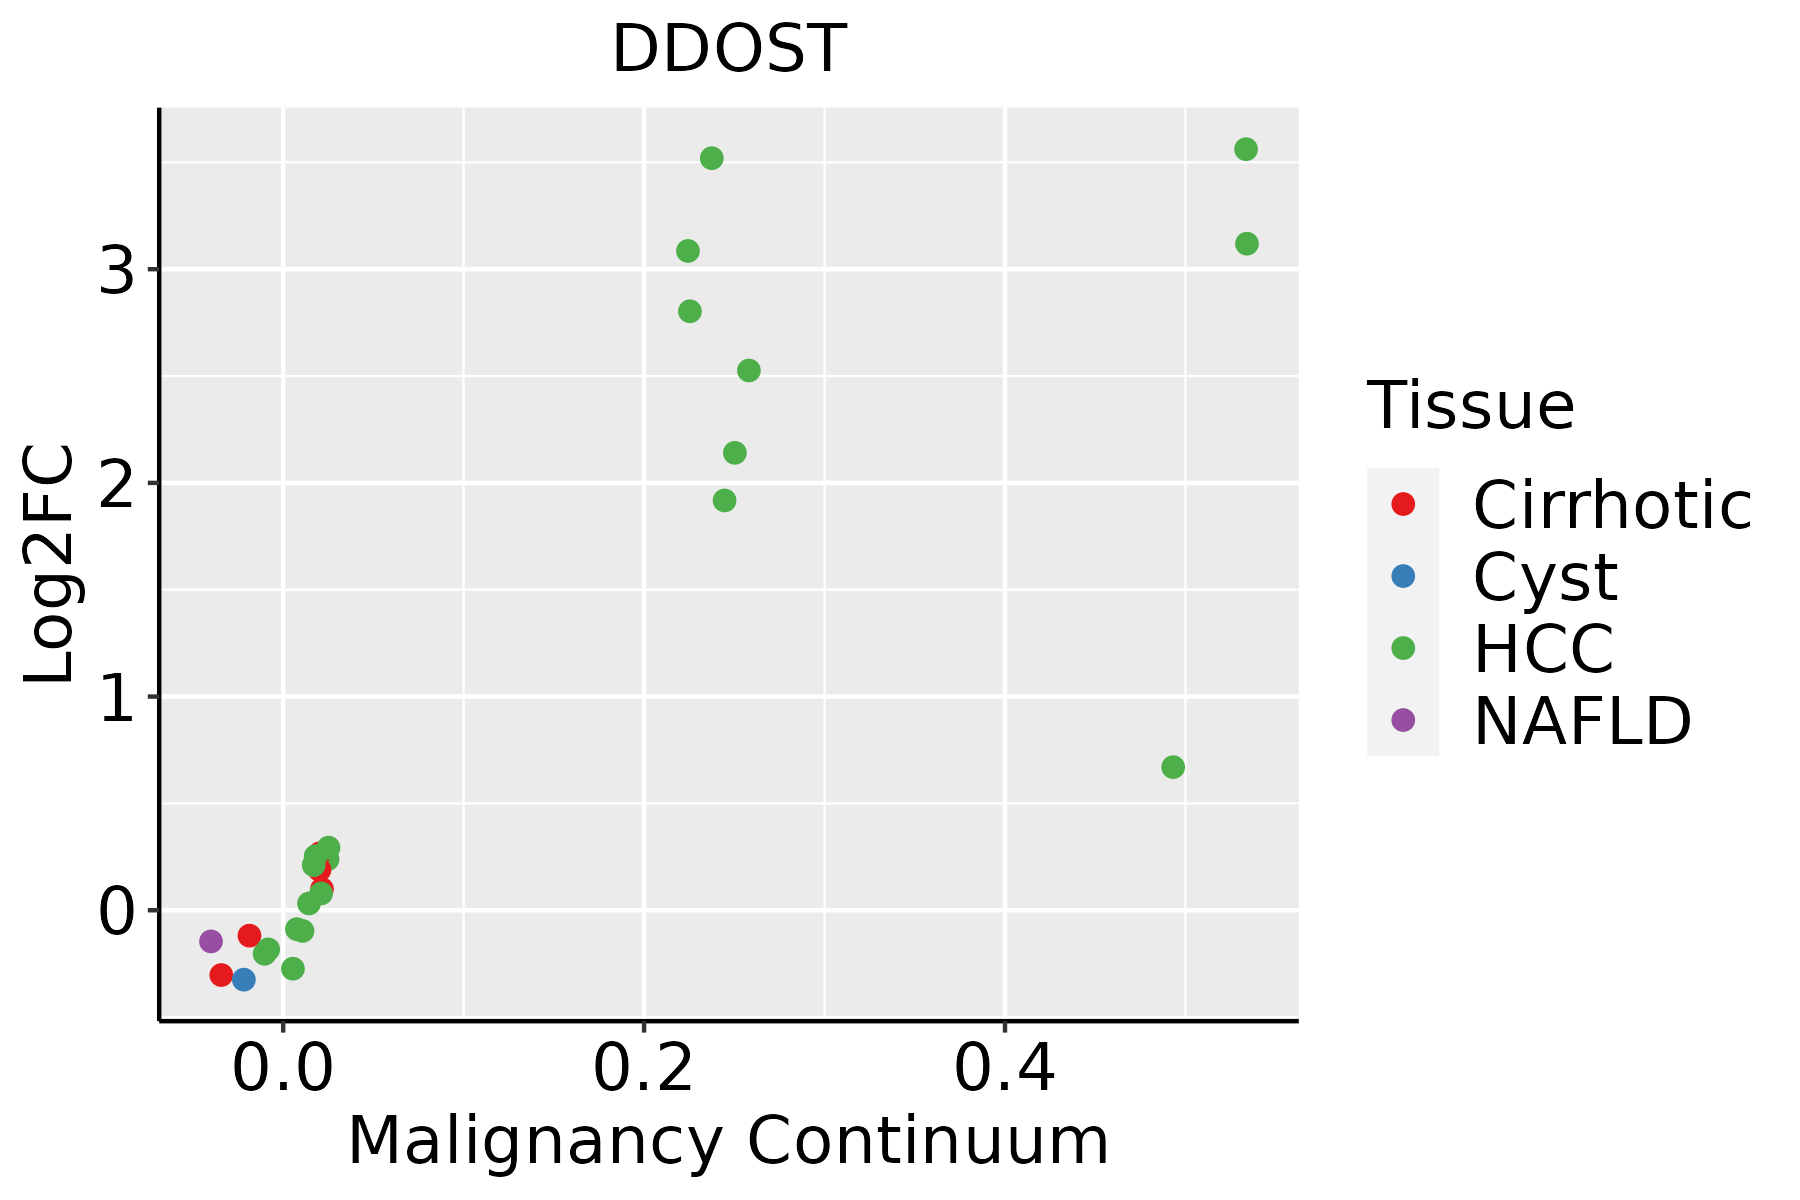 | HCC: Hepatocellular carcinoma |
| NAFLD: Non-alcoholic fatty liver disease | ||
| Oral Cavity | 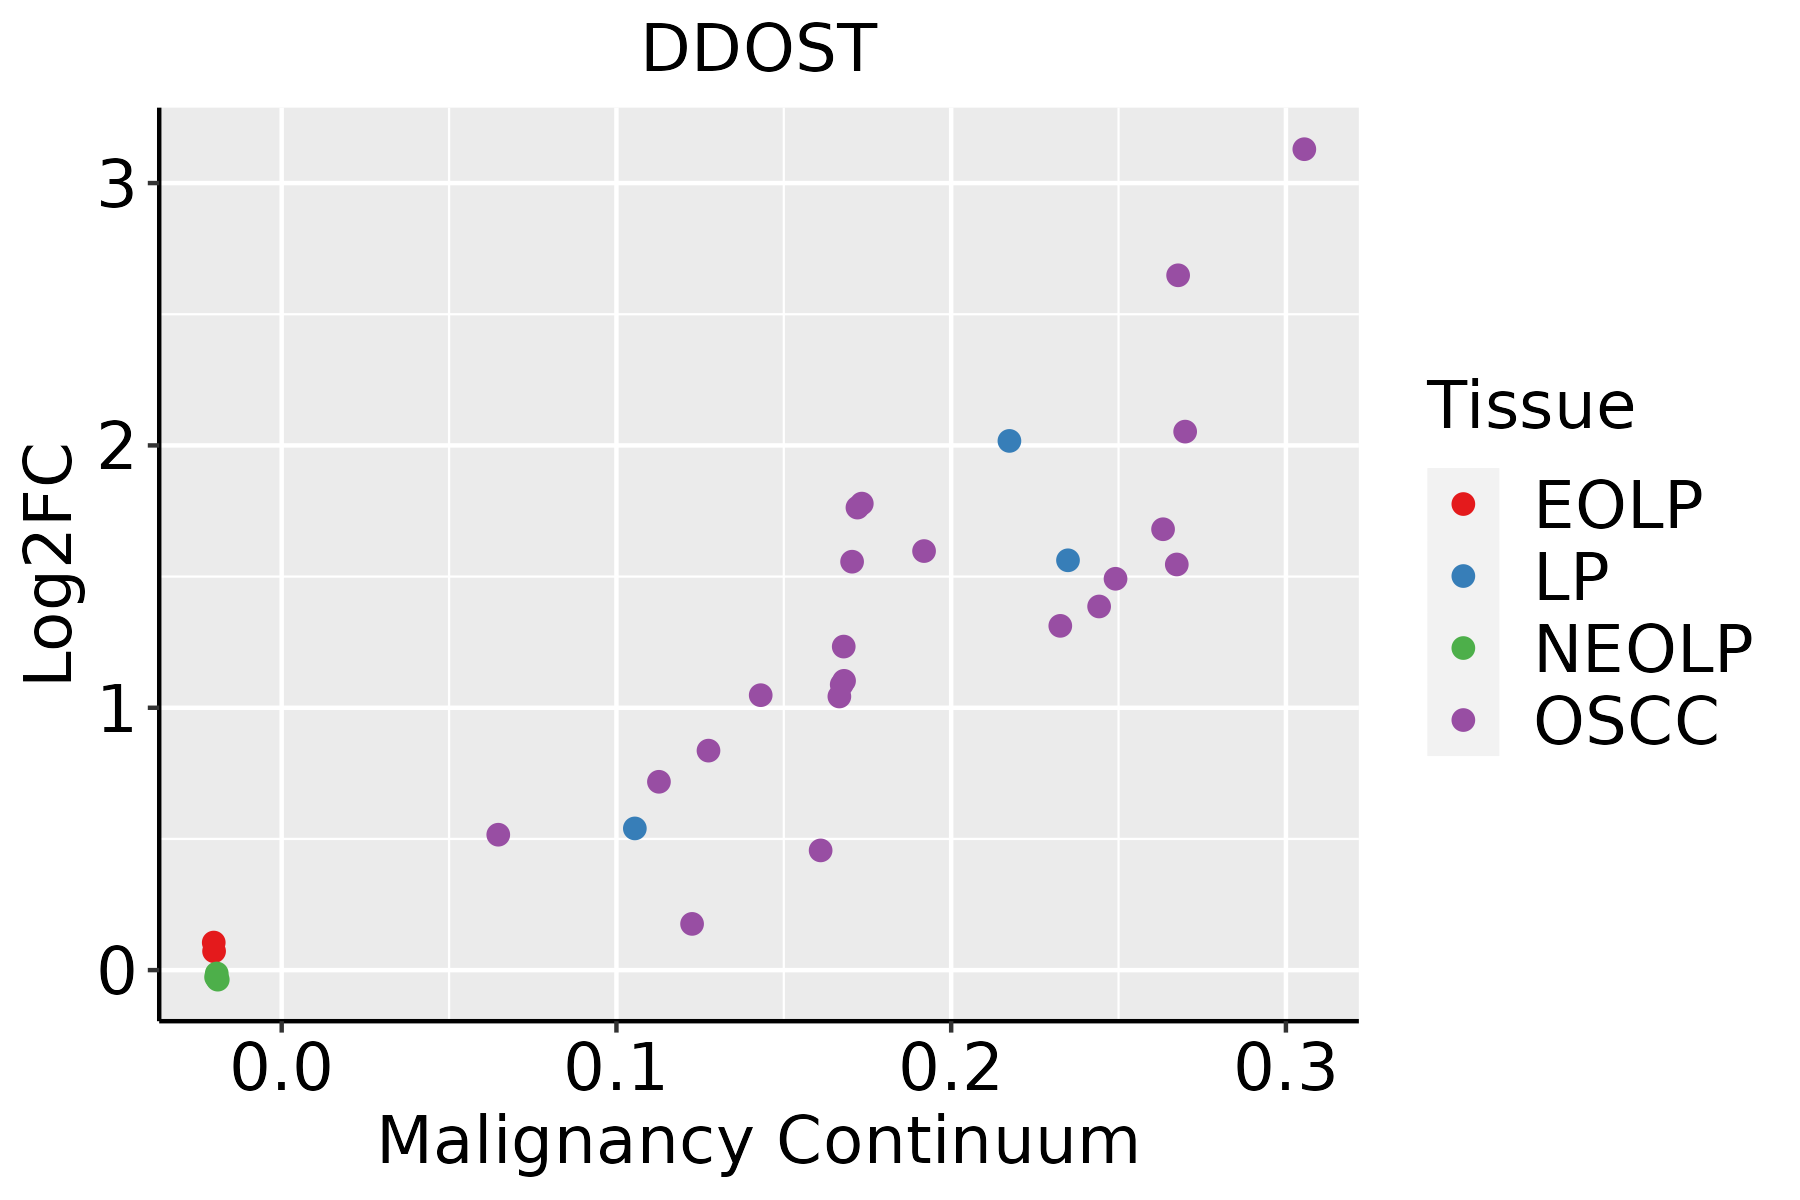 | EOLP: Erosive Oral lichen planus |
| LP: leukoplakia | ||
| NEOLP: Non-erosive oral lichen planus | ||
| OSCC: Oral squamous cell carcinoma | ||
| Prostate |  | BPH: Benign Prostatic Hyperplasia |
| Skin | 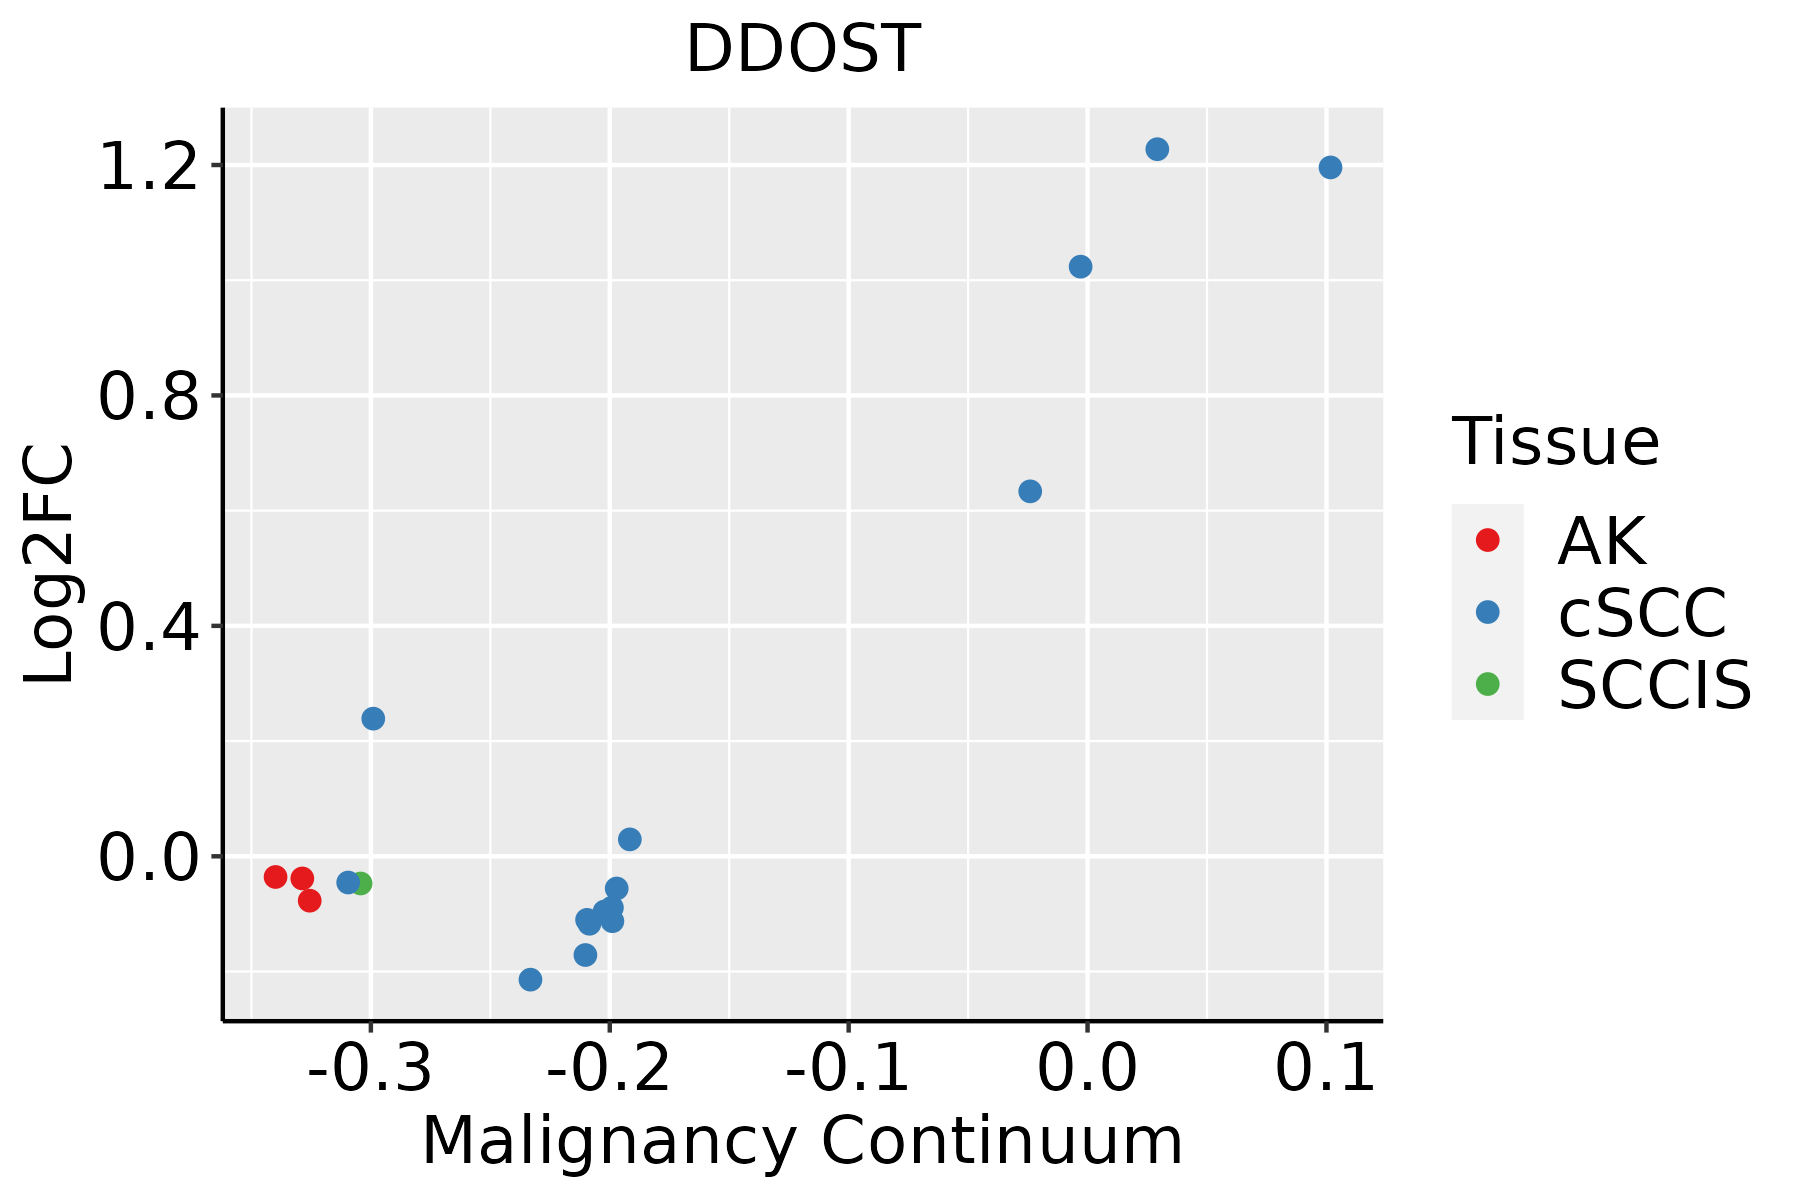 | AK: Actinic keratosis |
| cSCC: Cutaneous squamous cell carcinoma | ||
| SCCIS:squamous cell carcinoma in situ | ||
| Thyroid | 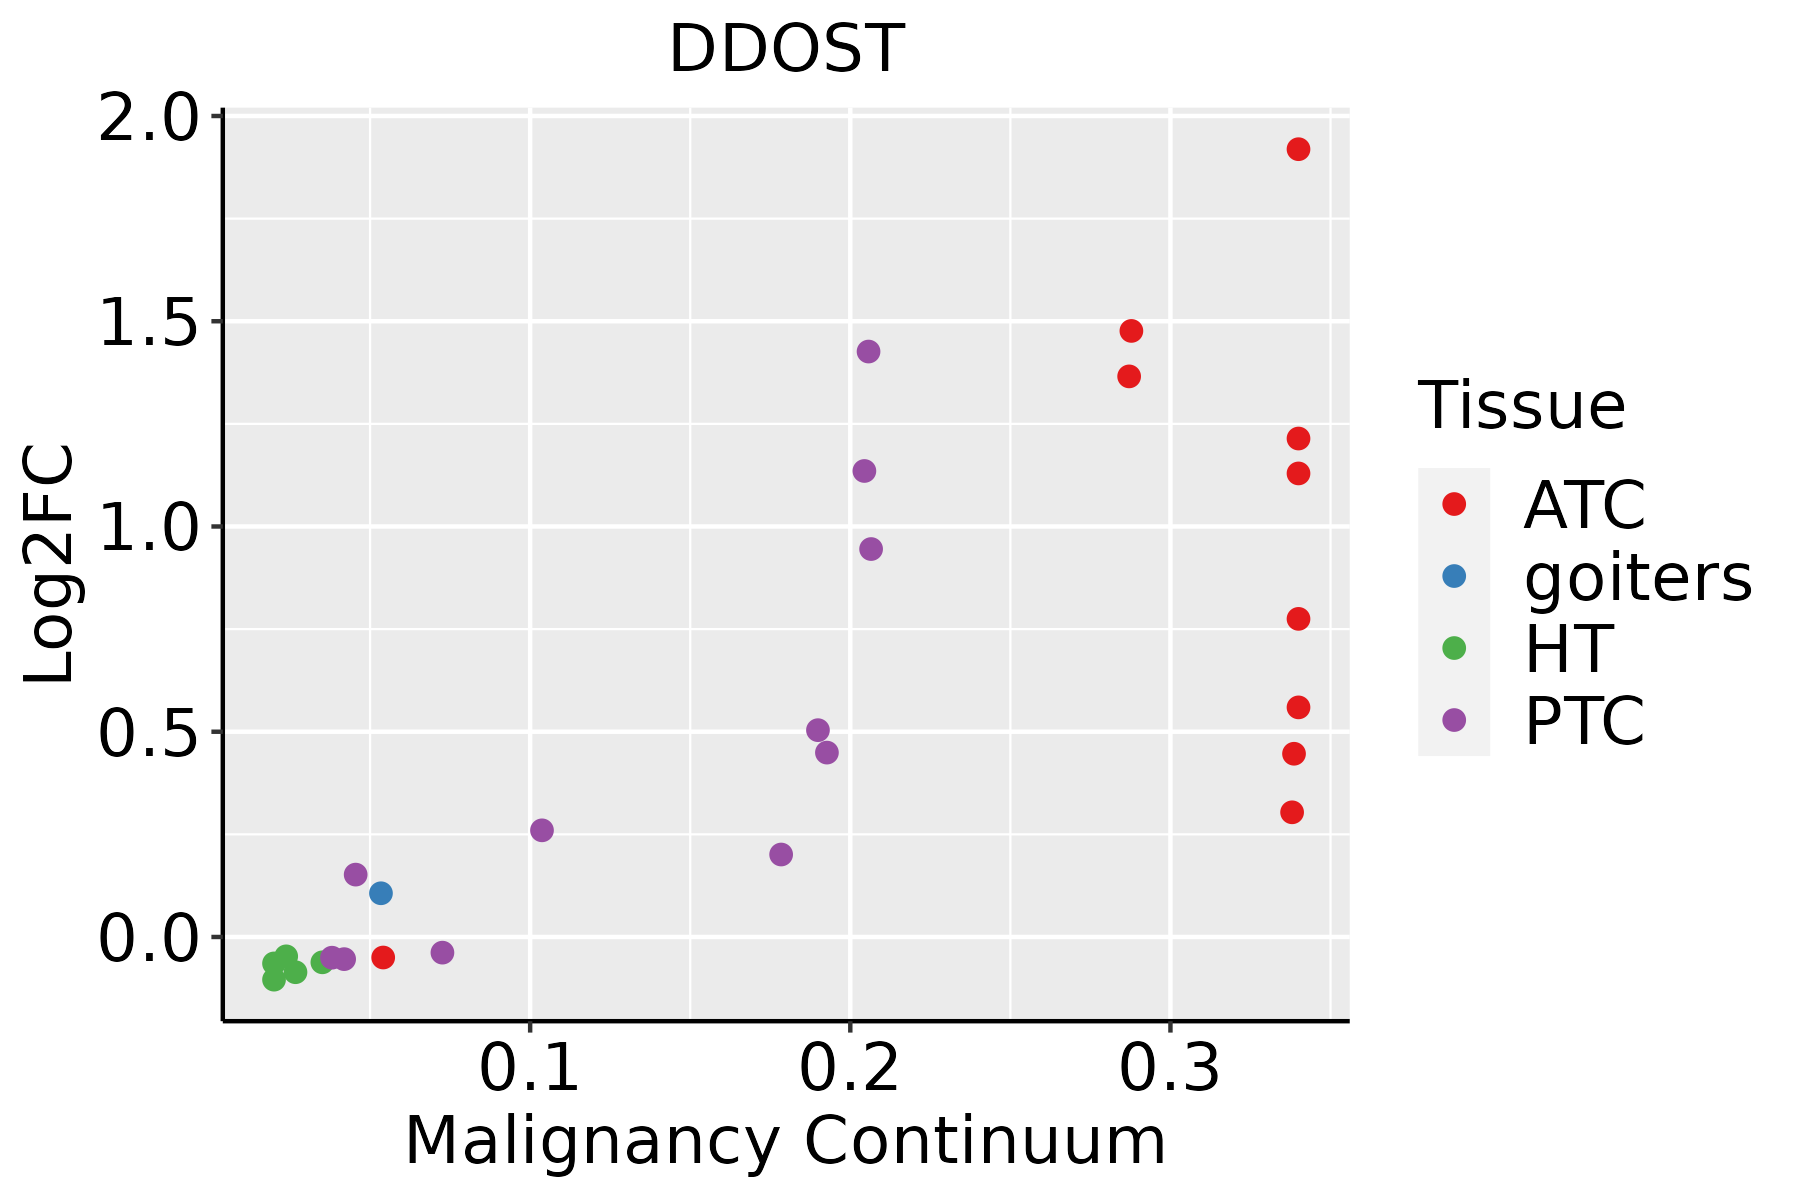 | ATC: Anaplastic thyroid cancer |
| HT: Hashimoto's thyroiditis | ||
| PTC: Papillary thyroid cancer |
| ∗log2FC in expression of this searched gene in stem-like cells from each diseased tissue sample relative to stem-like cells in normal samples in each tissue plotted against the malignancy continuum. Samples are colored based on if they are from different disease stage. |
Top |
Malignant transformation related pathway analysis |
| Find out the enriched GO biological processes and KEGG pathways involved in transition from healthy to precancer to cancer |
| Tissue | Disease Stage | Enriched GO biological Processes |
| Colorectum | AD |  |
| Colorectum | SER |  |
| Colorectum | MSS |  |
| Colorectum | MSI-H |  |
| Colorectum | FAP |  |
| ∗Top 15 enriched GO BP terms are showed in the bar plot of each disease state in each tissue. Each row represents a significant GO biological process which is colored according to the -log10(p.adjust). |
| Page: 1 2 3 4 5 6 7 8 9 |
| GO ID | Tissue | Disease Stage | Description | Gene Ratio | Bg Ratio | pvalue | p.adjust | Count |
| GO:00421108 | Cervix | CC | T cell activation | 107/2311 | 487/18723 | 1.24e-09 | 1.46e-07 | 107 |
| GO:003164710 | Cervix | CC | regulation of protein stability | 63/2311 | 298/18723 | 1.14e-05 | 2.45e-04 | 63 |
| GO:004211013 | Cervix | HSIL_HPV | T cell activation | 48/737 | 487/18723 | 5.12e-09 | 7.61e-07 | 48 |
| GO:003164715 | Cervix | HSIL_HPV | regulation of protein stability | 31/737 | 298/18723 | 8.69e-07 | 4.19e-05 | 31 |
| GO:004211022 | Cervix | N_HPV | T cell activation | 39/534 | 487/18723 | 7.04e-09 | 1.58e-06 | 39 |
| GO:003164725 | Cervix | N_HPV | regulation of protein stability | 17/534 | 298/18723 | 5.47e-03 | 3.90e-02 | 17 |
| GO:0031647 | Colorectum | AD | regulation of protein stability | 108/3918 | 298/18723 | 6.33e-10 | 5.08e-08 | 108 |
| GO:0018279 | Colorectum | AD | protein N-linked glycosylation via asparagine | 15/3918 | 23/18723 | 5.47e-06 | 1.40e-04 | 15 |
| GO:0018196 | Colorectum | AD | peptidyl-asparagine modification | 15/3918 | 24/18723 | 1.18e-05 | 2.62e-04 | 15 |
| GO:0006487 | Colorectum | AD | protein N-linked glycosylation | 25/3918 | 65/18723 | 9.12e-04 | 8.71e-03 | 25 |
| GO:0006486 | Colorectum | AD | protein glycosylation | 64/3918 | 226/18723 | 4.86e-03 | 3.27e-02 | 64 |
| GO:0043413 | Colorectum | AD | macromolecule glycosylation | 64/3918 | 226/18723 | 4.86e-03 | 3.27e-02 | 64 |
| GO:0070085 | Colorectum | AD | glycosylation | 67/3918 | 240/18723 | 5.78e-03 | 3.67e-02 | 67 |
| GO:00316471 | Colorectum | SER | regulation of protein stability | 86/2897 | 298/18723 | 2.56e-09 | 2.42e-07 | 86 |
| GO:00182791 | Colorectum | SER | protein N-linked glycosylation via asparagine | 9/2897 | 23/18723 | 5.20e-03 | 3.95e-02 | 9 |
| GO:00181961 | Colorectum | SER | peptidyl-asparagine modification | 9/2897 | 24/18723 | 7.19e-03 | 4.99e-02 | 9 |
| GO:00316472 | Colorectum | MSS | regulation of protein stability | 103/3467 | 298/18723 | 2.52e-11 | 3.49e-09 | 103 |
| GO:00182792 | Colorectum | MSS | protein N-linked glycosylation via asparagine | 13/3467 | 23/18723 | 5.21e-05 | 9.31e-04 | 13 |
| GO:00181962 | Colorectum | MSS | peptidyl-asparagine modification | 13/3467 | 24/18723 | 9.44e-05 | 1.49e-03 | 13 |
| GO:00064871 | Colorectum | MSS | protein N-linked glycosylation | 23/3467 | 65/18723 | 9.47e-04 | 9.54e-03 | 23 |
| Page: 1 2 3 4 5 6 |
| Pathway ID | Tissue | Disease Stage | Description | Gene Ratio | Bg Ratio | pvalue | p.adjust | qvalue | Count |
| hsa0414120 | Cervix | CC | Protein processing in endoplasmic reticulum | 55/1267 | 174/8465 | 1.74e-08 | 2.68e-07 | 1.58e-07 | 55 |
| hsa04141110 | Cervix | CC | Protein processing in endoplasmic reticulum | 55/1267 | 174/8465 | 1.74e-08 | 2.68e-07 | 1.58e-07 | 55 |
| hsa0414125 | Cervix | HSIL_HPV | Protein processing in endoplasmic reticulum | 21/459 | 174/8465 | 4.54e-04 | 3.80e-03 | 3.07e-03 | 21 |
| hsa0414135 | Cervix | HSIL_HPV | Protein processing in endoplasmic reticulum | 21/459 | 174/8465 | 4.54e-04 | 3.80e-03 | 3.07e-03 | 21 |
| hsa0414144 | Cervix | N_HPV | Protein processing in endoplasmic reticulum | 21/349 | 174/8465 | 8.84e-06 | 1.09e-04 | 8.55e-05 | 21 |
| hsa0414154 | Cervix | N_HPV | Protein processing in endoplasmic reticulum | 21/349 | 174/8465 | 8.84e-06 | 1.09e-04 | 8.55e-05 | 21 |
| hsa04141 | Colorectum | AD | Protein processing in endoplasmic reticulum | 80/2092 | 174/8465 | 5.96e-10 | 1.25e-08 | 7.96e-09 | 80 |
| hsa041411 | Colorectum | AD | Protein processing in endoplasmic reticulum | 80/2092 | 174/8465 | 5.96e-10 | 1.25e-08 | 7.96e-09 | 80 |
| hsa041412 | Colorectum | SER | Protein processing in endoplasmic reticulum | 60/1580 | 174/8465 | 4.20e-07 | 7.33e-06 | 5.32e-06 | 60 |
| hsa041413 | Colorectum | SER | Protein processing in endoplasmic reticulum | 60/1580 | 174/8465 | 4.20e-07 | 7.33e-06 | 5.32e-06 | 60 |
| hsa041414 | Colorectum | MSS | Protein processing in endoplasmic reticulum | 75/1875 | 174/8465 | 3.78e-10 | 8.44e-09 | 5.17e-09 | 75 |
| hsa005102 | Colorectum | MSS | N-Glycan biosynthesis | 20/1875 | 53/8465 | 7.17e-03 | 2.83e-02 | 1.73e-02 | 20 |
| hsa00513 | Colorectum | MSS | Various types of N-glycan biosynthesis | 16/1875 | 42/8465 | 1.39e-02 | 4.53e-02 | 2.77e-02 | 16 |
| hsa041415 | Colorectum | MSS | Protein processing in endoplasmic reticulum | 75/1875 | 174/8465 | 3.78e-10 | 8.44e-09 | 5.17e-09 | 75 |
| hsa005103 | Colorectum | MSS | N-Glycan biosynthesis | 20/1875 | 53/8465 | 7.17e-03 | 2.83e-02 | 1.73e-02 | 20 |
| hsa005131 | Colorectum | MSS | Various types of N-glycan biosynthesis | 16/1875 | 42/8465 | 1.39e-02 | 4.53e-02 | 2.77e-02 | 16 |
| hsa041416 | Colorectum | MSI-H | Protein processing in endoplasmic reticulum | 46/797 | 174/8465 | 4.53e-11 | 9.78e-10 | 8.19e-10 | 46 |
| hsa041417 | Colorectum | MSI-H | Protein processing in endoplasmic reticulum | 46/797 | 174/8465 | 4.53e-11 | 9.78e-10 | 8.19e-10 | 46 |
| hsa0414126 | Endometrium | AEH | Protein processing in endoplasmic reticulum | 62/1197 | 174/8465 | 5.97e-13 | 1.39e-11 | 1.01e-11 | 62 |
| hsa04141111 | Endometrium | AEH | Protein processing in endoplasmic reticulum | 62/1197 | 174/8465 | 5.97e-13 | 1.39e-11 | 1.01e-11 | 62 |
| Page: 1 2 3 |
Top |
Cell-cell communication analysis |
| Identification of potential cell-cell interactions between two cell types and their ligand-receptor pairs for different disease states |
| Ligand | Receptor | LRpair | Pathway | Tissue | Disease Stage |
| Page: 1 |
Top |
Single-cell gene regulatory network inference analysis |
| Find out the significant the regulons (TFs) and the target genes of each regulon across cell types for different disease states |
| TF | Cell Type | Tissue | Disease Stage | Target Gene | RSS | Regulon Activity |
| ∗The dot plots of a searched regulon are shown for all cell subpopulations in each disease state of each tissue based on the regulon specific score inferred using pySCENIC and by calculating the average expression. |
| Page: 1 |
Top |
Somatic mutation of malignant transformation related genes |
| Annotation of somatic variants for genes involved in malignant transformation |
| Hugo Symbol | Variant Class | Variant Classification | dbSNP RS | HGVSc | HGVSp | HGVSp Short | SWISSPROT | BIOTYPE | SIFT | PolyPhen | Tumor Sample Barcode | Tissue | Histology | Sex | Age | Stage | Therapy Types | Drugs | Outcome |
| DDOST | SNV | Missense_Mutation | novel | c.424G>A | p.Gly142Ser | p.G142S | P39656 | protein_coding | deleterious(0.01) | benign(0.403) | TCGA-AQ-A54N-01 | Breast | breast invasive carcinoma | Female | <65 | I/II | Unknown | Unknown | SD |
| DDOST | SNV | Missense_Mutation | novel | c.1076N>C | p.Arg359Pro | p.R359P | P39656 | protein_coding | deleterious(0) | possibly_damaging(0.804) | TCGA-B6-A0RE-01 | Breast | breast invasive carcinoma | Female | <65 | I/II | Unknown | Unknown | SD |
| DDOST | deletion | Frame_Shift_Del | novel | c.988delC | p.Leu330Ter | p.L330* | P39656 | protein_coding | TCGA-D8-A27V-01 | Breast | breast invasive carcinoma | Female | <65 | I/II | Hormone Therapy | tamoxiphen | SD | ||
| DDOST | SNV | Missense_Mutation | rs749627033 | c.613G>A | p.Asp205Asn | p.D205N | P39656 | protein_coding | tolerated(0.26) | benign(0.065) | TCGA-2W-A8YY-01 | Cervix | cervical & endocervical cancer | Female | <65 | I/II | Chemotherapy | cisplatin | CR |
| DDOST | SNV | Missense_Mutation | rs773138274 | c.1051N>A | p.Asp351Asn | p.D351N | P39656 | protein_coding | tolerated(0.41) | benign(0.014) | TCGA-AA-3492-01 | Colorectum | colon adenocarcinoma | Female | >=65 | I/II | Unknown | Unknown | SD |
| DDOST | SNV | Missense_Mutation | novel | c.551N>T | p.Pro184Leu | p.P184L | P39656 | protein_coding | deleterious(0.03) | benign(0.145) | TCGA-AA-3831-01 | Colorectum | colon adenocarcinoma | Male | >=65 | I/II | Unknown | Unknown | SD |
| DDOST | SNV | Missense_Mutation | novel | c.241G>T | p.Asp81Tyr | p.D81Y | P39656 | protein_coding | deleterious(0) | probably_damaging(0.979) | TCGA-AZ-4315-01 | Colorectum | colon adenocarcinoma | Male | <65 | I/II | Unknown | Unknown | SD |
| DDOST | SNV | Missense_Mutation | c.1006N>A | p.Val336Met | p.V336M | P39656 | protein_coding | tolerated(0.06) | possibly_damaging(0.877) | TCGA-G4-6628-01 | Colorectum | colon adenocarcinoma | Male | >=65 | I/II | Unknown | Unknown | SD | |
| DDOST | SNV | Missense_Mutation | novel | c.829N>C | p.Ala277Pro | p.A277P | P39656 | protein_coding | tolerated(0.2) | benign(0.251) | TCGA-AG-3883-01 | Colorectum | rectum adenocarcinoma | Male | >=65 | I/II | Unknown | Unknown | SD |
| DDOST | SNV | Missense_Mutation | c.761G>T | p.Arg254Leu | p.R254L | P39656 | protein_coding | deleterious(0) | probably_damaging(1) | TCGA-AJ-A3EK-01 | Endometrium | uterine corpus endometrioid carcinoma | Female | <65 | I/II | Chemotherapy | carboplatin | CR |
| Page: 1 2 3 |
Top |
Related drugs of malignant transformation related genes |
| Identification of chemicals and drugs interact with genes involved in malignant transfromation |
| (DGIdb 4.0) |
| Entrez ID | Symbol | Category | Interaction Types | Drug Claim Name | Drug Name | PMIDs |
| Page: 1 |

Copyright 2023-Present -The University of Texas Health Science Center at Houston |