
|
|||||
|
 | |
| |
| |
| |
| |
| |
|
Gene: DDI2 |
Gene summary for DDI2 |
| Gene information | Species | Human | Gene symbol | DDI2 | Gene ID | 84301 |
| Gene name | DNA damage inducible 1 homolog 2 | |
| Gene Alias | DDI2 | |
| Cytomap | 1p36.21 | |
| Gene Type | protein-coding | GO ID | GO:0006508 | UniProtAcc | Q5TDH0 |
Top |
Malignant transformation analysis |
| Identification of the aberrant gene expression in precancerous and cancerous lesions by comparing the gene expression of stem-like cells in diseased tissues with normal stem cells |
| Entrez ID | Symbol | Replicates | Species | Organ | Tissue | Adj P-value | Log2FC | Malignancy |
| 84301 | DDI2 | LZE4T | Human | Esophagus | ESCC | 2.37e-07 | 1.42e-01 | 0.0811 |
| 84301 | DDI2 | LZE5T | Human | Esophagus | ESCC | 1.61e-04 | 3.56e-01 | 0.0514 |
| 84301 | DDI2 | LZE7T | Human | Esophagus | ESCC | 1.57e-06 | 2.08e-01 | 0.0667 |
| 84301 | DDI2 | LZE20T | Human | Esophagus | ESCC | 3.11e-03 | 1.30e-01 | 0.0662 |
| 84301 | DDI2 | LZE22T | Human | Esophagus | ESCC | 9.57e-03 | 4.05e-01 | 0.068 |
| 84301 | DDI2 | LZE24T | Human | Esophagus | ESCC | 1.25e-14 | 4.78e-01 | 0.0596 |
| 84301 | DDI2 | LZE21T | Human | Esophagus | ESCC | 4.45e-04 | 2.12e-01 | 0.0655 |
| 84301 | DDI2 | P1T-E | Human | Esophagus | ESCC | 2.06e-11 | 3.53e-01 | 0.0875 |
| 84301 | DDI2 | P2T-E | Human | Esophagus | ESCC | 2.71e-11 | 2.56e-01 | 0.1177 |
| 84301 | DDI2 | P4T-E | Human | Esophagus | ESCC | 2.32e-18 | 1.69e-01 | 0.1323 |
| 84301 | DDI2 | P5T-E | Human | Esophagus | ESCC | 9.40e-06 | -2.99e-03 | 0.1327 |
| 84301 | DDI2 | P8T-E | Human | Esophagus | ESCC | 1.24e-19 | 2.34e-01 | 0.0889 |
| 84301 | DDI2 | P9T-E | Human | Esophagus | ESCC | 2.54e-07 | 7.90e-02 | 0.1131 |
| 84301 | DDI2 | P10T-E | Human | Esophagus | ESCC | 1.96e-19 | 3.22e-01 | 0.116 |
| 84301 | DDI2 | P11T-E | Human | Esophagus | ESCC | 2.06e-05 | 2.39e-01 | 0.1426 |
| 84301 | DDI2 | P12T-E | Human | Esophagus | ESCC | 6.49e-10 | 3.12e-01 | 0.1122 |
| 84301 | DDI2 | P15T-E | Human | Esophagus | ESCC | 6.78e-14 | 2.76e-01 | 0.1149 |
| 84301 | DDI2 | P16T-E | Human | Esophagus | ESCC | 4.40e-11 | 8.20e-02 | 0.1153 |
| 84301 | DDI2 | P17T-E | Human | Esophagus | ESCC | 6.74e-04 | 2.19e-01 | 0.1278 |
| 84301 | DDI2 | P19T-E | Human | Esophagus | ESCC | 5.94e-03 | 2.04e-01 | 0.1662 |
| Page: 1 2 3 4 |
| Tissue | Expression Dynamics | Abbreviation |
| Esophagus | 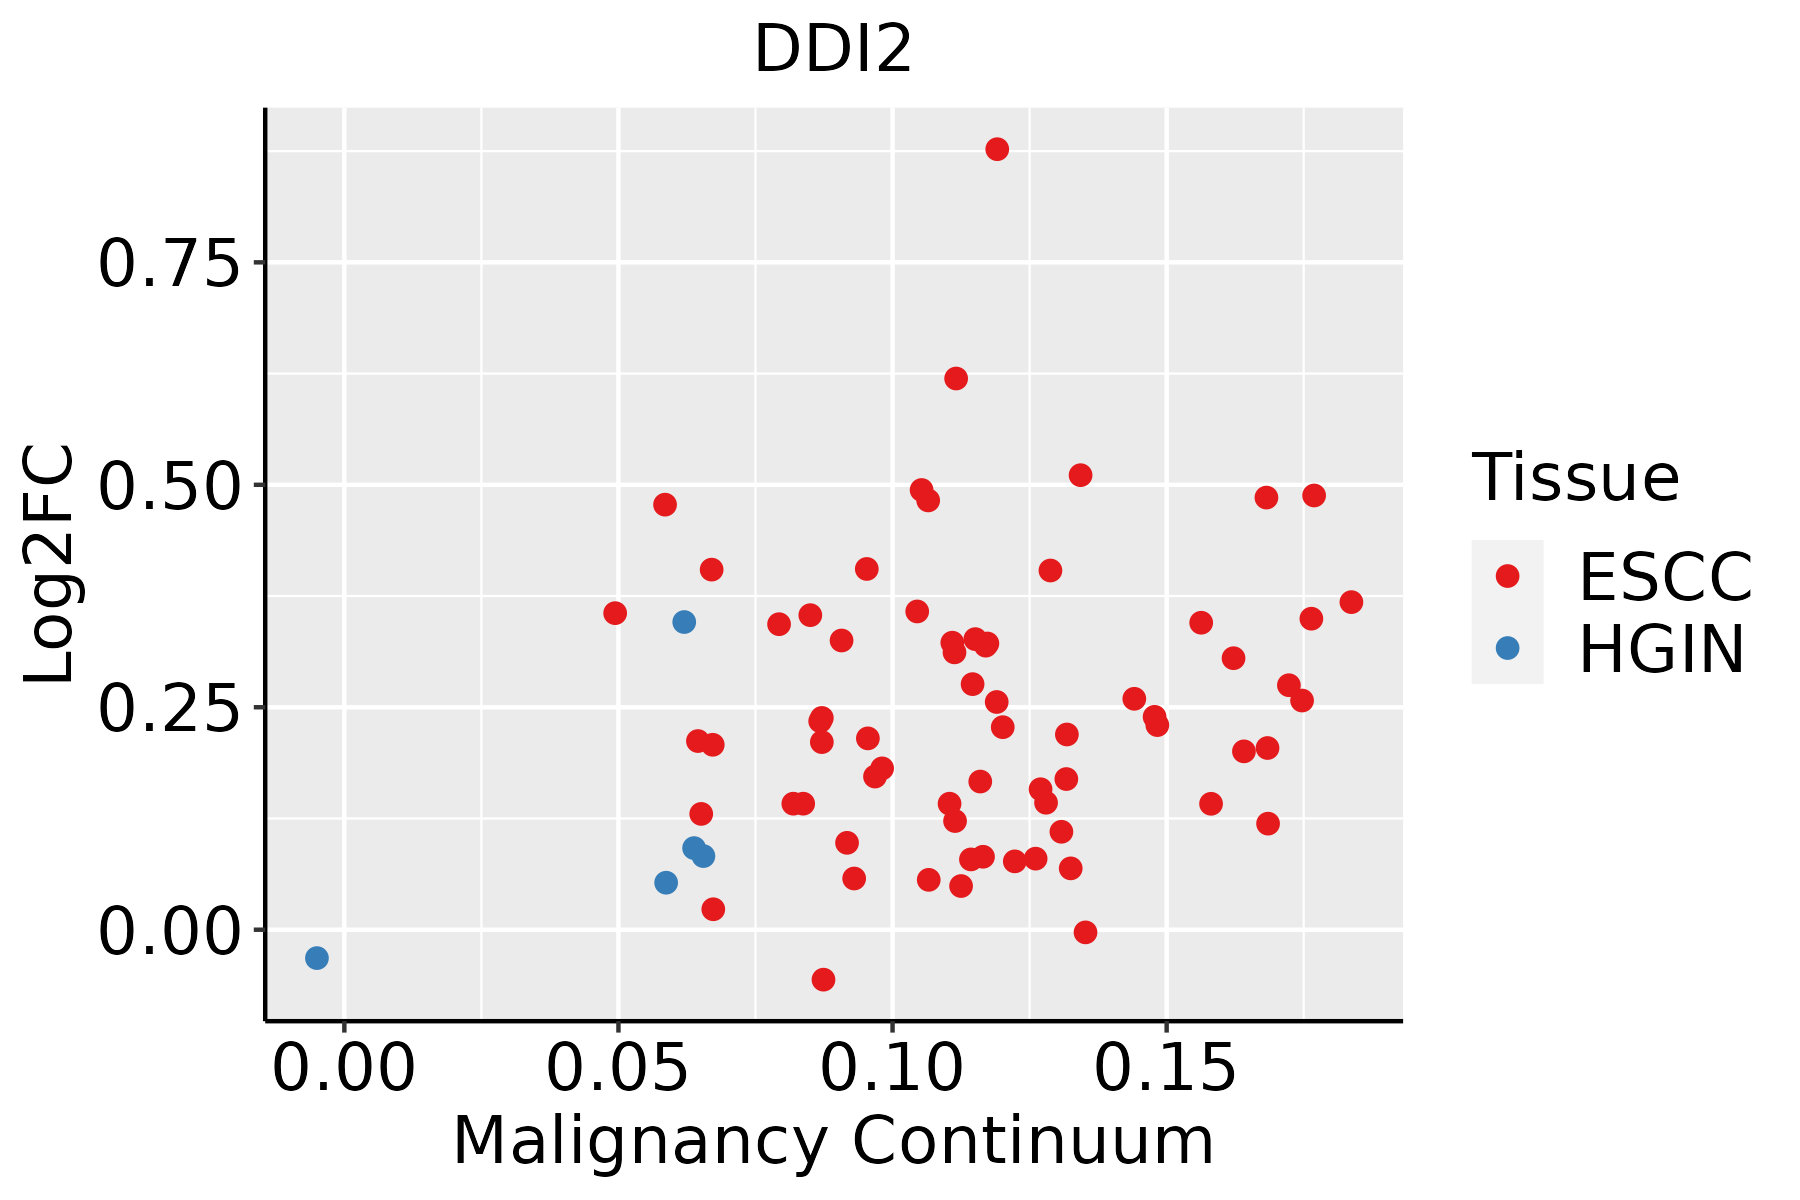 | ESCC: Esophageal squamous cell carcinoma |
| HGIN: High-grade intraepithelial neoplasias | ||
| LGIN: Low-grade intraepithelial neoplasias | ||
| Liver | 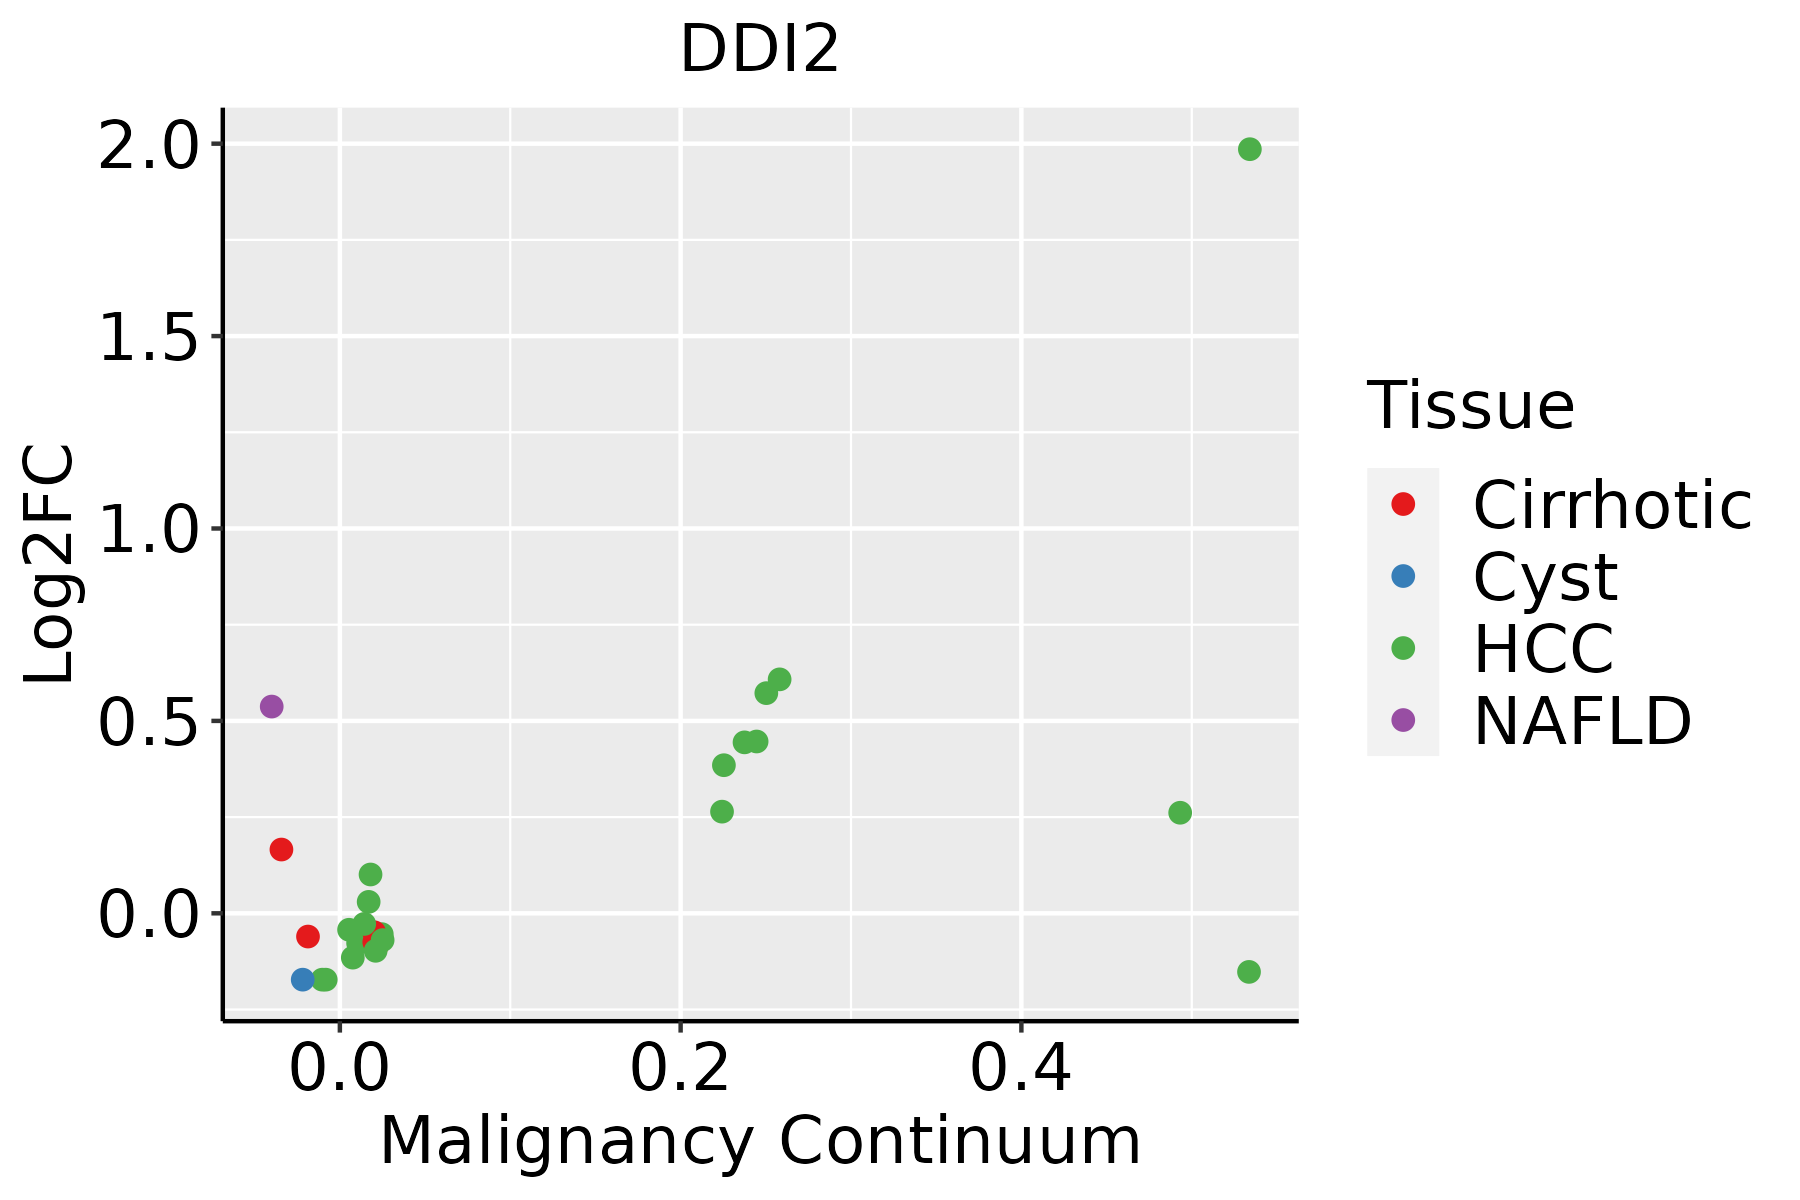 | HCC: Hepatocellular carcinoma |
| NAFLD: Non-alcoholic fatty liver disease | ||
| Prostate | 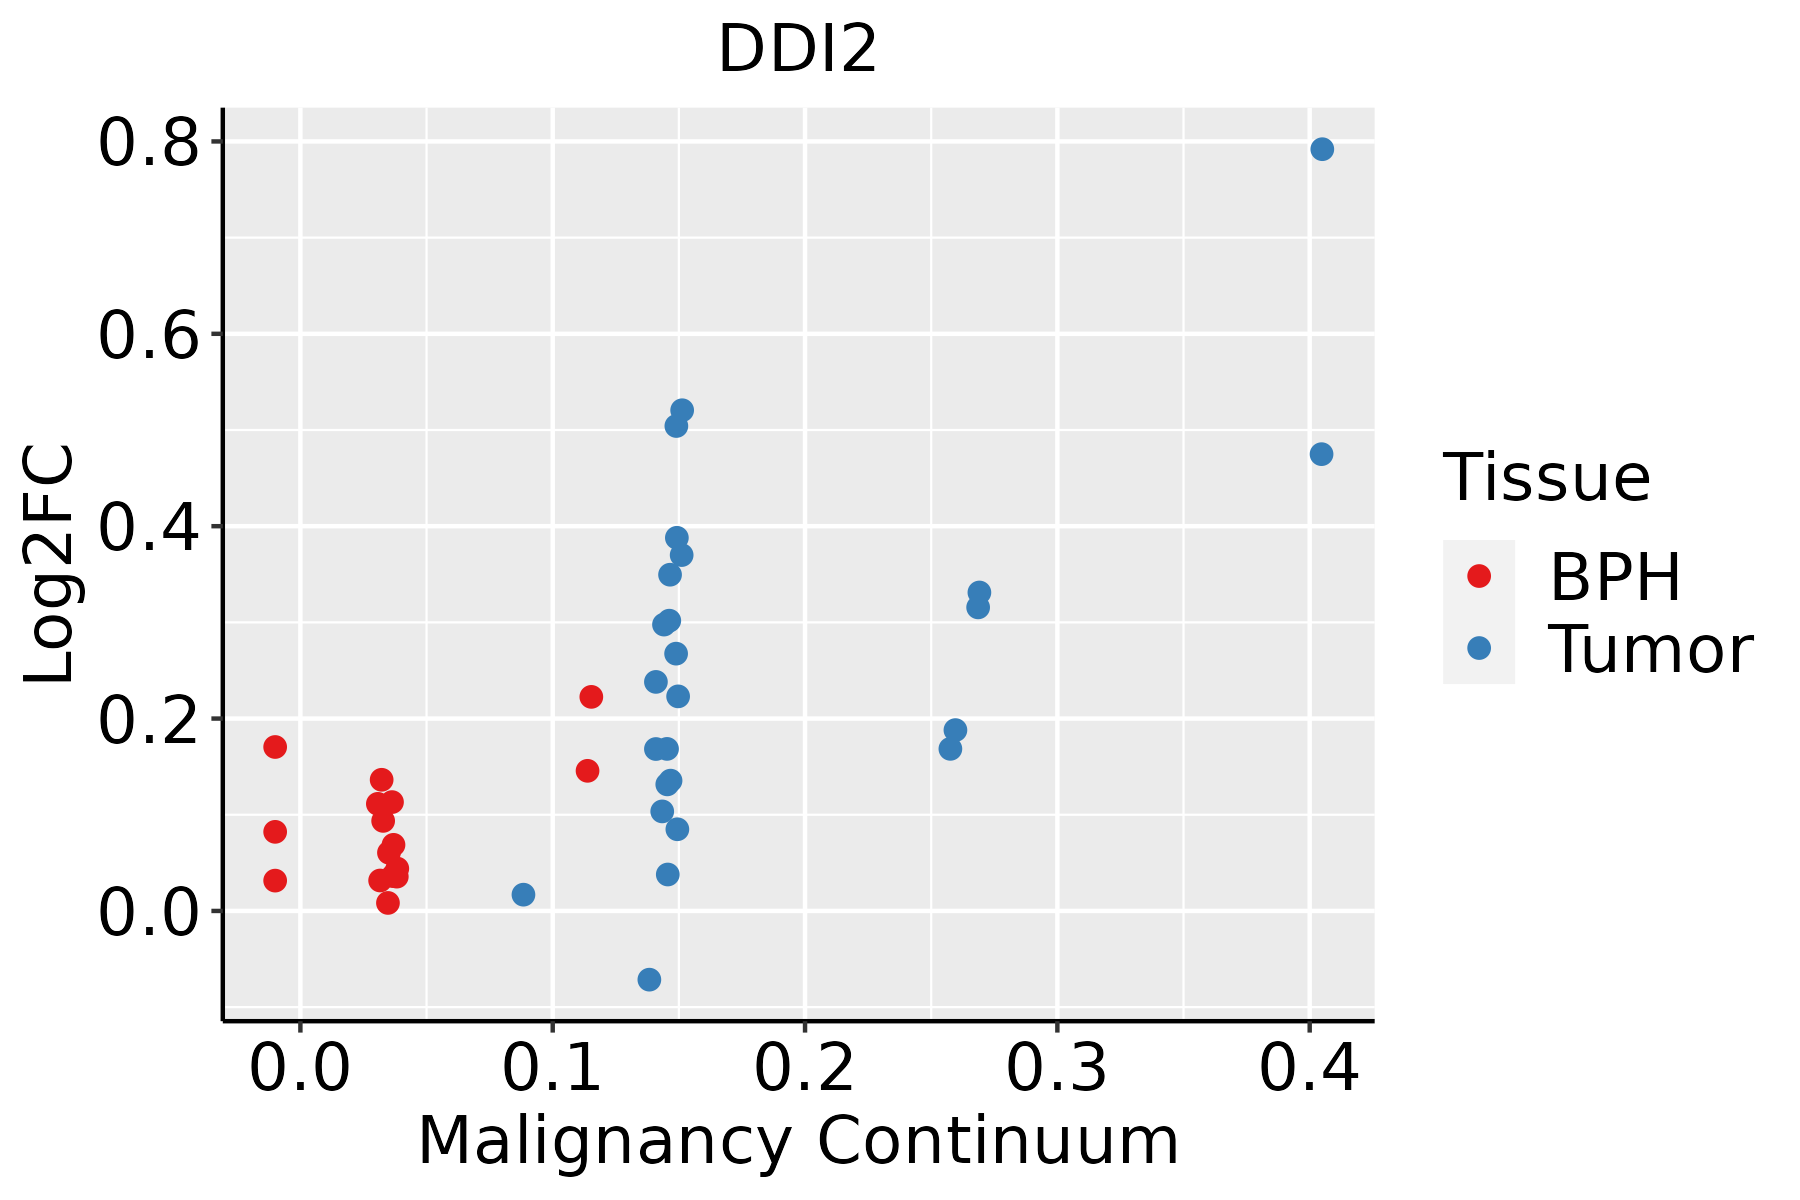 | BPH: Benign Prostatic Hyperplasia |
| ∗log2FC in expression of this searched gene in stem-like cells from each diseased tissue sample relative to stem-like cells in normal samples in each tissue plotted against the malignancy continuum. Samples are colored based on if they are from different disease stage. |
Top |
Malignant transformation related pathway analysis |
| Find out the enriched GO biological processes and KEGG pathways involved in transition from healthy to precancer to cancer |
| Tissue | Disease Stage | Enriched GO biological Processes |
| Colorectum | AD |  |
| Colorectum | SER |  |
| Colorectum | MSS |  |
| Colorectum | MSI-H |  |
| Colorectum | FAP |  |
| ∗Top 15 enriched GO BP terms are showed in the bar plot of each disease state in each tissue. Each row represents a significant GO biological process which is colored according to the -log10(p.adjust). |
| Page: 1 2 3 4 5 6 7 8 9 |
| GO ID | Tissue | Disease Stage | Description | Gene Ratio | Bg Ratio | pvalue | p.adjust | Count |
| GO:0010498111 | Esophagus | ESCC | proteasomal protein catabolic process | 369/8552 | 490/18723 | 1.13e-41 | 1.80e-38 | 369 |
| GO:0031647111 | Esophagus | ESCC | regulation of protein stability | 223/8552 | 298/18723 | 5.76e-25 | 1.52e-22 | 223 |
| GO:005160418 | Esophagus | ESCC | protein maturation | 189/8552 | 294/18723 | 7.64e-11 | 2.39e-09 | 189 |
| GO:001648514 | Esophagus | ESCC | protein processing | 134/8552 | 225/18723 | 1.81e-05 | 1.60e-04 | 134 |
| GO:007124117 | Esophagus | ESCC | cellular response to inorganic substance | 125/8552 | 226/18723 | 2.17e-03 | 9.67e-03 | 125 |
| GO:001049822 | Liver | HCC | proteasomal protein catabolic process | 351/7958 | 490/18723 | 6.92e-40 | 1.46e-36 | 351 |
| GO:003164722 | Liver | HCC | regulation of protein stability | 211/7958 | 298/18723 | 2.29e-23 | 5.01e-21 | 211 |
| GO:005160412 | Liver | HCC | protein maturation | 171/7958 | 294/18723 | 3.80e-08 | 8.30e-07 | 171 |
| GO:001648511 | Liver | HCC | protein processing | 121/7958 | 225/18723 | 4.01e-04 | 2.71e-03 | 121 |
| GO:007124112 | Liver | HCC | cellular response to inorganic substance | 119/7958 | 226/18723 | 1.26e-03 | 6.92e-03 | 119 |
| GO:003164718 | Prostate | BPH | regulation of protein stability | 111/3107 | 298/18723 | 4.58e-18 | 1.42e-15 | 111 |
| GO:001049818 | Prostate | BPH | proteasomal protein catabolic process | 153/3107 | 490/18723 | 4.13e-16 | 7.51e-14 | 153 |
| GO:00516049 | Prostate | BPH | protein maturation | 80/3107 | 294/18723 | 2.64e-06 | 4.23e-05 | 80 |
| GO:00164855 | Prostate | BPH | protein processing | 62/3107 | 225/18723 | 2.22e-05 | 2.67e-04 | 62 |
| GO:007124110 | Prostate | BPH | cellular response to inorganic substance | 62/3107 | 226/18723 | 2.57e-05 | 3.05e-04 | 62 |
| GO:003164719 | Prostate | Tumor | regulation of protein stability | 112/3246 | 298/18723 | 4.18e-17 | 1.18e-14 | 112 |
| GO:001049819 | Prostate | Tumor | proteasomal protein catabolic process | 158/3246 | 490/18723 | 3.05e-16 | 6.76e-14 | 158 |
| GO:007124114 | Prostate | Tumor | cellular response to inorganic substance | 66/3246 | 226/18723 | 6.63e-06 | 1.00e-04 | 66 |
| GO:005160415 | Prostate | Tumor | protein maturation | 81/3246 | 294/18723 | 7.58e-06 | 1.13e-04 | 81 |
| GO:001648512 | Prostate | Tumor | protein processing | 63/3246 | 225/18723 | 4.40e-05 | 4.98e-04 | 63 |
| Page: 1 |
| Pathway ID | Tissue | Disease Stage | Description | Gene Ratio | Bg Ratio | pvalue | p.adjust | qvalue | Count |
| Page: 1 |
Top |
Cell-cell communication analysis |
| Identification of potential cell-cell interactions between two cell types and their ligand-receptor pairs for different disease states |
| Ligand | Receptor | LRpair | Pathway | Tissue | Disease Stage |
| Page: 1 |
Top |
Single-cell gene regulatory network inference analysis |
| Find out the significant the regulons (TFs) and the target genes of each regulon across cell types for different disease states |
| TF | Cell Type | Tissue | Disease Stage | Target Gene | RSS | Regulon Activity |
| ∗The dot plots of a searched regulon are shown for all cell subpopulations in each disease state of each tissue based on the regulon specific score inferred using pySCENIC and by calculating the average expression. |
| Page: 1 |
Top |
Somatic mutation of malignant transformation related genes |
| Annotation of somatic variants for genes involved in malignant transformation |
| Hugo Symbol | Variant Class | Variant Classification | dbSNP RS | HGVSc | HGVSp | HGVSp Short | SWISSPROT | BIOTYPE | SIFT | PolyPhen | Tumor Sample Barcode | Tissue | Histology | Sex | Age | Stage | Therapy Types | Drugs | Outcome |
| DDI2 | SNV | Missense_Mutation | c.1171G>T | p.Ala391Ser | p.A391S | Q5TDH0 | protein_coding | tolerated(0.69) | benign(0.017) | TCGA-AO-A0J3-01 | Breast | breast invasive carcinoma | Female | >=65 | I/II | Chemotherapy | cyclophosphamide | SD | |
| DDI2 | SNV | Missense_Mutation | novel | c.412N>G | p.Leu138Val | p.L138V | Q5TDH0 | protein_coding | tolerated(0.46) | benign(0.013) | TCGA-C8-A3M8-01 | Breast | breast invasive carcinoma | Female | >=65 | I/II | Hormone Therapy | tamoxiphen | CR |
| DDI2 | insertion | Frame_Shift_Ins | novel | c.1176_1177insATTCTAAATAGAACGAATGAAT | p.Asp393IlefsTer8 | p.D393Ifs*8 | Q5TDH0 | protein_coding | TCGA-A7-A0CE-01 | Breast | breast invasive carcinoma | Female | <65 | I/II | Chemotherapy | adriamycin | SD | ||
| DDI2 | SNV | Missense_Mutation | c.1063N>A | p.Glu355Lys | p.E355K | Q5TDH0 | protein_coding | deleterious(0) | probably_damaging(0.997) | TCGA-UC-A7PF-01 | Cervix | cervical & endocervical cancer | Female | <65 | I/II | Unknown | Unknown | SD | |
| DDI2 | SNV | Missense_Mutation | c.661N>T | p.Ile221Leu | p.I221L | Q5TDH0 | protein_coding | tolerated(0.23) | possibly_damaging(0.463) | TCGA-AA-3833-01 | Colorectum | colon adenocarcinoma | Female | <65 | I/II | Unknown | Unknown | SD | |
| DDI2 | SNV | Missense_Mutation | c.304C>T | p.Pro102Ser | p.P102S | Q5TDH0 | protein_coding | tolerated(0.07) | probably_damaging(1) | TCGA-AA-A022-01 | Colorectum | colon adenocarcinoma | Female | >=65 | I/II | Unknown | Unknown | SD | |
| DDI2 | SNV | Missense_Mutation | rs140092977 | c.323G>A | p.Arg108Gln | p.R108Q | Q5TDH0 | protein_coding | tolerated(0.52) | benign(0.003) | TCGA-AZ-4615-01 | Colorectum | colon adenocarcinoma | Male | >=65 | III/IV | Chemotherapy | xeloda | PD |
| DDI2 | SNV | Missense_Mutation | c.352N>G | p.Ser118Ala | p.S118A | Q5TDH0 | protein_coding | tolerated(0.57) | benign(0.005) | TCGA-A5-A0GP-01 | Endometrium | uterine corpus endometrioid carcinoma | Female | <65 | I/II | Unknown | Unknown | SD | |
| DDI2 | SNV | Missense_Mutation | c.830N>A | p.Arg277Gln | p.R277Q | Q5TDH0 | protein_coding | deleterious(0) | probably_damaging(0.997) | TCGA-A5-A0GW-01 | Endometrium | uterine corpus endometrioid carcinoma | Female | <65 | I/II | Unknown | Unknown | SD | |
| DDI2 | SNV | Missense_Mutation | novel | c.412C>T | p.Leu138Phe | p.L138F | Q5TDH0 | protein_coding | deleterious(0.01) | benign(0.04) | TCGA-AJ-A3EK-01 | Endometrium | uterine corpus endometrioid carcinoma | Female | <65 | I/II | Chemotherapy | carboplatin | CR |
| Page: 1 2 3 4 |
Top |
Related drugs of malignant transformation related genes |
| Identification of chemicals and drugs interact with genes involved in malignant transfromation |
| (DGIdb 4.0) |
| Entrez ID | Symbol | Category | Interaction Types | Drug Claim Name | Drug Name | PMIDs |
| Page: 1 |

Copyright 2023-Present -The University of Texas Health Science Center at Houston |