Schematic overview of the cellular and molecular mechanisms involved in the cancer progression, including the proposed cellular and molecular mechanisms in cancer cells trajectory. AT1: alveolar type 1 cells; AT2: alveolar type 2 cells; AAH: atypical adenomatous hyperplasia; AIS: adenocarcinoma in situ; MIA: minimally invasive adenocarcinoma; IA: invasive adenocarcinoma; EMT: epithelial-mesenchymal transition

Home

Download

Statistics

Help

Contact

Center for Computational Systems Medicine
leaf

Gene summary

leaf

Malignant transformation analysis

leaf

Malignant transformation related pathway analysis

leaf

Cell-cell communication analysis

leaf

Single-cell gene regulatory network inference analysis

leaf

Somatic mutation of malignant transformation related genes

leaf

Related drugs of malignant transformation related genes

Gene: DDHD2

Gene summary for DDHD2

check button Gene summary.

Gene informationSpeciesHuman
Gene symbol

DDHD2

Gene ID

23259

Gene nameDDHD domain containing 2
Gene AliasSAMWD1
Cytomap8p11.23
Gene Typeprotein-coding
GO ID

GO:0000266

UniProtAcc

O94830


Top

Malignant transformation analysis

check button Identification of the aberrant gene expression in precancerous and cancerous lesions by comparing the gene expression of stem-like cells in diseased tissues with normal stem cells
check button Malignant transformation involving gene list.
Entrez IDSymbolReplicatesSpeciesOrganTissueAdj P-valueLog2FCMalignancy
23259DDHD2LZE4THumanEsophagusESCC1.76e-092.45e-010.0811
23259DDHD2LZE24THumanEsophagusESCC2.54e-062.39e-010.0596
23259DDHD2P1T-EHumanEsophagusESCC8.78e-061.32e-010.0875
23259DDHD2P2T-EHumanEsophagusESCC9.08e-222.88e-010.1177
23259DDHD2P4T-EHumanEsophagusESCC1.38e-123.02e-010.1323
23259DDHD2P8T-EHumanEsophagusESCC2.55e-111.56e-010.0889
23259DDHD2P9T-EHumanEsophagusESCC8.56e-096.52e-020.1131
23259DDHD2P10T-EHumanEsophagusESCC1.07e-253.91e-010.116
23259DDHD2P11T-EHumanEsophagusESCC1.32e-031.32e-010.1426
23259DDHD2P12T-EHumanEsophagusESCC2.06e-143.33e-010.1122
23259DDHD2P15T-EHumanEsophagusESCC1.11e-296.99e-010.1149
23259DDHD2P16T-EHumanEsophagusESCC6.79e-131.12e-010.1153
23259DDHD2P17T-EHumanEsophagusESCC6.14e-031.63e-010.1278
23259DDHD2P19T-EHumanEsophagusESCC5.33e-044.81e-010.1662
23259DDHD2P20T-EHumanEsophagusESCC3.19e-172.17e-010.1124
23259DDHD2P21T-EHumanEsophagusESCC8.92e-172.46e-010.1617
23259DDHD2P22T-EHumanEsophagusESCC7.04e-151.62e-010.1236
23259DDHD2P23T-EHumanEsophagusESCC1.30e-132.40e-010.108
23259DDHD2P24T-EHumanEsophagusESCC3.97e-121.08e-010.1287
23259DDHD2P26T-EHumanEsophagusESCC6.35e-141.64e-010.1276
Page: 1 2 3 4 

check button Transcriptomic changes along malignancy continuum.
TissueExpression DynamicsAbbreviation
EsophagusThe image shows the transcriptomic changes along malignancy continuum.log2FC in expression of this searched gene in stem-like cells from each diseased tissue sample relative to stem-like cells in normal samples in each tissue plotted against the malignancy continuum. Samples are colored based on if they are from different disease stage.ESCC: Esophageal squamous cell carcinoma
HGIN: High-grade intraepithelial neoplasias
LGIN: Low-grade intraepithelial neoplasias
Oral CavityThe image shows the transcriptomic changes along malignancy continuum.log2FC in expression of this searched gene in stem-like cells from each diseased tissue sample relative to stem-like cells in normal samples in each tissue plotted against the malignancy continuum. Samples are colored based on if they are from different disease stage.
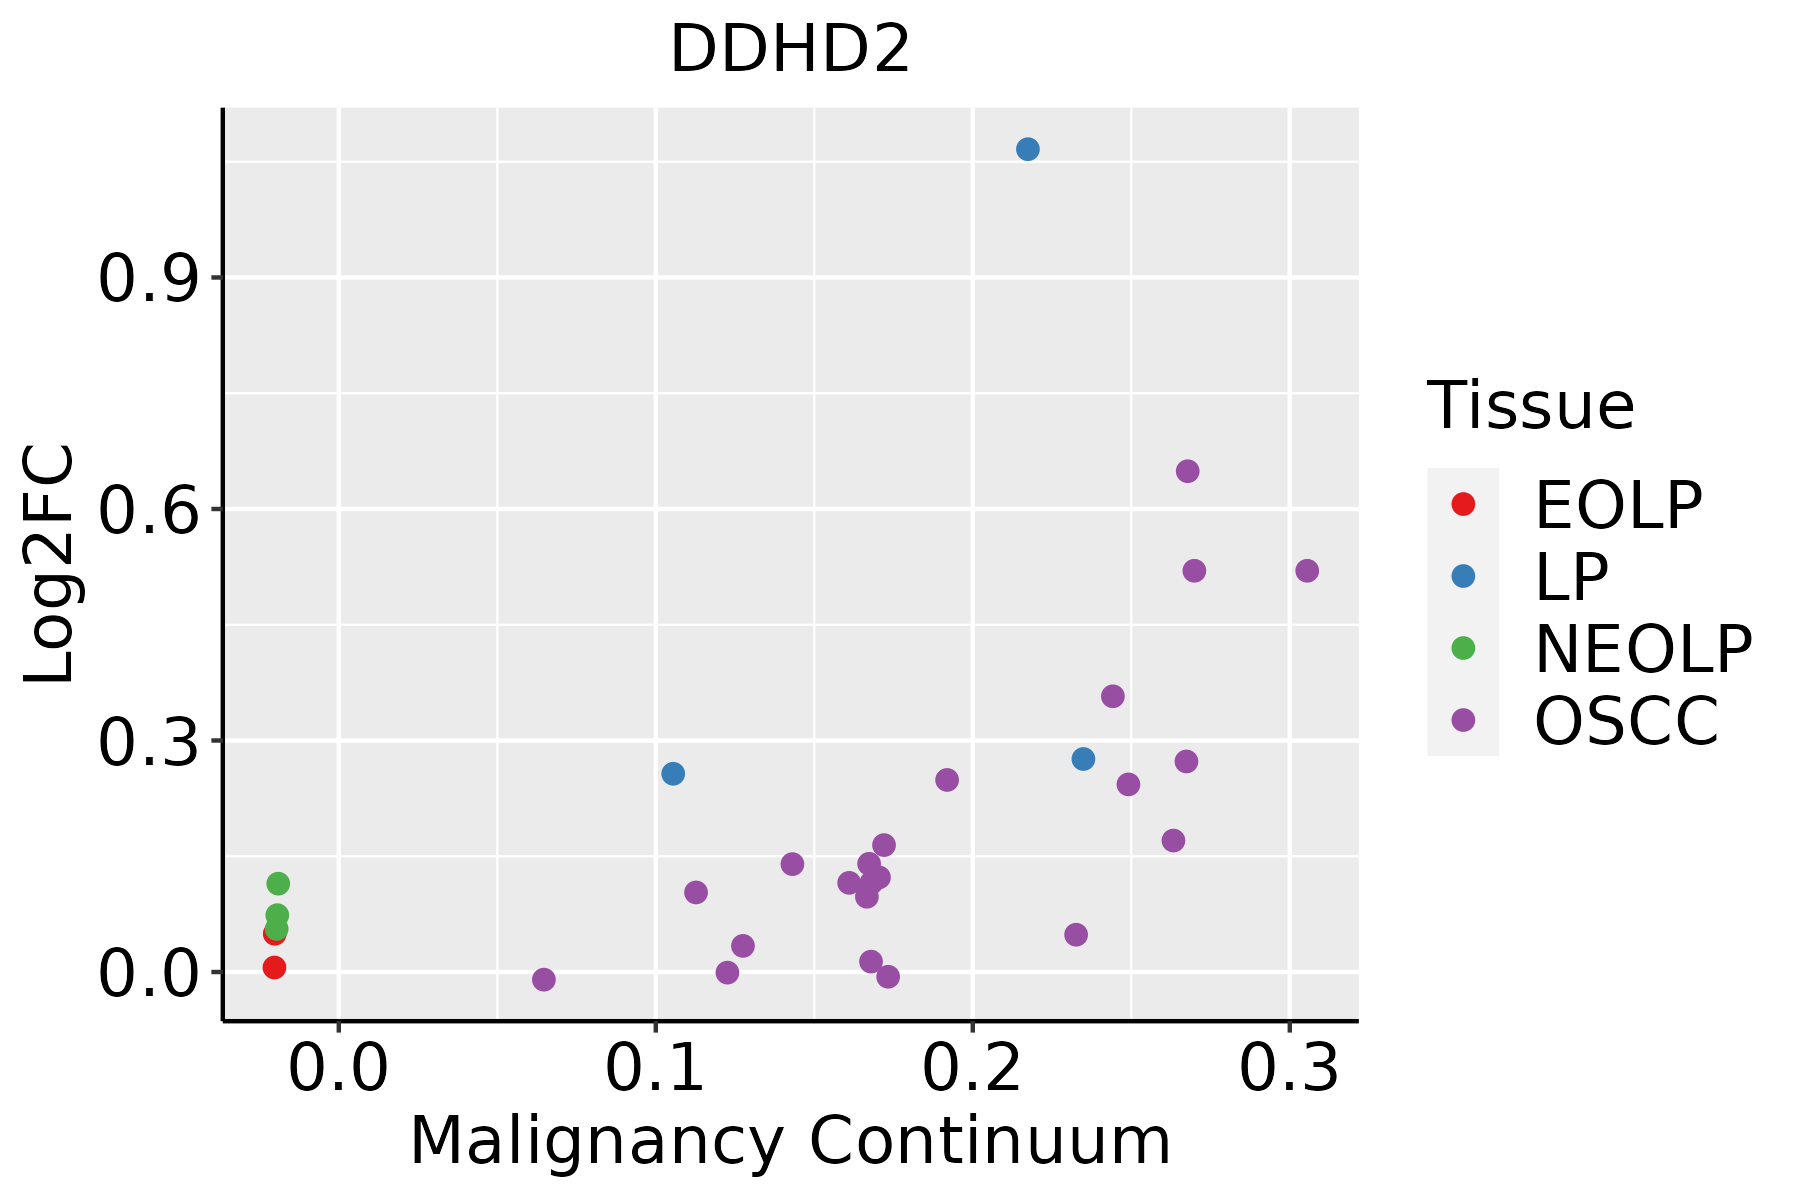
EOLP: Erosive Oral lichen planus
LP: leukoplakia
NEOLP: Non-erosive oral lichen planus
OSCC: Oral squamous cell carcinoma
ThyroidThe image shows the transcriptomic changes along malignancy continuum.log2FC in expression of this searched gene in stem-like cells from each diseased tissue sample relative to stem-like cells in normal samples in each tissue plotted against the malignancy continuum. Samples are colored based on if they are from different disease stage.ATC: Anaplastic thyroid cancer
HT: Hashimoto's thyroiditis
PTC: Papillary thyroid cancer
∗log2FC in expression of this searched gene in stem-like cells from each diseased tissue sample relative to stem-like cells in normal samples in each tissue plotted against the malignancy continuum. Samples are colored based on if they are from different disease stage.

Top

Malignant transformation related pathway analysis

check buttonFind out the enriched GO biological processes and KEGG pathways involved in transition from healthy to precancer to cancer
check button Figure of enriched GO biological processes.
TissueDisease StageEnriched GO biological Processes
ColorectumADGO analysis - Figure of enriched GO biological processes: Top 15 enriched GO BP terms are showed in the bar plot of each disease state in each tissue. Each row represents a significant GO biological process which is colored according to the -log10(p.adjust).
ColorectumSERGO analysis - Figure of enriched GO biological processes: Top 15 enriched GO BP terms are showed in the bar plot of each disease state in each tissue. Each row represents a significant GO biological process which is colored according to the -log10(p.adjust).
ColorectumMSSGO analysis - Figure of enriched GO biological processes: Top 15 enriched GO BP terms are showed in the bar plot of each disease state in each tissue. Each row represents a significant GO biological process which is colored according to the -log10(p.adjust).
ColorectumMSI-HGO analysis - Figure of enriched GO biological processes: Top 15 enriched GO BP terms are showed in the bar plot of each disease state in each tissue. Each row represents a significant GO biological process which is colored according to the -log10(p.adjust).
ColorectumFAPGO analysis - Figure of enriched GO biological processes: Top 15 enriched GO BP terms are showed in the bar plot of each disease state in each tissue. Each row represents a significant GO biological process which is colored according to the -log10(p.adjust).
∗Top 15 enriched GO BP terms are showed in the bar plot of each disease state in each tissue. Each row represents a significant GO biological process which is colored according to the -log10(p.adjust).
Page: 1 2 3 4 5 6 7 8 9 

check button Enriched GO biological processes.
GO IDTissueDisease StageDescriptionGene RatioBg Ratiopvaluep.adjustCount
GO:00482853EsophagusESCCorganelle fission301/8552488/187234.64e-132.12e-11301
GO:0010821110EsophagusESCCregulation of mitochondrion organization107/8552144/187232.31e-129.41e-11107
GO:000931419EsophagusESCCresponse to radiation277/8552456/187234.42e-111.43e-09277
GO:001082215EsophagusESCCpositive regulation of mitochondrion organization58/855274/187238.55e-091.73e-0758
GO:000941611EsophagusESCCresponse to light stimulus183/8552320/187232.03e-051.76e-04183
GO:00464864EsophagusESCCglycerolipid metabolic process211/8552392/187236.51e-043.46e-03211
GO:00442427EsophagusESCCcellular lipid catabolic process121/8552214/187238.63e-044.43e-03121
GO:00901411EsophagusESCCpositive regulation of mitochondrial fission16/855221/187234.47e-031.76e-0216
GO:00002662EsophagusESCCmitochondrial fission28/855242/187234.90e-031.89e-0228
GO:00160427EsophagusESCClipid catabolic process168/8552320/187237.97e-032.84e-02168
GO:00482852Oral cavityOSCCorganelle fission265/7305488/187233.22e-121.27e-10265
GO:001082117Oral cavityOSCCregulation of mitochondrion organization97/7305144/187234.78e-121.83e-1097
GO:000931416Oral cavityOSCCresponse to radiation241/7305456/187239.76e-102.40e-08241
GO:00108227Oral cavityOSCCpositive regulation of mitochondrion organization53/730574/187231.26e-082.55e-0753
GO:00094164Oral cavityOSCCresponse to light stimulus159/7305320/187235.98e-054.92e-04159
GO:00442426Oral cavityOSCCcellular lipid catabolic process104/7305214/187232.61e-031.15e-02104
GO:0090141Oral cavityOSCCpositive regulation of mitochondrial fission15/730521/187232.65e-031.16e-0215
GO:00002661Oral cavityOSCCmitochondrial fission24/730542/187231.30e-024.34e-0224
GO:001082118Oral cavityLPregulation of mitochondrion organization65/4623144/187236.61e-082.24e-0665
GO:000931417Oral cavityLPresponse to radiation155/4623456/187234.12e-068.49e-05155
Page: 1 2 

check button Enriched KEGG pathways.
Pathway IDTissueDisease StageDescriptionGene RatioBg Ratiopvaluep.adjustqvalueCount
Page: 1 

Top

Cell-cell communication analysis

check buttonIdentification of potential cell-cell interactions between two cell types and their ligand-receptor pairs for different disease states
LigandReceptorLRpairPathwayTissueDisease Stage
Page: 1 

Top

Single-cell gene regulatory network inference analysis

check buttonFind out the significant the regulons (TFs) and the target genes of each regulon across cell types for different disease states
TFCell TypeTissueDisease StageTarget GeneRSSRegulon Activity
∗The dot plots of a searched regulon are shown for all cell subpopulations in each disease state of each tissue based on the regulon specific score inferred using pySCENIC and by calculating the average expression.
Page: 1 

Top

Somatic mutation of malignant transformation related genes

check buttonAnnotation of somatic variants for genes involved in malignant transformation
Hugo SymbolVariant ClassVariant ClassificationdbSNP RSHGVScHGVSpHGVSp ShortSWISSPROTBIOTYPESIFTPolyPhenTumor Sample BarcodeTissueHistologySexAgeStageTherapy TypesDrugsOutcome
DDHD2SNVMissense_Mutationc.1150N>Gp.Gln384Glup.Q384EO94830protein_codingtolerated(0.89)benign(0.001)TCGA-A2-A0YK-01Breastbreast invasive carcinomaFemale<65I/IIChemotherapycytoxanSD
DDHD2SNVMissense_Mutationc.2132A>Gp.Gln711Argp.Q711RO94830protein_codingdeleterious_low_confidence(0.02)possibly_damaging(0.549)TCGA-A8-A093-01Breastbreast invasive carcinomaFemale<65I/IIHormone TherapytamoxiphenSD
DDHD2SNVMissense_Mutationnovelc.1922N>Cp.Val641Alap.V641AO94830protein_codingtolerated(0.85)benign(0.009)TCGA-AN-A046-01Breastbreast invasive carcinomaFemale>=65I/IIUnknownUnknownSD
DDHD2SNVMissense_Mutationrs776283403c.2068N>Gp.Thr690Alap.T690AO94830protein_codingdeleterious(0.02)possibly_damaging(0.576)TCGA-D8-A1XK-01Breastbreast invasive carcinomaFemale<65I/IIChemotherapydoxorubicine+cyclophosphamideSD
DDHD2SNVMissense_Mutationnovelc.1929N>Cp.Glu643Aspp.E643DO94830protein_codingtolerated(0.43)benign(0.012)TCGA-E9-A3Q9-01Breastbreast invasive carcinomaFemale>=65III/IVChemotherapycyclophosphaneCR
DDHD2insertionFrame_Shift_Insnovelc.866_867insCCTGCCCAGCATTAACCGCCACCCTTCCAACCCCTTCCAAATTTp.Leu296HisfsTer47p.L296Hfs*47O94830protein_codingTCGA-AO-A128-01Breastbreast invasive carcinomaFemale<65I/IIChemotherapydoxorubicinSD
DDHD2SNVMissense_Mutationc.1927N>Cp.Glu643Glnp.E643QO94830protein_codingtolerated(0.17)benign(0.141)TCGA-EA-A5ZF-01Cervixcervical & endocervical cancerFemale<65I/IIUnknownUnknownPD
DDHD2SNVMissense_Mutationc.191C>Tp.Ser64Leup.S64LO94830protein_codingdeleterious(0)probably_damaging(0.998)TCGA-EK-A2R7-01Cervixcervical & endocervical cancerFemale<65I/IIUnknownUnknownSD
DDHD2insertionFrame_Shift_Insnovelc.362_363insCTCTCCCp.Lys121AsnfsTer6p.K121Nfs*6O94830protein_codingTCGA-DS-A1OA-01Cervixcervical & endocervical cancerFemale>=65I/IIChemotherapycarboplatinPD
DDHD2SNVMissense_Mutationrs763476356c.1973G>Ap.Arg658Hisp.R658HO94830protein_codingdeleterious(0)probably_damaging(1)TCGA-A6-6781-01Colorectumcolon adenocarcinomaMale<65III/IVChemotherapyoxaliplatinSD
Page: 1 2 3 4 5 6 7 8 

Top

Related drugs of malignant transformation related genes

check buttonIdentification of chemicals and drugs interact with genes involved in malignant transfromation
(DGIdb 4.0)
Entrez IDSymbolCategoryInteraction TypesDrug Claim NameDrug NamePMIDs
Page: 1