
|
|||||
|
 | |
| |
| |
| |
| |
| |
|
Gene: DDC |
Gene summary for DDC |
| Gene information | Species | Human | Gene symbol | DDC | Gene ID | 1644 |
| Gene name | dopa decarboxylase | |
| Gene Alias | AADC | |
| Cytomap | 7p12.2-p12.1 | |
| Gene Type | protein-coding | GO ID | GO:0006082 | UniProtAcc | P20711 |
Top |
Malignant transformation analysis |
| Identification of the aberrant gene expression in precancerous and cancerous lesions by comparing the gene expression of stem-like cells in diseased tissues with normal stem cells |
| Entrez ID | Symbol | Replicates | Species | Organ | Tissue | Adj P-value | Log2FC | Malignancy |
| 1644 | DDC | HTA11_3410_2000001011 | Human | Colorectum | AD | 5.21e-06 | 2.30e-01 | 0.0155 |
| 1644 | DDC | HTA11_2487_2000001011 | Human | Colorectum | SER | 3.96e-05 | 3.11e-01 | -0.1808 |
| 1644 | DDC | HTA11_1938_2000001011 | Human | Colorectum | AD | 6.89e-05 | 4.95e-01 | -0.0811 |
| 1644 | DDC | HTA11_78_2000001011 | Human | Colorectum | AD | 6.63e-12 | 6.23e-01 | -0.1088 |
| 1644 | DDC | HTA11_347_2000001011 | Human | Colorectum | AD | 1.15e-25 | 7.03e-01 | -0.1954 |
| 1644 | DDC | HTA11_83_2000001011 | Human | Colorectum | SER | 5.23e-09 | 6.00e-01 | -0.1526 |
| 1644 | DDC | HTA11_696_2000001011 | Human | Colorectum | AD | 5.84e-06 | 2.50e-01 | -0.1464 |
| 1644 | DDC | HTA11_1391_2000001011 | Human | Colorectum | AD | 5.70e-12 | 6.52e-01 | -0.059 |
| 1644 | DDC | HTA11_5216_2000001011 | Human | Colorectum | SER | 6.44e-04 | 5.09e-01 | -0.1462 |
| 1644 | DDC | HTA11_7862_2000001011 | Human | Colorectum | AD | 1.28e-12 | 7.43e-01 | -0.0179 |
| 1644 | DDC | HTA11_866_3004761011 | Human | Colorectum | AD | 6.53e-07 | 3.87e-01 | 0.096 |
| 1644 | DDC | HTA11_4255_2000001011 | Human | Colorectum | SER | 2.84e-02 | 5.31e-01 | 0.0446 |
| 1644 | DDC | HTA11_8622_2000001021 | Human | Colorectum | SER | 1.07e-03 | 4.33e-01 | 0.0528 |
| 1644 | DDC | HTA11_10623_2000001011 | Human | Colorectum | AD | 2.42e-02 | 4.71e-01 | -0.0177 |
| 1644 | DDC | HTA11_6801_2000001011 | Human | Colorectum | SER | 3.61e-06 | 6.83e-01 | 0.0171 |
| 1644 | DDC | HTA11_7696_3000711011 | Human | Colorectum | AD | 1.36e-11 | 4.27e-01 | 0.0674 |
| 1644 | DDC | HTA11_6818_2000001021 | Human | Colorectum | AD | 3.08e-02 | 2.23e-01 | 0.0588 |
| 1644 | DDC | HTA11_99999970781_79442 | Human | Colorectum | MSS | 3.57e-04 | 2.34e-01 | 0.294 |
| 1644 | DDC | HTA11_99999965104_69814 | Human | Colorectum | MSS | 8.92e-10 | 5.95e-01 | 0.281 |
| 1644 | DDC | HTA11_99999971662_82457 | Human | Colorectum | MSS | 1.96e-12 | 5.04e-01 | 0.3859 |
| Page: 1 2 |
| Tissue | Expression Dynamics | Abbreviation |
| Colorectum (GSE201348) |  | FAP: Familial adenomatous polyposis |
| CRC: Colorectal cancer | ||
| Colorectum (HTA11) | 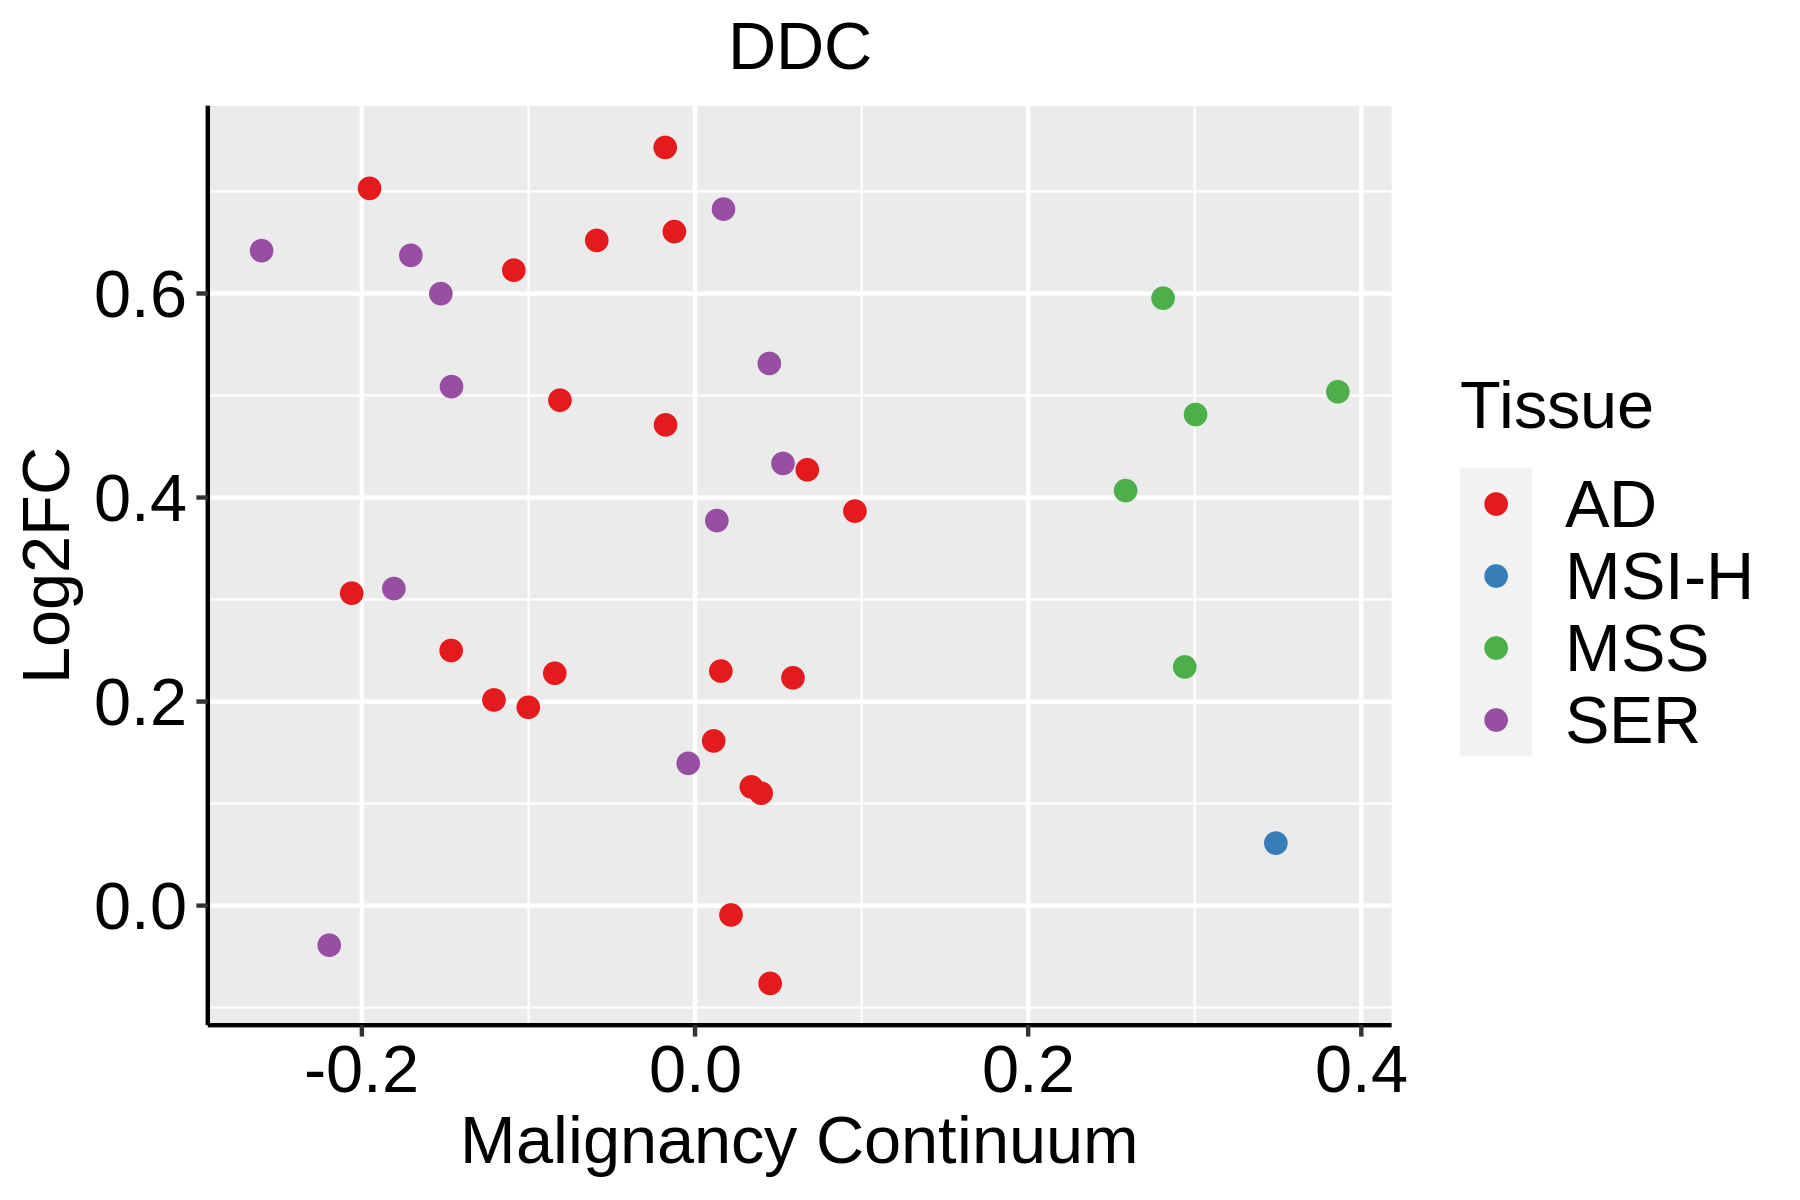 | AD: Adenomas |
| SER: Sessile serrated lesions | ||
| MSI-H: Microsatellite-high colorectal cancer | ||
| MSS: Microsatellite stable colorectal cancer | ||
| Liver | 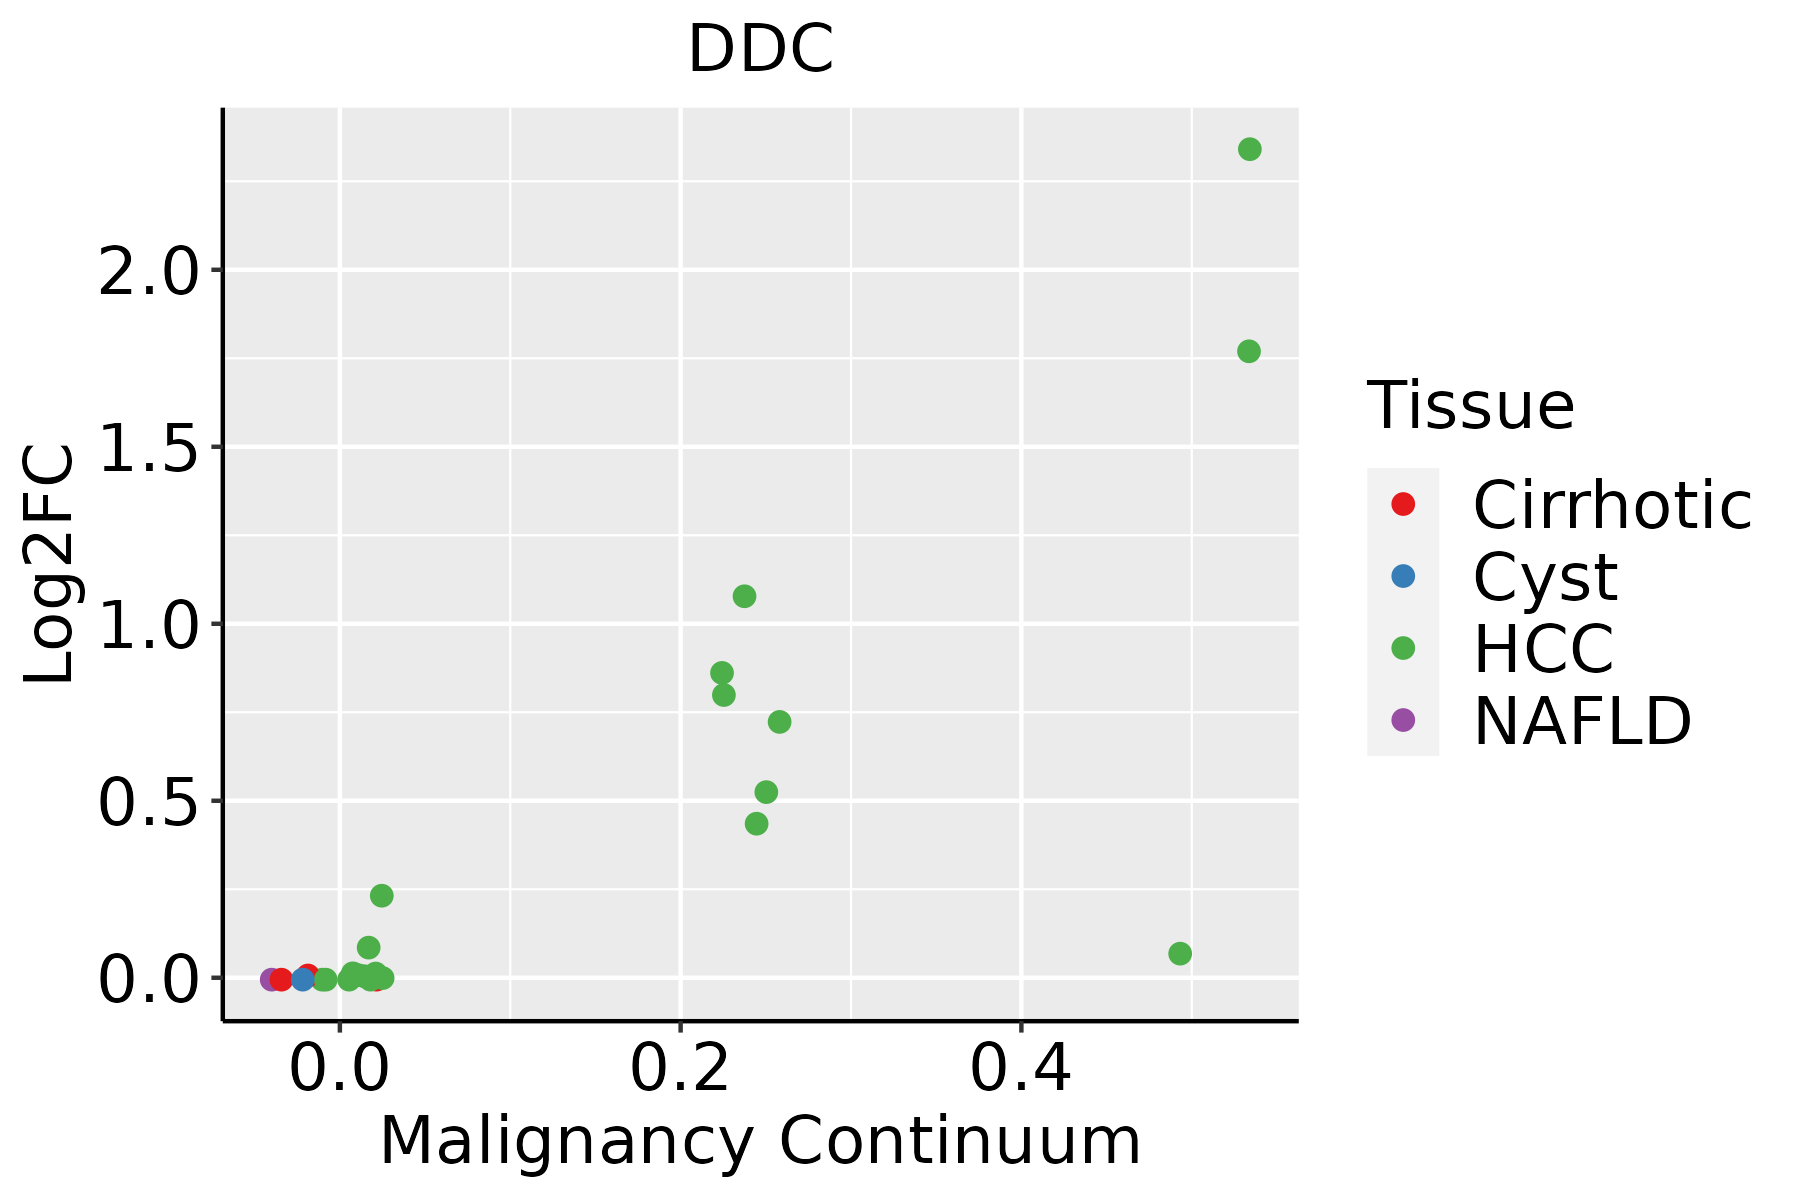 | HCC: Hepatocellular carcinoma |
| NAFLD: Non-alcoholic fatty liver disease |
| ∗log2FC in expression of this searched gene in stem-like cells from each diseased tissue sample relative to stem-like cells in normal samples in each tissue plotted against the malignancy continuum. Samples are colored based on if they are from different disease stage. |
Top |
Malignant transformation related pathway analysis |
| Find out the enriched GO biological processes and KEGG pathways involved in transition from healthy to precancer to cancer |
| Tissue | Disease Stage | Enriched GO biological Processes |
| Colorectum | AD |  |
| Colorectum | SER |  |
| Colorectum | MSS |  |
| Colorectum | MSI-H |  |
| Colorectum | FAP |  |
| ∗Top 15 enriched GO BP terms are showed in the bar plot of each disease state in each tissue. Each row represents a significant GO biological process which is colored according to the -log10(p.adjust). |
| Page: 1 2 3 4 5 6 7 8 9 |
| GO ID | Tissue | Disease Stage | Description | Gene Ratio | Bg Ratio | pvalue | p.adjust | Count |
| GO:0009636 | Colorectum | AD | response to toxic substance | 88/3918 | 262/18723 | 1.12e-06 | 3.72e-05 | 88 |
| GO:0007623 | Colorectum | AD | circadian rhythm | 72/3918 | 210/18723 | 4.50e-06 | 1.21e-04 | 72 |
| GO:0048511 | Colorectum | AD | rhythmic process | 94/3918 | 298/18723 | 1.00e-05 | 2.34e-04 | 94 |
| GO:0016311 | Colorectum | AD | dephosphorylation | 123/3918 | 417/18723 | 1.84e-05 | 3.82e-04 | 123 |
| GO:0009410 | Colorectum | AD | response to xenobiotic stimulus | 128/3918 | 462/18723 | 2.69e-04 | 3.31e-03 | 128 |
| GO:0007568 | Colorectum | AD | aging | 98/3918 | 339/18723 | 2.77e-04 | 3.39e-03 | 98 |
| GO:0006520 | Colorectum | AD | cellular amino acid metabolic process | 81/3918 | 284/18723 | 1.37e-03 | 1.19e-02 | 81 |
| GO:0099003 | Colorectum | AD | vesicle-mediated transport in synapse | 57/3918 | 200/18723 | 6.53e-03 | 4.06e-02 | 57 |
| GO:00096361 | Colorectum | SER | response to toxic substance | 71/2897 | 262/18723 | 8.63e-07 | 4.07e-05 | 71 |
| GO:00076231 | Colorectum | SER | circadian rhythm | 54/2897 | 210/18723 | 7.98e-05 | 1.77e-03 | 54 |
| GO:00485111 | Colorectum | SER | rhythmic process | 65/2897 | 298/18723 | 2.18e-03 | 2.11e-02 | 65 |
| GO:00065201 | Colorectum | SER | cellular amino acid metabolic process | 61/2897 | 284/18723 | 4.20e-03 | 3.41e-02 | 61 |
| GO:00076232 | Colorectum | MSS | circadian rhythm | 69/3467 | 210/18723 | 4.22e-07 | 1.67e-05 | 69 |
| GO:00485112 | Colorectum | MSS | rhythmic process | 89/3467 | 298/18723 | 1.17e-06 | 3.96e-05 | 89 |
| GO:00096362 | Colorectum | MSS | response to toxic substance | 73/3467 | 262/18723 | 1.26e-04 | 1.94e-03 | 73 |
| GO:00075681 | Colorectum | MSS | aging | 90/3467 | 339/18723 | 1.51e-04 | 2.19e-03 | 90 |
| GO:00990031 | Colorectum | MSS | vesicle-mediated transport in synapse | 54/3467 | 200/18723 | 1.94e-03 | 1.67e-02 | 54 |
| GO:00094101 | Colorectum | MSS | response to xenobiotic stimulus | 110/3467 | 462/18723 | 2.36e-03 | 1.92e-02 | 110 |
| GO:0099504 | Colorectum | MSS | synaptic vesicle cycle | 48/3467 | 181/18723 | 4.85e-03 | 3.39e-02 | 48 |
| GO:001631110 | Esophagus | ESCC | dephosphorylation | 251/8552 | 417/18723 | 1.26e-09 | 2.99e-08 | 251 |
| Page: 1 2 |
| Pathway ID | Tissue | Disease Stage | Description | Gene Ratio | Bg Ratio | pvalue | p.adjust | qvalue | Count |
| hsa04728 | Colorectum | AD | Dopaminergic synapse | 46/2092 | 132/8465 | 5.55e-03 | 2.48e-02 | 1.58e-02 | 46 |
| hsa047281 | Colorectum | AD | Dopaminergic synapse | 46/2092 | 132/8465 | 5.55e-03 | 2.48e-02 | 1.58e-02 | 46 |
| hsa047282 | Colorectum | SER | Dopaminergic synapse | 37/1580 | 132/8465 | 5.27e-03 | 3.28e-02 | 2.38e-02 | 37 |
| hsa047283 | Colorectum | SER | Dopaminergic synapse | 37/1580 | 132/8465 | 5.27e-03 | 3.28e-02 | 2.38e-02 | 37 |
| hsa047284 | Colorectum | MSS | Dopaminergic synapse | 45/1875 | 132/8465 | 1.02e-03 | 5.94e-03 | 3.64e-03 | 45 |
| hsa047285 | Colorectum | MSS | Dopaminergic synapse | 45/1875 | 132/8465 | 1.02e-03 | 5.94e-03 | 3.64e-03 | 45 |
| Page: 1 |
Top |
Cell-cell communication analysis |
| Identification of potential cell-cell interactions between two cell types and their ligand-receptor pairs for different disease states |
| Ligand | Receptor | LRpair | Pathway | Tissue | Disease Stage |
| Page: 1 |
Top |
Single-cell gene regulatory network inference analysis |
| Find out the significant the regulons (TFs) and the target genes of each regulon across cell types for different disease states |
| TF | Cell Type | Tissue | Disease Stage | Target Gene | RSS | Regulon Activity |
| ∗The dot plots of a searched regulon are shown for all cell subpopulations in each disease state of each tissue based on the regulon specific score inferred using pySCENIC and by calculating the average expression. |
| Page: 1 |
Top |
Somatic mutation of malignant transformation related genes |
| Annotation of somatic variants for genes involved in malignant transformation |
| Hugo Symbol | Variant Class | Variant Classification | dbSNP RS | HGVSc | HGVSp | HGVSp Short | SWISSPROT | BIOTYPE | SIFT | PolyPhen | Tumor Sample Barcode | Tissue | Histology | Sex | Age | Stage | Therapy Types | Drugs | Outcome |
| DDC | SNV | Missense_Mutation | c.427G>A | p.Val143Met | p.V143M | P20711 | protein_coding | deleterious(0) | probably_damaging(0.996) | TCGA-A2-A0EW-01 | Breast | breast invasive carcinoma | Female | <65 | III/IV | Chemotherapy | adriamycin | PD | |
| DDC | SNV | Missense_Mutation | rs777956037 | c.206N>T | p.Thr69Met | p.T69M | P20711 | protein_coding | deleterious(0.01) | probably_damaging(0.999) | TCGA-E9-A2JS-01 | Breast | breast invasive carcinoma | Female | >=65 | I/II | Chemotherapy | cyclophosphamide | PD |
| DDC | insertion | Frame_Shift_Ins | novel | c.1168_1169insTCCTCAAGGCTCCATCCCACACCTCTGC | p.Ser390PhefsTer19 | p.S390Ffs*19 | P20711 | protein_coding | TCGA-B6-A0I5-01 | Breast | breast invasive carcinoma | Female | <65 | I/II | Unknown | Unknown | SD | ||
| DDC | deletion | Frame_Shift_Del | c.222delN | p.Tyr75ThrfsTer43 | p.Y75Tfs*43 | P20711 | protein_coding | TCGA-D8-A27V-01 | Breast | breast invasive carcinoma | Female | <65 | I/II | Hormone Therapy | tamoxiphen | SD | |||
| DDC | SNV | Missense_Mutation | rs771317809 | c.1073G>A | p.Arg358His | p.R358H | P20711 | protein_coding | deleterious(0) | probably_damaging(0.999) | TCGA-2W-A8YY-01 | Cervix | cervical & endocervical cancer | Female | <65 | I/II | Chemotherapy | cisplatin | CR |
| DDC | SNV | Missense_Mutation | c.427G>A | p.Val143Met | p.V143M | P20711 | protein_coding | deleterious(0) | probably_damaging(0.996) | TCGA-2W-A8YY-01 | Cervix | cervical & endocervical cancer | Female | <65 | I/II | Chemotherapy | cisplatin | CR | |
| DDC | SNV | Missense_Mutation | c.560N>T | p.Ser187Leu | p.S187L | P20711 | protein_coding | deleterious(0.01) | possibly_damaging(0.494) | TCGA-C5-A2LX-01 | Cervix | cervical & endocervical cancer | Female | <65 | I/II | Chemotherapy | cisplatin | SD | |
| DDC | SNV | Missense_Mutation | rs777956037 | c.206N>T | p.Thr69Met | p.T69M | P20711 | protein_coding | deleterious(0.01) | probably_damaging(0.999) | TCGA-AA-3679-01 | Colorectum | colon adenocarcinoma | Male | <65 | III/IV | Chemotherapy | folinic | SD |
| DDC | SNV | Missense_Mutation | novel | c.1109G>A | p.Gly370Glu | p.G370E | P20711 | protein_coding | deleterious(0) | probably_damaging(1) | TCGA-CA-6717-01 | Colorectum | colon adenocarcinoma | Male | <65 | I/II | Chemotherapy | oxaliplatin | CR |
| DDC | SNV | Missense_Mutation | c.956N>T | p.Arg319Ile | p.R319I | P20711 | protein_coding | tolerated(0.07) | possibly_damaging(0.642) | TCGA-CA-6718-01 | Colorectum | colon adenocarcinoma | Male | <65 | I/II | Unknown | Unknown | PD |
| Page: 1 2 3 4 5 6 7 |
Top |
Related drugs of malignant transformation related genes |
| Identification of chemicals and drugs interact with genes involved in malignant transfromation |
| (DGIdb 4.0) |
| Entrez ID | Symbol | Category | Interaction Types | Drug Claim Name | Drug Name | PMIDs |
| 1644 | DDC | ENZYME, DRUGGABLE GENOME | Benserazide | BENSERAZIDE | ||
| 1644 | DDC | ENZYME, DRUGGABLE GENOME | carbidopa | CARBIDOPA | ||
| 1644 | DDC | ENZYME, DRUGGABLE GENOME | inhibitor | 178101809 | ||
| 1644 | DDC | ENZYME, DRUGGABLE GENOME | CARBIDOPA | CARBIDOPA | ||
| 1644 | DDC | ENZYME, DRUGGABLE GENOME | Patrome | |||
| 1644 | DDC | ENZYME, DRUGGABLE GENOME | inhibitor | 178101902 | ||
| 1644 | DDC | ENZYME, DRUGGABLE GENOME | Carbidopa | CARBIDOPA | ||
| 1644 | DDC | ENZYME, DRUGGABLE GENOME | RAPAMYCIN | SIROLIMUS | 16126007 | |
| 1644 | DDC | ENZYME, DRUGGABLE GENOME | Vitamin B6 | |||
| 1644 | DDC | ENZYME, DRUGGABLE GENOME | ProSavin |
| Page: 1 2 |

Copyright 2023-Present -The University of Texas Health Science Center at Houston |