
|
|||||
|
 | |
| |
| |
| |
| |
| |
|
Gene: DDB2 |
Gene summary for DDB2 |
| Gene information | Species | Human | Gene symbol | DDB2 | Gene ID | 1643 |
| Gene name | damage specific DNA binding protein 2 | |
| Gene Alias | DDBB | |
| Cytomap | 11p11.2 | |
| Gene Type | protein-coding | GO ID | GO:0000209 | UniProtAcc | Q92466 |
Top |
Malignant transformation analysis |
| Identification of the aberrant gene expression in precancerous and cancerous lesions by comparing the gene expression of stem-like cells in diseased tissues with normal stem cells |
| Entrez ID | Symbol | Replicates | Species | Organ | Tissue | Adj P-value | Log2FC | Malignancy |
| 1643 | DDB2 | HTA11_1938_2000001011 | Human | Colorectum | AD | 4.33e-09 | 6.62e-01 | -0.0811 |
| 1643 | DDB2 | HTA11_78_2000001011 | Human | Colorectum | AD | 1.20e-02 | 3.49e-01 | -0.1088 |
| 1643 | DDB2 | HTA11_1391_2000001011 | Human | Colorectum | AD | 1.25e-08 | 6.56e-01 | -0.059 |
| 1643 | DDB2 | HTA11_866_3004761011 | Human | Colorectum | AD | 5.25e-03 | 2.69e-01 | 0.096 |
| 1643 | DDB2 | HTA11_6818_2000001021 | Human | Colorectum | AD | 2.11e-02 | 3.73e-01 | 0.0588 |
| 1643 | DDB2 | HTA11_99999974143_84620 | Human | Colorectum | MSS | 2.67e-02 | 3.30e-01 | 0.3005 |
| 1643 | DDB2 | A015-C-203 | Human | Colorectum | FAP | 2.79e-03 | -6.81e-02 | -0.1294 |
| 1643 | DDB2 | A015-C-104 | Human | Colorectum | FAP | 1.10e-02 | -8.53e-02 | -0.1899 |
| 1643 | DDB2 | LZE4T | Human | Esophagus | ESCC | 5.16e-07 | 2.00e-01 | 0.0811 |
| 1643 | DDB2 | LZE8T | Human | Esophagus | ESCC | 8.97e-03 | 1.66e-01 | 0.067 |
| 1643 | DDB2 | LZE20T | Human | Esophagus | ESCC | 2.76e-06 | 1.41e-01 | 0.0662 |
| 1643 | DDB2 | LZE22D1 | Human | Esophagus | HGIN | 6.66e-03 | 1.20e-01 | 0.0595 |
| 1643 | DDB2 | LZE24T | Human | Esophagus | ESCC | 5.52e-07 | 4.58e-01 | 0.0596 |
| 1643 | DDB2 | P1T-E | Human | Esophagus | ESCC | 4.46e-06 | 3.69e-01 | 0.0875 |
| 1643 | DDB2 | P2T-E | Human | Esophagus | ESCC | 2.18e-30 | 6.08e-01 | 0.1177 |
| 1643 | DDB2 | P4T-E | Human | Esophagus | ESCC | 5.57e-16 | 2.38e-01 | 0.1323 |
| 1643 | DDB2 | P5T-E | Human | Esophagus | ESCC | 1.02e-09 | 6.88e-02 | 0.1327 |
| 1643 | DDB2 | P8T-E | Human | Esophagus | ESCC | 2.15e-09 | 2.50e-01 | 0.0889 |
| 1643 | DDB2 | P9T-E | Human | Esophagus | ESCC | 1.02e-09 | 1.67e-01 | 0.1131 |
| 1643 | DDB2 | P10T-E | Human | Esophagus | ESCC | 3.66e-19 | 3.41e-01 | 0.116 |
| Page: 1 2 3 4 5 6 |
| Tissue | Expression Dynamics | Abbreviation |
| Colorectum (GSE201348) |  | FAP: Familial adenomatous polyposis |
| CRC: Colorectal cancer | ||
| Colorectum (HTA11) | 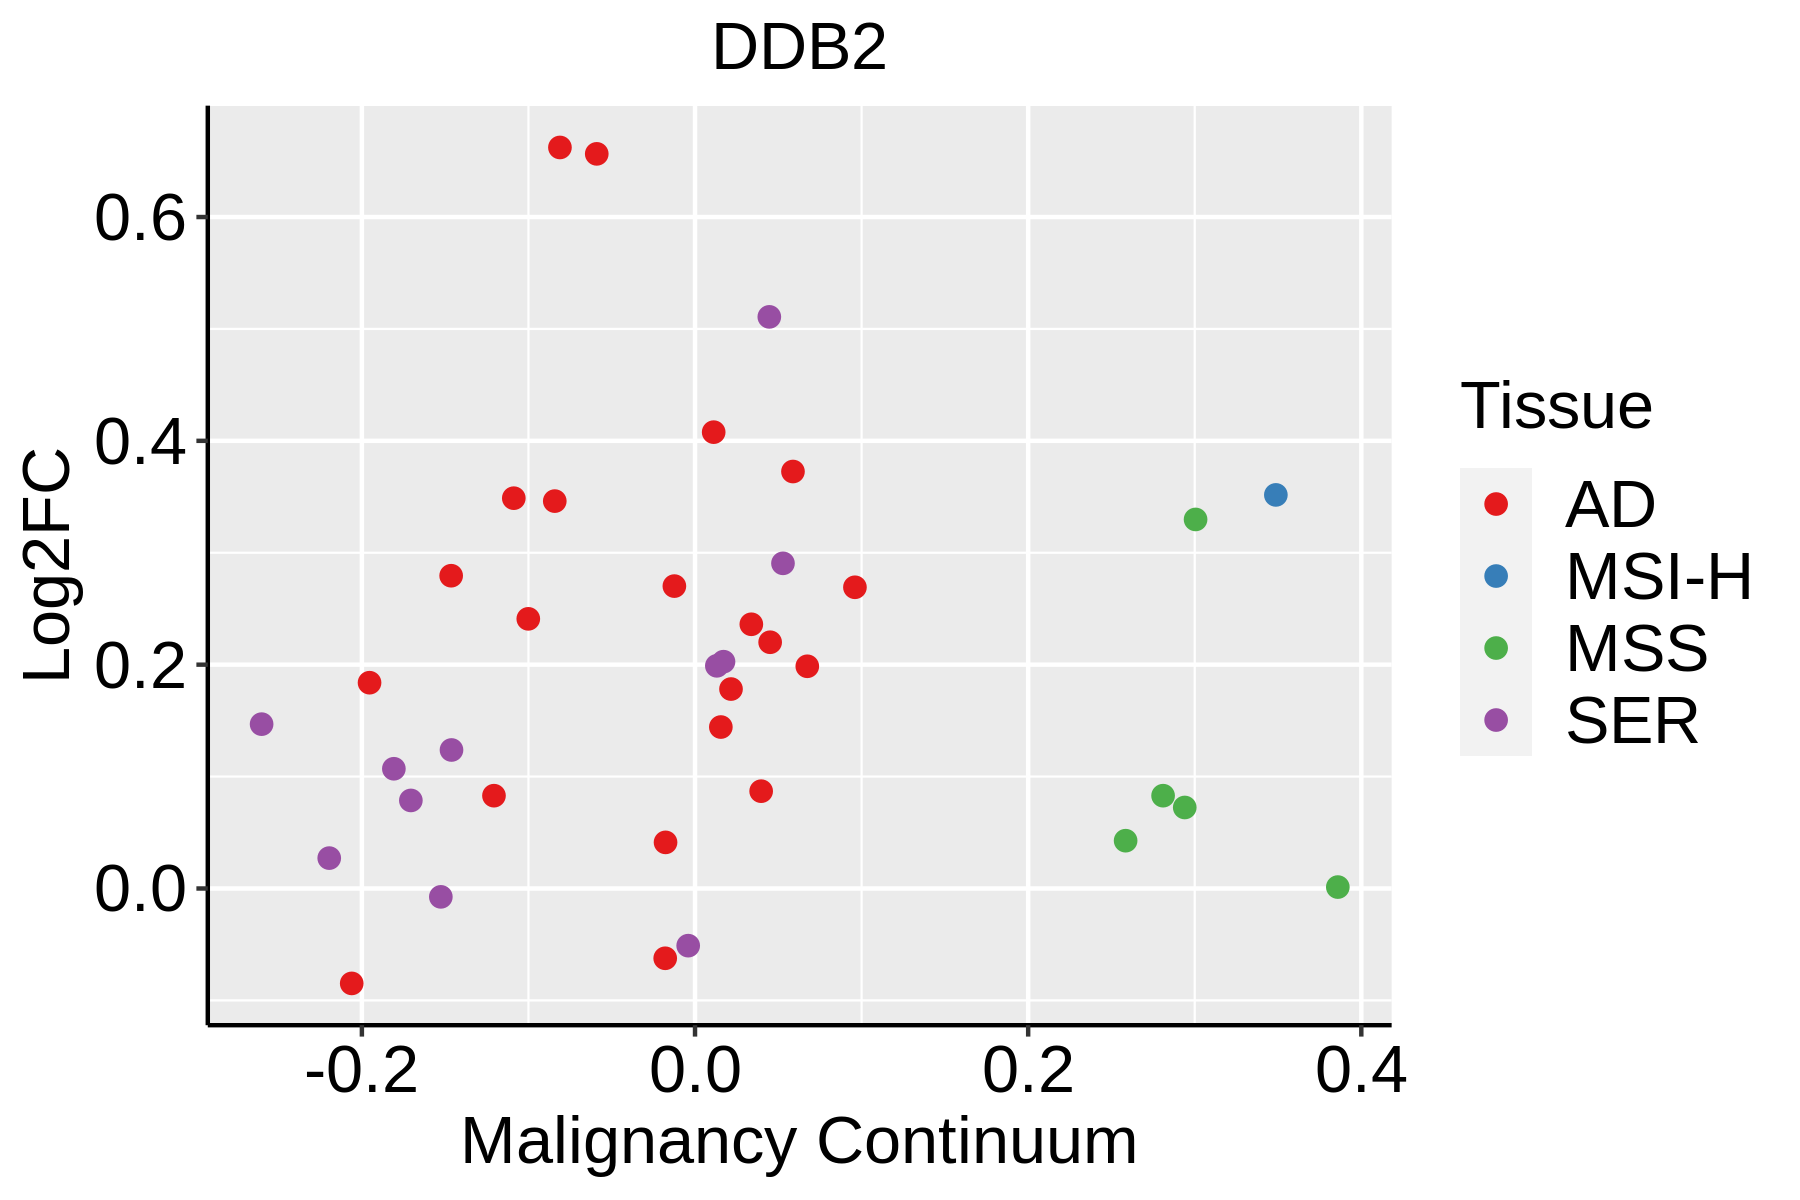 | AD: Adenomas |
| SER: Sessile serrated lesions | ||
| MSI-H: Microsatellite-high colorectal cancer | ||
| MSS: Microsatellite stable colorectal cancer | ||
| Esophagus | 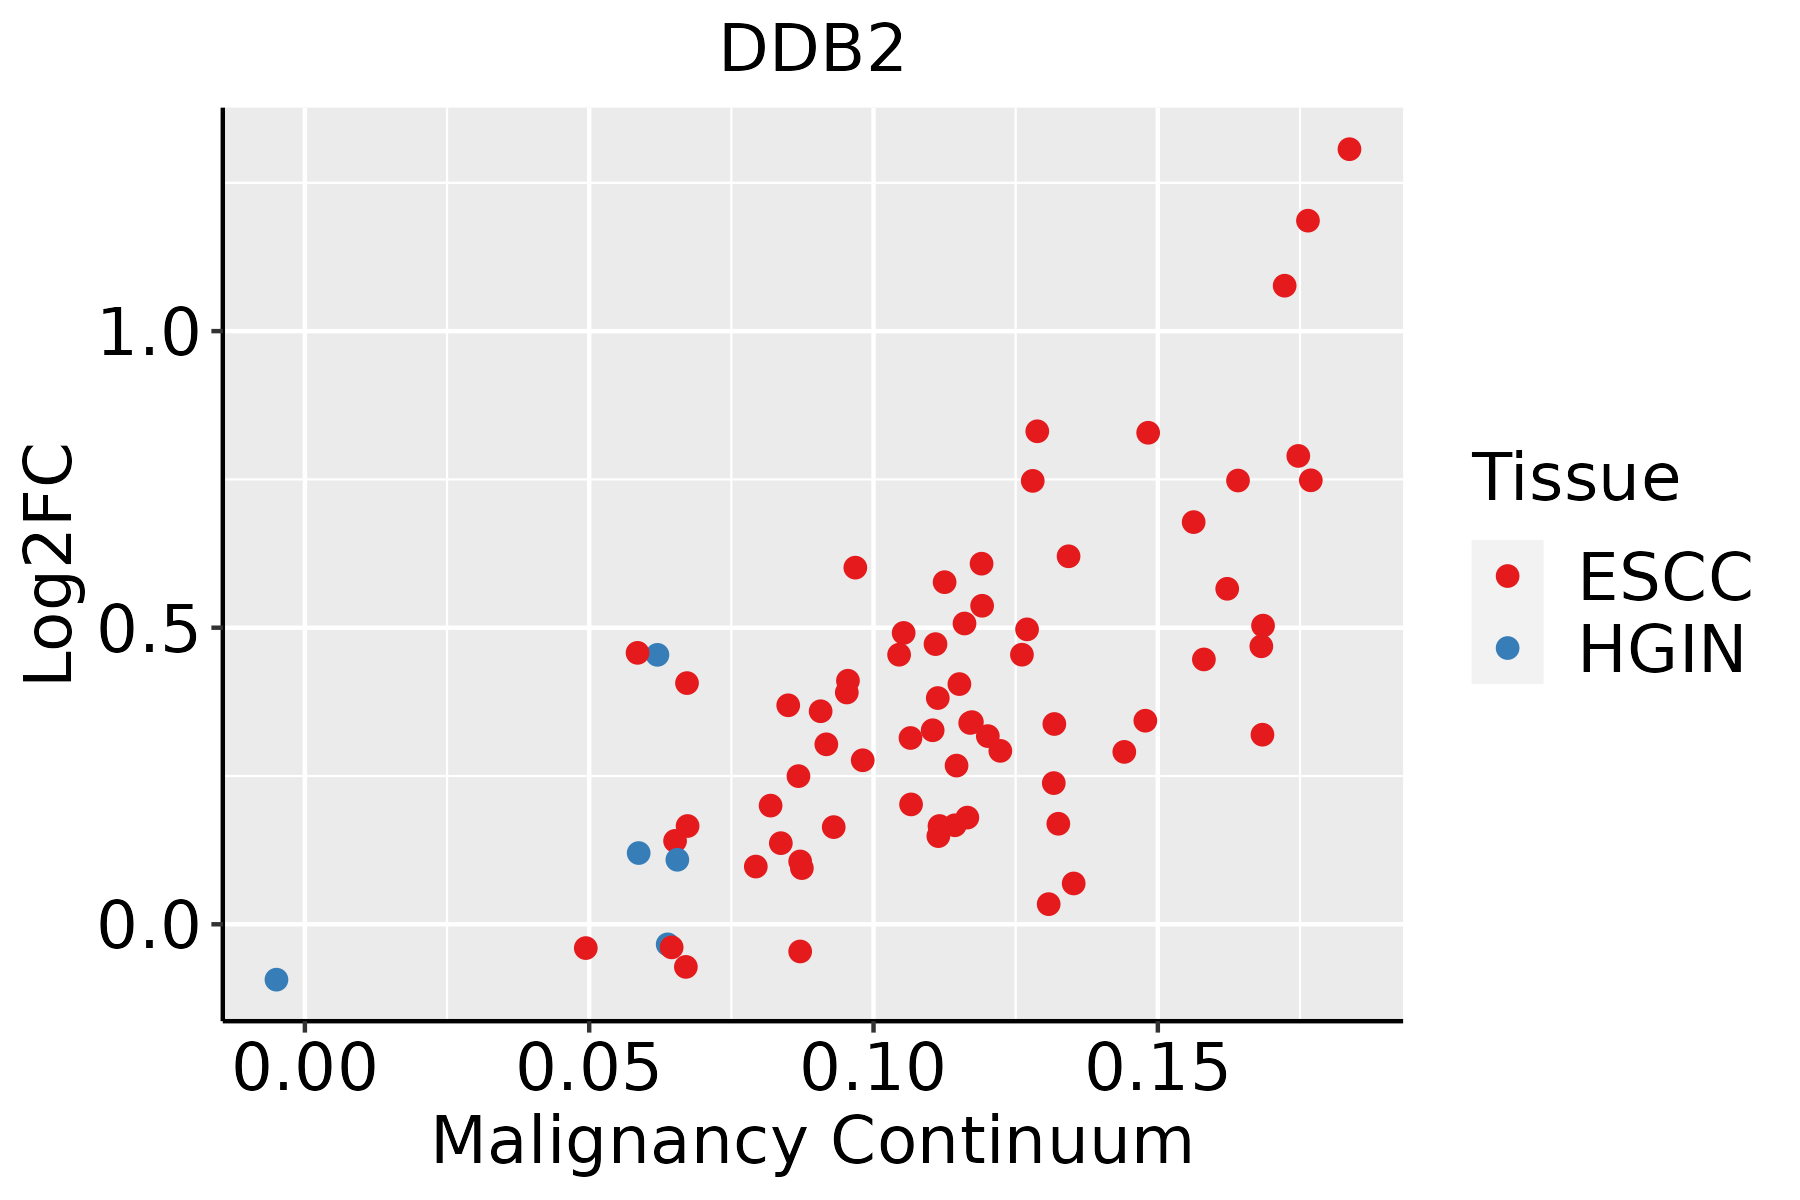 | ESCC: Esophageal squamous cell carcinoma |
| HGIN: High-grade intraepithelial neoplasias | ||
| LGIN: Low-grade intraepithelial neoplasias | ||
| Oral Cavity | 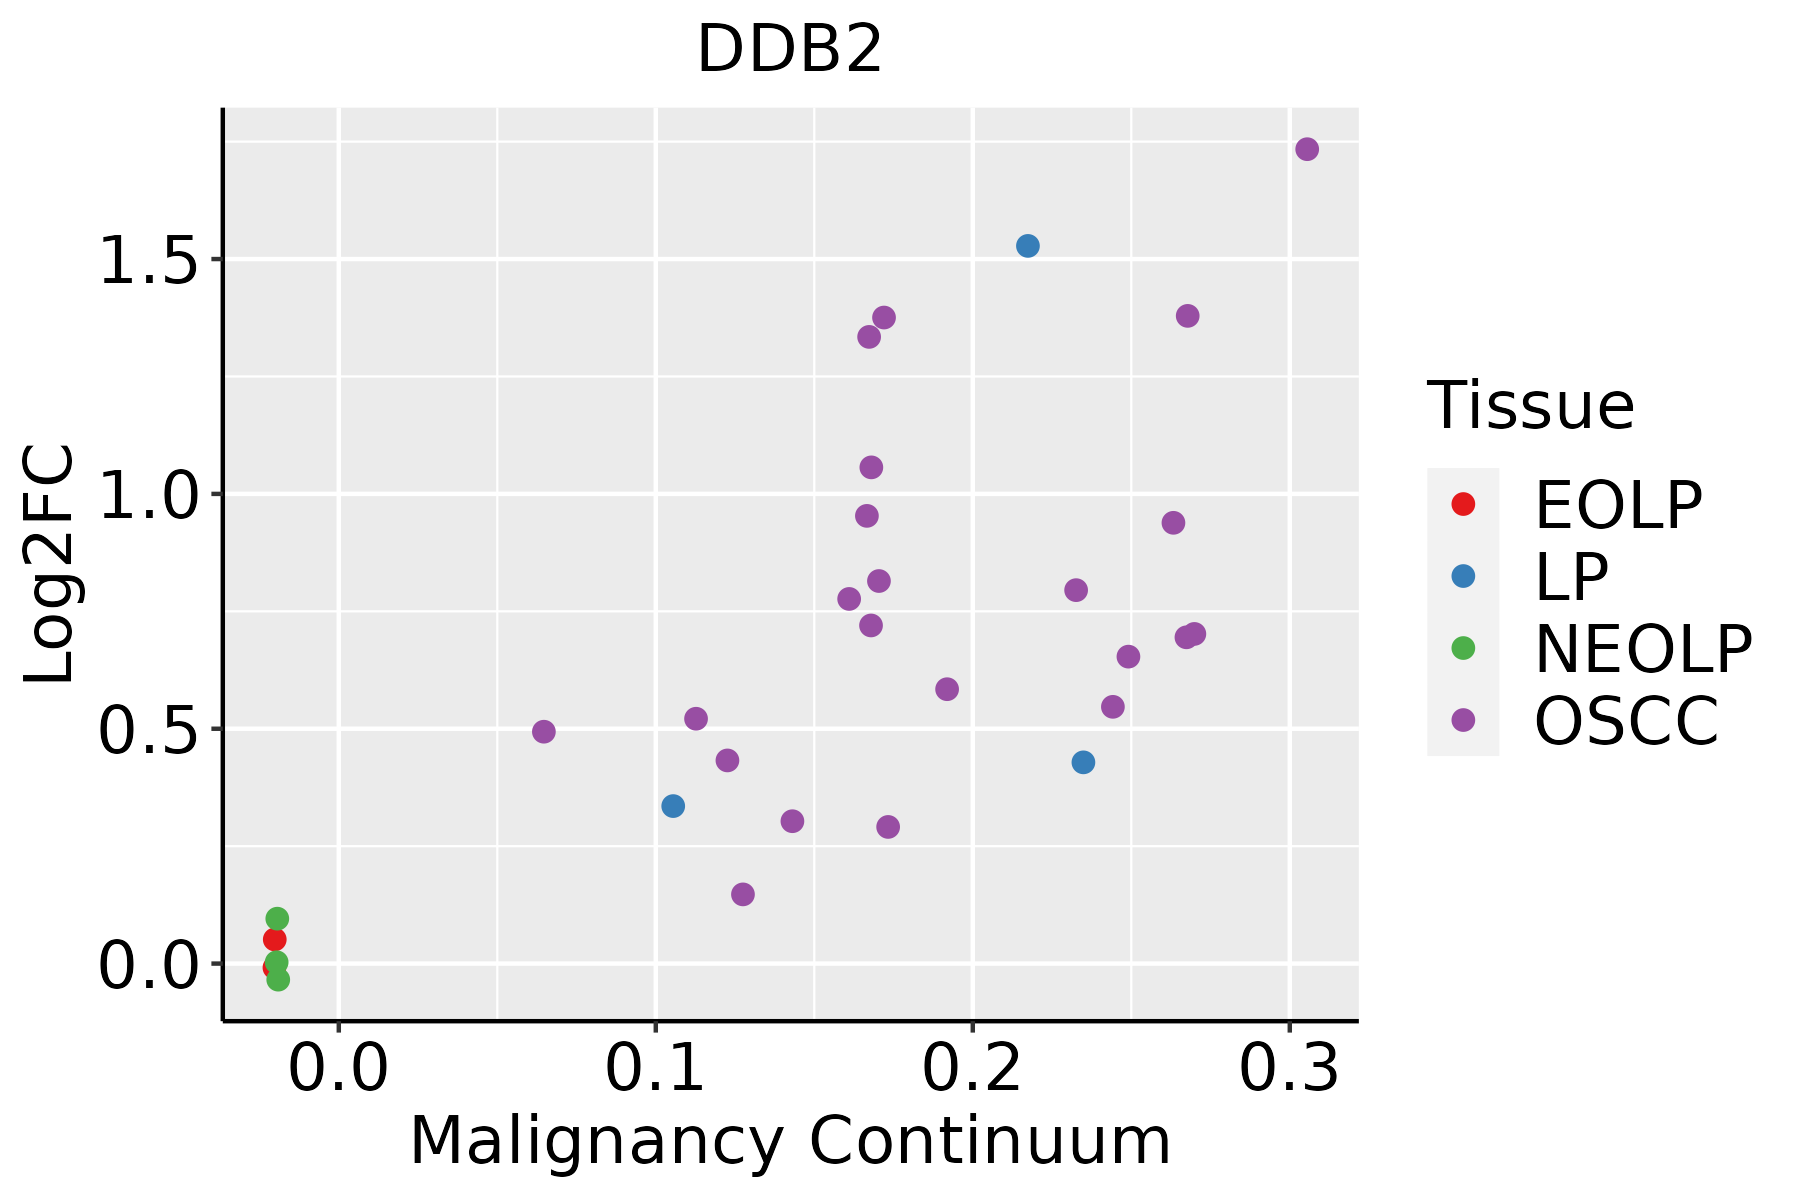 | EOLP: Erosive Oral lichen planus |
| LP: leukoplakia | ||
| NEOLP: Non-erosive oral lichen planus | ||
| OSCC: Oral squamous cell carcinoma | ||
| Skin | 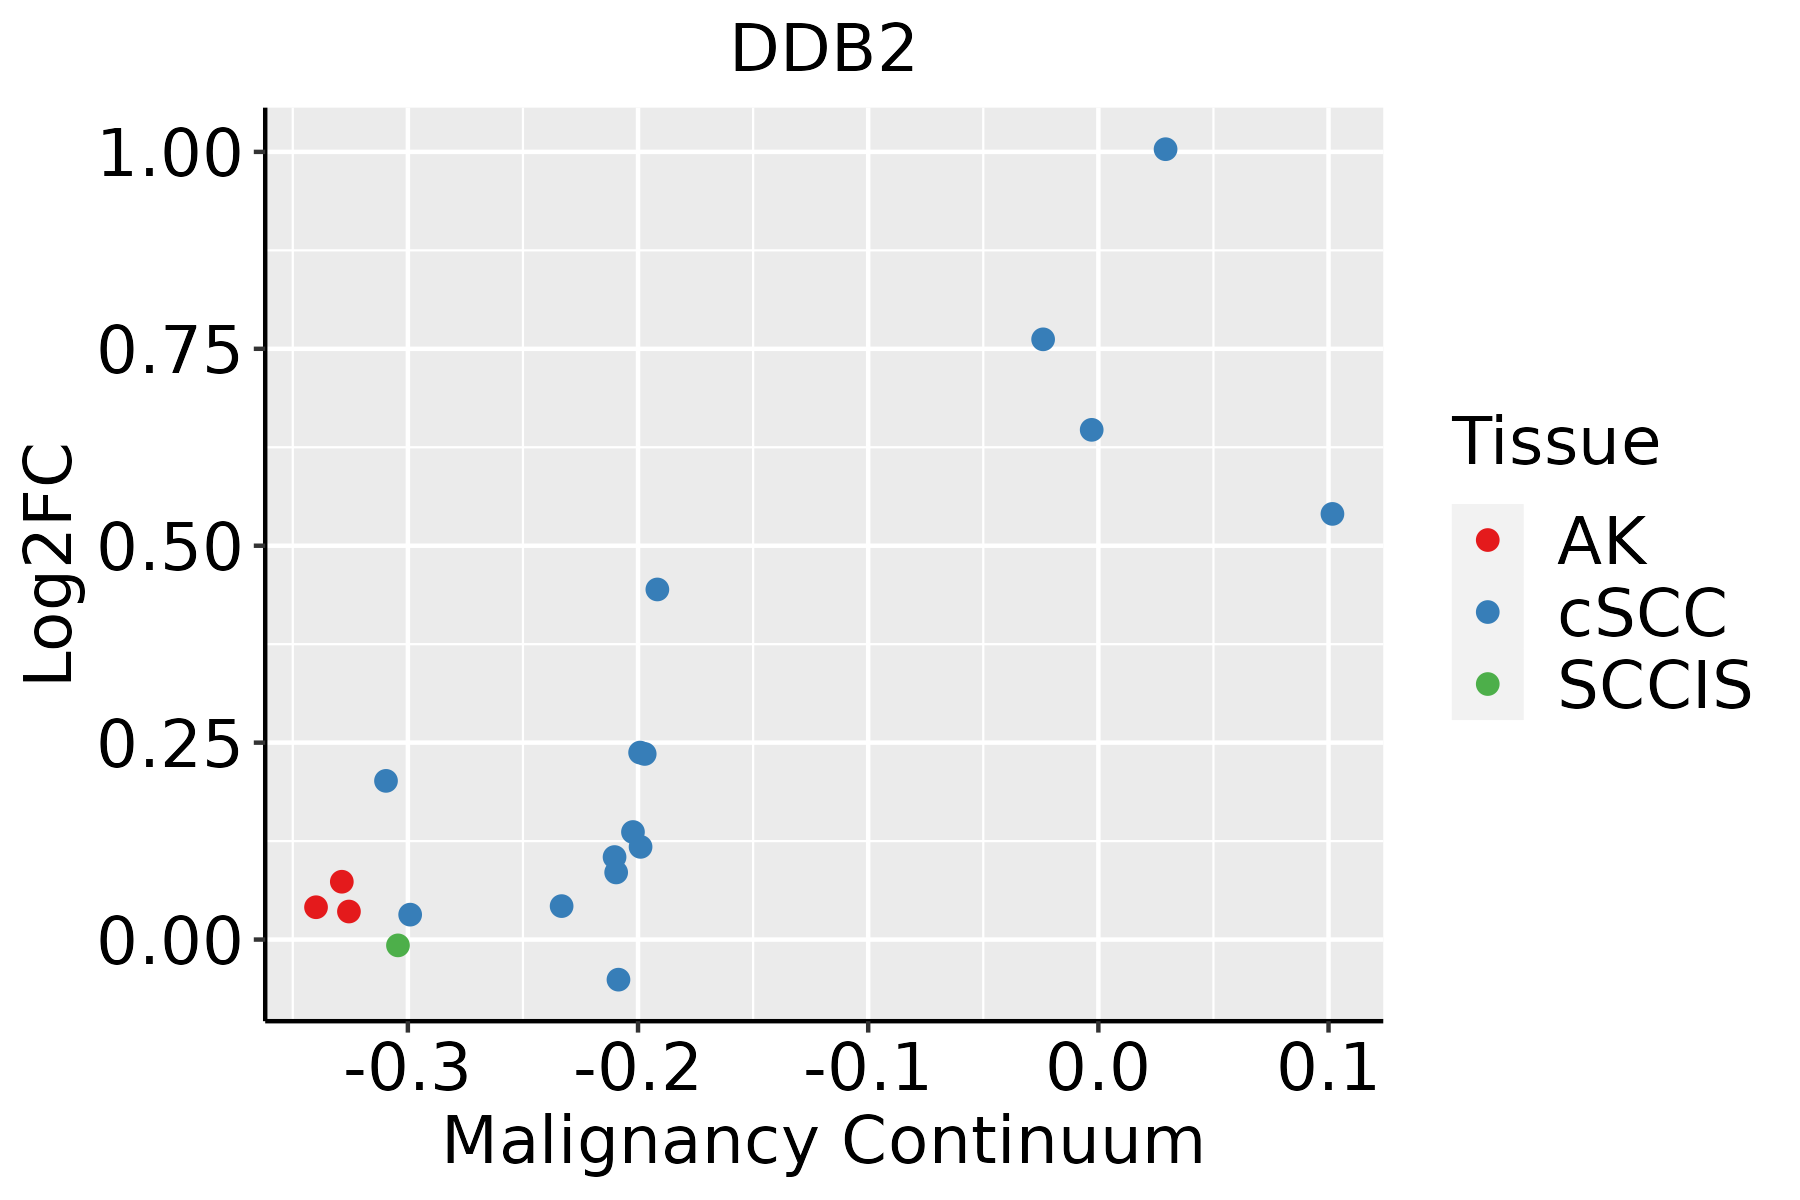 | AK: Actinic keratosis |
| cSCC: Cutaneous squamous cell carcinoma | ||
| SCCIS:squamous cell carcinoma in situ | ||
| Thyroid | 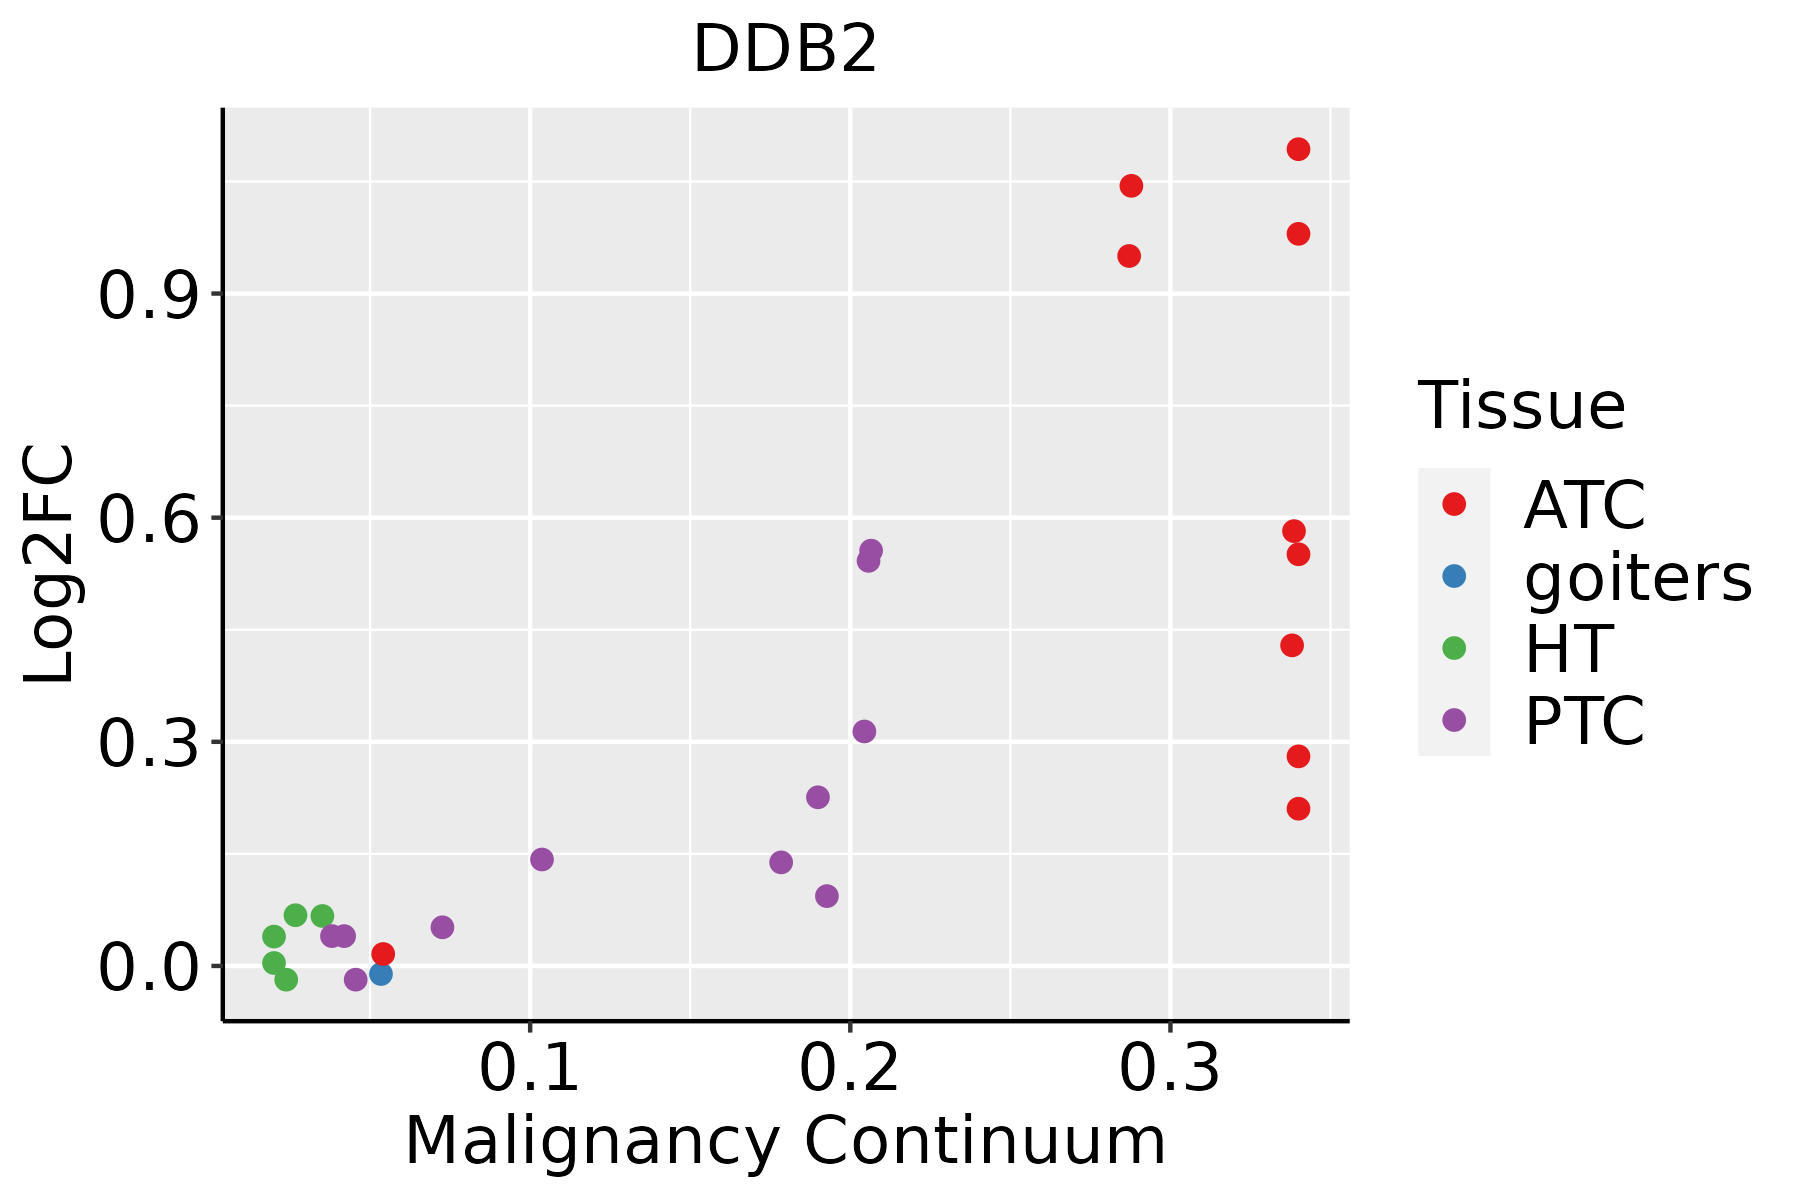 | ATC: Anaplastic thyroid cancer |
| HT: Hashimoto's thyroiditis | ||
| PTC: Papillary thyroid cancer |
| ∗log2FC in expression of this searched gene in stem-like cells from each diseased tissue sample relative to stem-like cells in normal samples in each tissue plotted against the malignancy continuum. Samples are colored based on if they are from different disease stage. |
Top |
Malignant transformation related pathway analysis |
| Find out the enriched GO biological processes and KEGG pathways involved in transition from healthy to precancer to cancer |
| Tissue | Disease Stage | Enriched GO biological Processes |
| Colorectum | AD |  |
| Colorectum | SER |  |
| Colorectum | MSS |  |
| Colorectum | MSI-H |  |
| Colorectum | FAP |  |
| ∗Top 15 enriched GO BP terms are showed in the bar plot of each disease state in each tissue. Each row represents a significant GO biological process which is colored according to the -log10(p.adjust). |
| Page: 1 2 3 4 5 6 7 8 9 |
| GO ID | Tissue | Disease Stage | Description | Gene Ratio | Bg Ratio | pvalue | p.adjust | Count |
| GO:0000209 | Colorectum | AD | protein polyubiquitination | 78/3918 | 236/18723 | 8.71e-06 | 2.06e-04 | 78 |
| GO:0051865 | Colorectum | AD | protein autoubiquitination | 28/3918 | 73/18723 | 4.87e-04 | 5.30e-03 | 28 |
| GO:0033522 | Colorectum | AD | histone H2A ubiquitination | 12/3918 | 26/18723 | 3.47e-03 | 2.51e-02 | 12 |
| GO:0006513 | Colorectum | AD | protein monoubiquitination | 23/3918 | 67/18723 | 7.55e-03 | 4.58e-02 | 23 |
| GO:00002092 | Colorectum | MSS | protein polyubiquitination | 72/3467 | 236/18723 | 5.19e-06 | 1.42e-04 | 72 |
| GO:0016570 | Colorectum | MSS | histone modification | 113/3467 | 463/18723 | 8.37e-04 | 8.68e-03 | 113 |
| GO:00518651 | Colorectum | MSS | protein autoubiquitination | 25/3467 | 73/18723 | 1.00e-03 | 1.00e-02 | 25 |
| GO:00335221 | Colorectum | MSS | histone H2A ubiquitination | 12/3467 | 26/18723 | 1.16e-03 | 1.12e-02 | 12 |
| GO:00065131 | Colorectum | MSS | protein monoubiquitination | 21/3467 | 67/18723 | 7.90e-03 | 4.84e-02 | 21 |
| GO:0016574 | Colorectum | MSS | histone ubiquitination | 16/3467 | 47/18723 | 8.22e-03 | 4.99e-02 | 16 |
| GO:00002093 | Colorectum | FAP | protein polyubiquitination | 59/2622 | 236/18723 | 4.53e-06 | 1.52e-04 | 59 |
| GO:00165701 | Colorectum | FAP | histone modification | 94/2622 | 463/18723 | 1.06e-04 | 1.76e-03 | 94 |
| GO:00518652 | Colorectum | FAP | protein autoubiquitination | 22/2622 | 73/18723 | 2.88e-04 | 3.77e-03 | 22 |
| GO:00335222 | Colorectum | FAP | histone H2A ubiquitination | 10/2622 | 26/18723 | 1.77e-03 | 1.53e-02 | 10 |
| GO:00165741 | Colorectum | FAP | histone ubiquitination | 14/2622 | 47/18723 | 3.95e-03 | 2.75e-02 | 14 |
| GO:00065132 | Colorectum | FAP | protein monoubiquitination | 18/2622 | 67/18723 | 4.08e-03 | 2.81e-02 | 18 |
| GO:0071214 | Colorectum | FAP | cellular response to abiotic stimulus | 63/2622 | 331/18723 | 6.38e-03 | 3.99e-02 | 63 |
| GO:0104004 | Colorectum | FAP | cellular response to environmental stimulus | 63/2622 | 331/18723 | 6.38e-03 | 3.99e-02 | 63 |
| GO:000020916 | Esophagus | HGIN | protein polyubiquitination | 58/2587 | 236/18723 | 6.29e-06 | 1.97e-04 | 58 |
| GO:00165708 | Esophagus | HGIN | histone modification | 92/2587 | 463/18723 | 1.70e-04 | 3.30e-03 | 92 |
| Page: 1 2 3 4 5 6 |
| Pathway ID | Tissue | Disease Stage | Description | Gene Ratio | Bg Ratio | pvalue | p.adjust | qvalue | Count |
| hsa04120 | Colorectum | AD | Ubiquitin mediated proteolysis | 58/2092 | 142/8465 | 1.46e-05 | 1.53e-04 | 9.76e-05 | 58 |
| hsa05213 | Colorectum | AD | Endometrial cancer | 29/2092 | 58/8465 | 2.69e-05 | 2.57e-04 | 1.64e-04 | 29 |
| hsa05216 | Colorectum | AD | Thyroid cancer | 21/2092 | 37/8465 | 3.05e-05 | 2.76e-04 | 1.76e-04 | 21 |
| hsa05210 | Colorectum | AD | Colorectal cancer | 35/2092 | 86/8465 | 7.54e-04 | 5.49e-03 | 3.50e-03 | 35 |
| hsa05220 | Colorectum | AD | Chronic myeloid leukemia | 31/2092 | 76/8465 | 1.41e-03 | 8.46e-03 | 5.39e-03 | 31 |
| hsa05225 | Colorectum | AD | Hepatocellular carcinoma | 59/2092 | 168/8465 | 1.50e-03 | 8.69e-03 | 5.54e-03 | 59 |
| hsa05212 | Colorectum | AD | Pancreatic cancer | 29/2092 | 76/8465 | 6.25e-03 | 2.68e-02 | 1.71e-02 | 29 |
| hsa041201 | Colorectum | AD | Ubiquitin mediated proteolysis | 58/2092 | 142/8465 | 1.46e-05 | 1.53e-04 | 9.76e-05 | 58 |
| hsa052131 | Colorectum | AD | Endometrial cancer | 29/2092 | 58/8465 | 2.69e-05 | 2.57e-04 | 1.64e-04 | 29 |
| hsa052161 | Colorectum | AD | Thyroid cancer | 21/2092 | 37/8465 | 3.05e-05 | 2.76e-04 | 1.76e-04 | 21 |
| hsa052101 | Colorectum | AD | Colorectal cancer | 35/2092 | 86/8465 | 7.54e-04 | 5.49e-03 | 3.50e-03 | 35 |
| hsa052201 | Colorectum | AD | Chronic myeloid leukemia | 31/2092 | 76/8465 | 1.41e-03 | 8.46e-03 | 5.39e-03 | 31 |
| hsa052251 | Colorectum | AD | Hepatocellular carcinoma | 59/2092 | 168/8465 | 1.50e-03 | 8.69e-03 | 5.54e-03 | 59 |
| hsa052121 | Colorectum | AD | Pancreatic cancer | 29/2092 | 76/8465 | 6.25e-03 | 2.68e-02 | 1.71e-02 | 29 |
| hsa052162 | Colorectum | MSS | Thyroid cancer | 21/1875 | 37/8465 | 4.98e-06 | 6.00e-05 | 3.68e-05 | 21 |
| hsa041204 | Colorectum | MSS | Ubiquitin mediated proteolysis | 55/1875 | 142/8465 | 5.02e-06 | 6.00e-05 | 3.68e-05 | 55 |
| hsa052202 | Colorectum | MSS | Chronic myeloid leukemia | 29/1875 | 76/8465 | 1.10e-03 | 6.27e-03 | 3.84e-03 | 29 |
| hsa05169 | Colorectum | MSS | Epstein-Barr virus infection | 63/1875 | 202/8465 | 1.63e-03 | 8.98e-03 | 5.50e-03 | 63 |
| hsa052122 | Colorectum | MSS | Pancreatic cancer | 26/1875 | 76/8465 | 1.04e-02 | 3.69e-02 | 2.26e-02 | 26 |
| hsa05222 | Colorectum | MSS | Small cell lung cancer | 30/1875 | 92/8465 | 1.31e-02 | 4.30e-02 | 2.64e-02 | 30 |
| Page: 1 2 3 4 5 6 7 |
Top |
Cell-cell communication analysis |
| Identification of potential cell-cell interactions between two cell types and their ligand-receptor pairs for different disease states |
| Ligand | Receptor | LRpair | Pathway | Tissue | Disease Stage |
| Page: 1 |
Top |
Single-cell gene regulatory network inference analysis |
| Find out the significant the regulons (TFs) and the target genes of each regulon across cell types for different disease states |
| TF | Cell Type | Tissue | Disease Stage | Target Gene | RSS | Regulon Activity |
| ∗The dot plots of a searched regulon are shown for all cell subpopulations in each disease state of each tissue based on the regulon specific score inferred using pySCENIC and by calculating the average expression. |
| Page: 1 |
Top |
Somatic mutation of malignant transformation related genes |
| Annotation of somatic variants for genes involved in malignant transformation |
| Hugo Symbol | Variant Class | Variant Classification | dbSNP RS | HGVSc | HGVSp | HGVSp Short | SWISSPROT | BIOTYPE | SIFT | PolyPhen | Tumor Sample Barcode | Tissue | Histology | Sex | Age | Stage | Therapy Types | Drugs | Outcome |
| DDB2 | SNV | Missense_Mutation | c.716N>A | p.Arg239Lys | p.R239K | Q92466 | protein_coding | tolerated(0.99) | benign(0.049) | TCGA-GM-A2D9-01 | Breast | breast invasive carcinoma | Female | >=65 | I/II | Hormone Therapy | arimidex | SD | |
| DDB2 | deletion | Frame_Shift_Del | novel | c.1034delA | p.His345LeufsTer25 | p.H345Lfs*25 | Q92466 | protein_coding | TCGA-EW-A2FV-01 | Breast | breast invasive carcinoma | Female | <65 | III/IV | Chemotherapy | docetaxel | SD | ||
| DDB2 | SNV | Missense_Mutation | c.807N>G | p.Ile269Met | p.I269M | Q92466 | protein_coding | tolerated(0.09) | possibly_damaging(0.732) | TCGA-FU-A3HZ-01 | Cervix | cervical & endocervical cancer | Female | <65 | I/II | Chemotherapy | cisplatin | CR | |
| DDB2 | SNV | Missense_Mutation | novel | c.145N>C | p.Asp49His | p.D49H | Q92466 | protein_coding | deleterious(0.01) | possibly_damaging(0.674) | TCGA-HM-A4S6-01 | Cervix | cervical & endocervical cancer | Female | <65 | III/IV | Chemotherapy | cisplatin | CR |
| DDB2 | SNV | Missense_Mutation | rs375649516 | c.1126N>A | p.Asp376Asn | p.D376N | Q92466 | protein_coding | deleterious(0.04) | probably_damaging(0.999) | TCGA-AG-3892-01 | Colorectum | rectum adenocarcinoma | Female | <65 | I/II | Unknown | Unknown | SD |
| DDB2 | SNV | Missense_Mutation | novel | c.1200C>A | p.Phe400Leu | p.F400L | Q92466 | protein_coding | deleterious(0) | possibly_damaging(0.808) | TCGA-EI-6917-01 | Colorectum | rectum adenocarcinoma | Male | <65 | III/IV | Chemotherapy | 5fluorouracil+oxaciplatina+l-folinian | SD |
| DDB2 | SNV | Missense_Mutation | novel | c.1019N>C | p.Ile340Thr | p.I340T | Q92466 | protein_coding | deleterious(0) | probably_damaging(0.999) | TCGA-A5-A0G2-01 | Endometrium | uterine corpus endometrioid carcinoma | Female | <65 | III/IV | Unknown | Unknown | SD |
| DDB2 | SNV | Missense_Mutation | novel | c.1028N>T | p.Ala343Val | p.A343V | Q92466 | protein_coding | deleterious(0.01) | benign(0.023) | TCGA-A5-A1OF-01 | Endometrium | uterine corpus endometrioid carcinoma | Female | <65 | I/II | Unknown | Unknown | SD |
| DDB2 | SNV | Missense_Mutation | novel | c.1276N>T | p.Arg426Trp | p.R426W | Q92466 | protein_coding | deleterious(0) | benign(0) | TCGA-AJ-A3BG-01 | Endometrium | uterine corpus endometrioid carcinoma | Female | >=65 | I/II | Chemotherapy | carboplatin | PD |
| DDB2 | SNV | Missense_Mutation | novel | c.863N>T | p.Arg288Met | p.R288M | Q92466 | protein_coding | deleterious(0.04) | benign(0.251) | TCGA-AJ-A3EK-01 | Endometrium | uterine corpus endometrioid carcinoma | Female | <65 | I/II | Chemotherapy | carboplatin | CR |
| Page: 1 2 3 4 |
Top |
Related drugs of malignant transformation related genes |
| Identification of chemicals and drugs interact with genes involved in malignant transfromation |
| (DGIdb 4.0) |
| Entrez ID | Symbol | Category | Interaction Types | Drug Claim Name | Drug Name | PMIDs |
| Page: 1 |

Copyright 2023-Present -The University of Texas Health Science Center at Houston |