| Tissue | Expression Dynamics | Abbreviation |
| Colorectum (GSE201348) |  | FAP: Familial adenomatous polyposis |
| CRC: Colorectal cancer |
| Colorectum (HTA11) |  | AD: Adenomas |
| SER: Sessile serrated lesions |
| MSI-H: Microsatellite-high colorectal cancer |
| MSS: Microsatellite stable colorectal cancer |
| Esophagus | 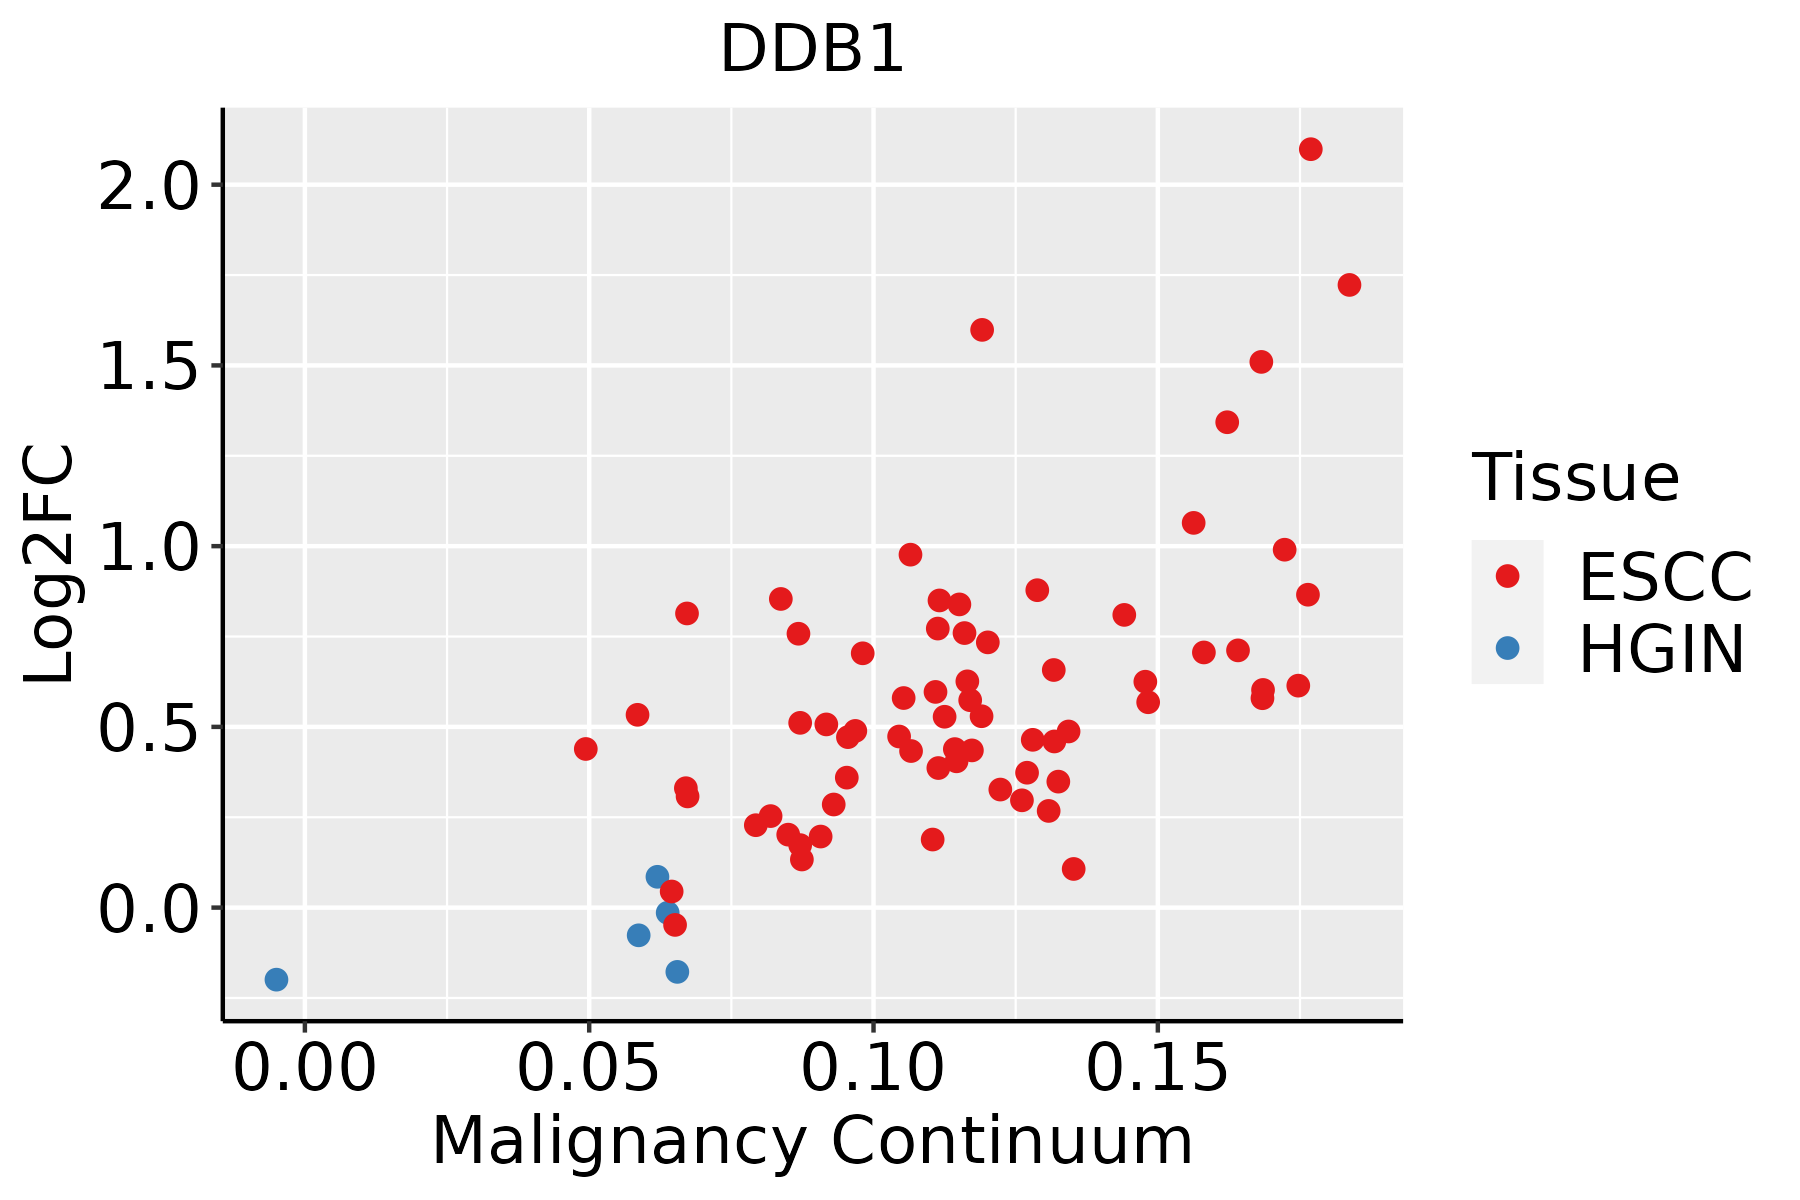 | ESCC: Esophageal squamous cell carcinoma |
| HGIN: High-grade intraepithelial neoplasias |
| LGIN: Low-grade intraepithelial neoplasias |
| Liver |  | HCC: Hepatocellular carcinoma |
| NAFLD: Non-alcoholic fatty liver disease |
| Oral Cavity | 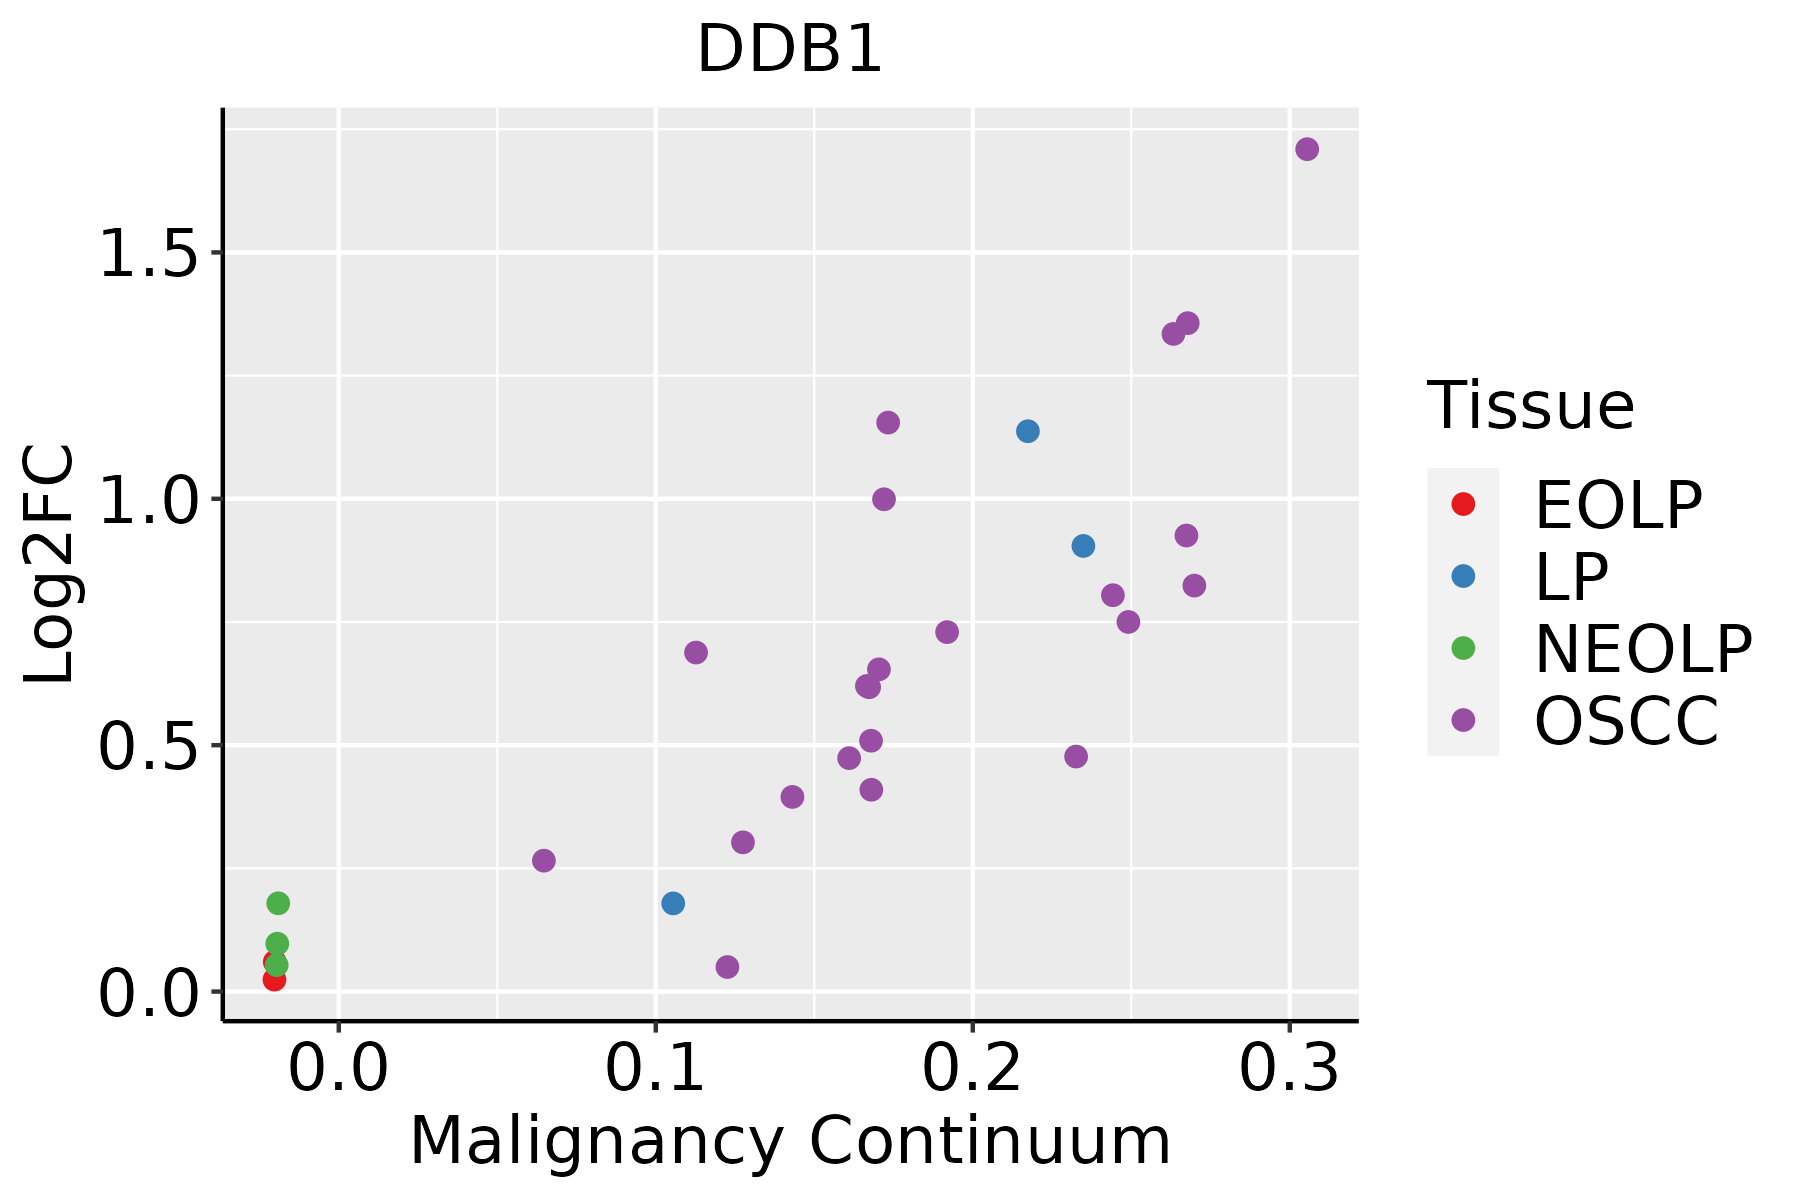 | EOLP: Erosive Oral lichen planus |
| LP: leukoplakia |
| NEOLP: Non-erosive oral lichen planus |
| OSCC: Oral squamous cell carcinoma |
| Prostate | 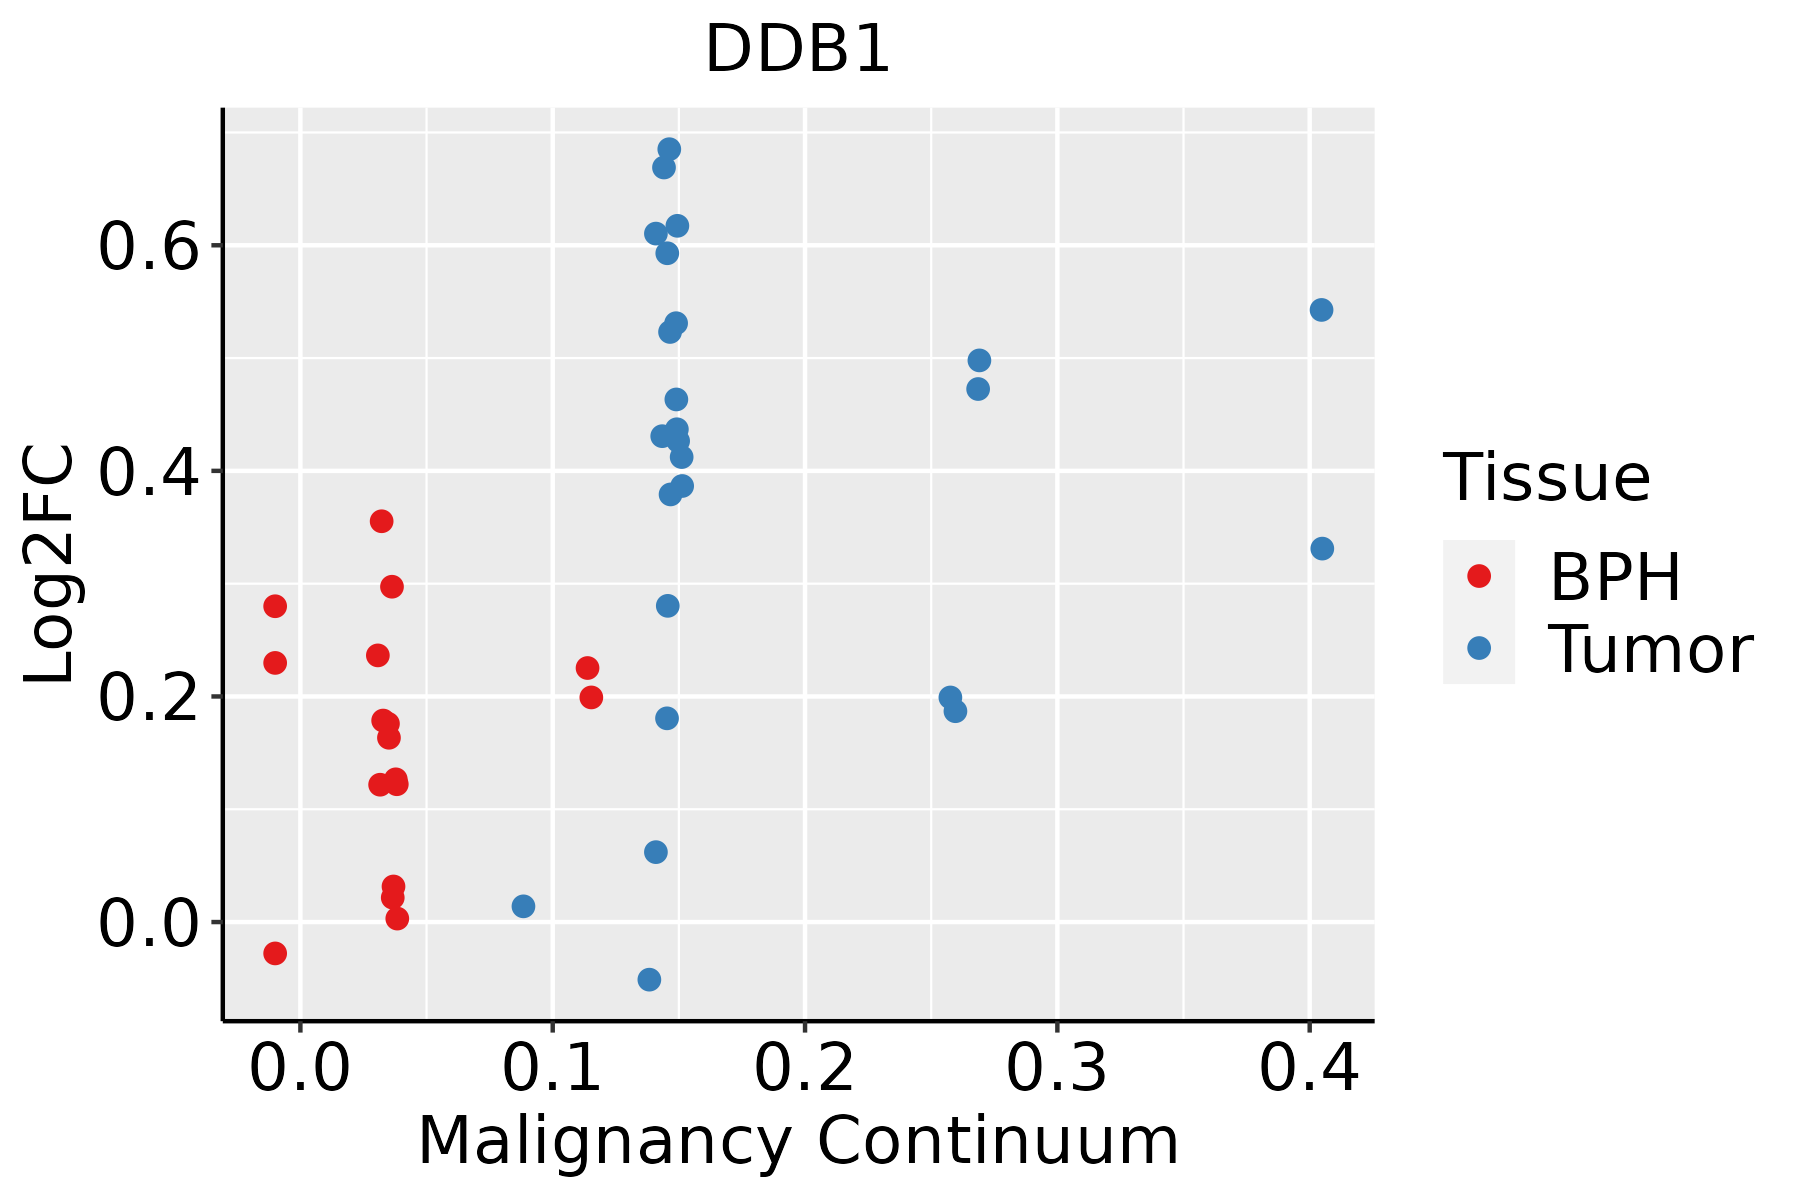 | BPH: Benign Prostatic Hyperplasia |
| Skin | 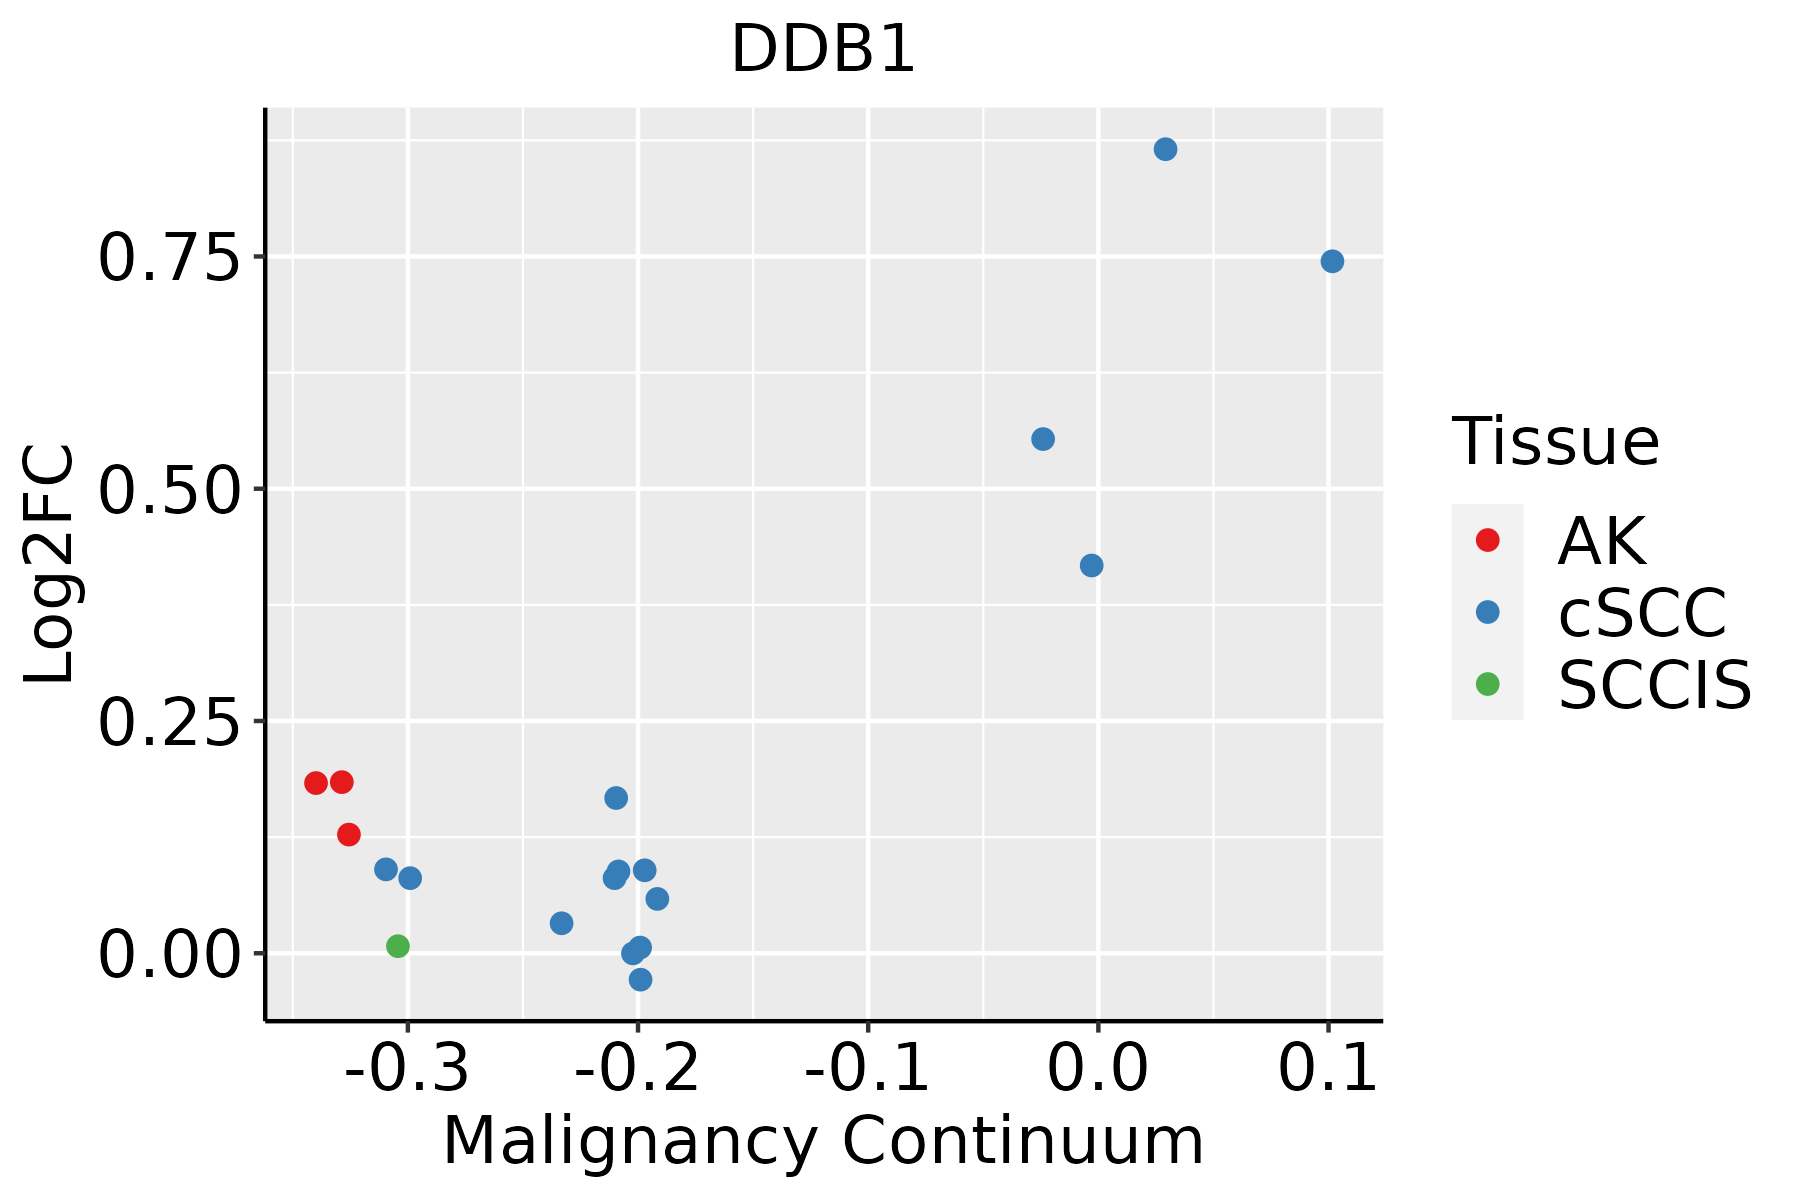 | AK: Actinic keratosis |
| cSCC: Cutaneous squamous cell carcinoma |
| SCCIS:squamous cell carcinoma in situ |
| Thyroid |  | ATC: Anaplastic thyroid cancer |
| HT: Hashimoto's thyroiditis |
| PTC: Papillary thyroid cancer |
| GO ID | Tissue | Disease Stage | Description | Gene Ratio | Bg Ratio | pvalue | p.adjust | Count |
| GO:0016032 | Colorectum | AD | viral process | 168/3918 | 415/18723 | 4.67e-20 | 3.66e-17 | 168 |
| GO:0042176 | Colorectum | AD | regulation of protein catabolic process | 160/3918 | 391/18723 | 1.06e-19 | 7.34e-17 | 160 |
| GO:0009896 | Colorectum | AD | positive regulation of catabolic process | 180/3918 | 492/18723 | 4.33e-16 | 1.94e-13 | 180 |
| GO:0010498 | Colorectum | AD | proteasomal protein catabolic process | 174/3918 | 490/18723 | 3.18e-14 | 7.66e-12 | 174 |
| GO:0019058 | Colorectum | AD | viral life cycle | 119/3918 | 317/18723 | 6.18e-12 | 8.23e-10 | 119 |
| GO:0045732 | Colorectum | AD | positive regulation of protein catabolic process | 92/3918 | 231/18723 | 3.85e-11 | 4.47e-09 | 92 |
| GO:0043161 | Colorectum | AD | proteasome-mediated ubiquitin-dependent protein catabolic process | 141/3918 | 412/18723 | 1.77e-10 | 1.68e-08 | 141 |
| GO:0044403 | Colorectum | AD | biological process involved in symbiotic interaction | 99/3918 | 290/18723 | 1.02e-07 | 4.93e-06 | 99 |
| GO:0051701 | Colorectum | AD | biological process involved in interaction with host | 73/3918 | 203/18723 | 5.08e-07 | 1.88e-05 | 73 |
| GO:0048524 | Colorectum | AD | positive regulation of viral process | 31/3918 | 65/18723 | 1.33e-06 | 4.23e-05 | 31 |
| GO:0019079 | Colorectum | AD | viral genome replication | 51/3918 | 131/18723 | 1.83e-06 | 5.51e-05 | 51 |
| GO:0052126 | Colorectum | AD | movement in host environment | 63/3918 | 175/18723 | 2.85e-06 | 8.11e-05 | 63 |
| GO:0007623 | Colorectum | AD | circadian rhythm | 72/3918 | 210/18723 | 4.50e-06 | 1.21e-04 | 72 |
| GO:0050792 | Colorectum | AD | regulation of viral process | 59/3918 | 164/18723 | 5.95e-06 | 1.52e-04 | 59 |
| GO:0048511 | Colorectum | AD | rhythmic process | 94/3918 | 298/18723 | 1.00e-05 | 2.34e-04 | 94 |
| GO:0016055 | Colorectum | AD | Wnt signaling pathway | 130/3918 | 444/18723 | 1.60e-05 | 3.37e-04 | 130 |
| GO:0019318 | Colorectum | AD | hexose metabolic process | 77/3918 | 237/18723 | 1.96e-05 | 4.01e-04 | 77 |
| GO:0198738 | Colorectum | AD | cell-cell signaling by wnt | 130/3918 | 446/18723 | 2.02e-05 | 4.10e-04 | 130 |
| GO:0044262 | Colorectum | AD | cellular carbohydrate metabolic process | 87/3918 | 283/18723 | 6.00e-05 | 1.01e-03 | 87 |
| GO:0005996 | Colorectum | AD | monosaccharide metabolic process | 80/3918 | 257/18723 | 7.31e-05 | 1.17e-03 | 80 |
| Pathway ID | Tissue | Disease Stage | Description | Gene Ratio | Bg Ratio | pvalue | p.adjust | qvalue | Count |
| hsa04120 | Colorectum | AD | Ubiquitin mediated proteolysis | 58/2092 | 142/8465 | 1.46e-05 | 1.53e-04 | 9.76e-05 | 58 |
| hsa05170 | Colorectum | AD | Human immunodeficiency virus 1 infection | 72/2092 | 212/8465 | 1.40e-03 | 8.46e-03 | 5.39e-03 | 72 |
| hsa041201 | Colorectum | AD | Ubiquitin mediated proteolysis | 58/2092 | 142/8465 | 1.46e-05 | 1.53e-04 | 9.76e-05 | 58 |
| hsa051701 | Colorectum | AD | Human immunodeficiency virus 1 infection | 72/2092 | 212/8465 | 1.40e-03 | 8.46e-03 | 5.39e-03 | 72 |
| hsa051702 | Colorectum | SER | Human immunodeficiency virus 1 infection | 58/1580 | 212/8465 | 1.08e-03 | 8.56e-03 | 6.21e-03 | 58 |
| hsa041202 | Colorectum | SER | Ubiquitin mediated proteolysis | 39/1580 | 142/8465 | 6.18e-03 | 3.66e-02 | 2.66e-02 | 39 |
| hsa051703 | Colorectum | SER | Human immunodeficiency virus 1 infection | 58/1580 | 212/8465 | 1.08e-03 | 8.56e-03 | 6.21e-03 | 58 |
| hsa041203 | Colorectum | SER | Ubiquitin mediated proteolysis | 39/1580 | 142/8465 | 6.18e-03 | 3.66e-02 | 2.66e-02 | 39 |
| hsa041204 | Colorectum | MSS | Ubiquitin mediated proteolysis | 55/1875 | 142/8465 | 5.02e-06 | 6.00e-05 | 3.68e-05 | 55 |
| hsa051704 | Colorectum | MSS | Human immunodeficiency virus 1 infection | 69/1875 | 212/8465 | 2.66e-04 | 1.98e-03 | 1.21e-03 | 69 |
| hsa05161 | Colorectum | MSS | Hepatitis B | 48/1875 | 162/8465 | 1.53e-02 | 4.93e-02 | 3.02e-02 | 48 |
| hsa041205 | Colorectum | MSS | Ubiquitin mediated proteolysis | 55/1875 | 142/8465 | 5.02e-06 | 6.00e-05 | 3.68e-05 | 55 |
| hsa051705 | Colorectum | MSS | Human immunodeficiency virus 1 infection | 69/1875 | 212/8465 | 2.66e-04 | 1.98e-03 | 1.21e-03 | 69 |
| hsa051611 | Colorectum | MSS | Hepatitis B | 48/1875 | 162/8465 | 1.53e-02 | 4.93e-02 | 3.02e-02 | 48 |
| hsa041206 | Colorectum | FAP | Ubiquitin mediated proteolysis | 51/1404 | 142/8465 | 1.55e-08 | 5.84e-07 | 3.55e-07 | 51 |
| hsa051706 | Colorectum | FAP | Human immunodeficiency virus 1 infection | 51/1404 | 212/8465 | 2.98e-03 | 1.29e-02 | 7.87e-03 | 51 |
| hsa041207 | Colorectum | FAP | Ubiquitin mediated proteolysis | 51/1404 | 142/8465 | 1.55e-08 | 5.84e-07 | 3.55e-07 | 51 |
| hsa051707 | Colorectum | FAP | Human immunodeficiency virus 1 infection | 51/1404 | 212/8465 | 2.98e-03 | 1.29e-02 | 7.87e-03 | 51 |
| hsa034205 | Esophagus | HGIN | Nucleotide excision repair | 29/1383 | 63/8465 | 2.96e-08 | 5.36e-07 | 4.26e-07 | 29 |
| hsa0412026 | Esophagus | HGIN | Ubiquitin mediated proteolysis | 49/1383 | 142/8465 | 7.78e-08 | 1.33e-06 | 1.06e-06 | 49 |
| Hugo Symbol | Variant Class | Variant Classification | dbSNP RS | HGVSc | HGVSp | HGVSp Short | SWISSPROT | BIOTYPE | SIFT | PolyPhen | Tumor Sample Barcode | Tissue | Histology | Sex | Age | Stage | Therapy Types | Drugs | Outcome |
| DDB1 | SNV | Missense_Mutation | | c.1723G>A | p.Glu575Lys | p.E575K | Q16531 | protein_coding | tolerated(0.24) | benign(0.005) | TCGA-AC-A23H-01 | Breast | breast invasive carcinoma | Female | >=65 | I/II | Unknown | Unknown | PD |
| DDB1 | SNV | Missense_Mutation | novel | c.3205N>A | p.Glu1069Lys | p.E1069K | Q16531 | protein_coding | tolerated(0.31) | benign(0.005) | TCGA-AN-A046-01 | Breast | breast invasive carcinoma | Female | >=65 | I/II | Unknown | Unknown | SD |
| DDB1 | SNV | Missense_Mutation | | c.148N>T | p.Arg50Trp | p.R50W | Q16531 | protein_coding | deleterious(0.01) | possibly_damaging(0.901) | TCGA-AR-A0TX-01 | Breast | breast invasive carcinoma | Female | <65 | I/II | Unknown | Unknown | SD |
| DDB1 | SNV | Missense_Mutation | novel | c.1623N>T | p.Leu541Phe | p.L541F | Q16531 | protein_coding | deleterious(0) | probably_damaging(0.986) | TCGA-AR-A1AP-01 | Breast | breast invasive carcinoma | Female | >=65 | I/II | Hormone Therapy | anastrozole | SD |
| DDB1 | SNV | Missense_Mutation | | c.725G>A | p.Gly242Asp | p.G242D | Q16531 | protein_coding | deleterious(0) | possibly_damaging(0.904) | TCGA-B6-A0RO-01 | Breast | breast invasive carcinoma | Female | >=65 | III/IV | Unknown | Unknown | SD |
| DDB1 | SNV | Missense_Mutation | | c.1963N>T | p.Arg655Cys | p.R655C | Q16531 | protein_coding | deleterious(0) | probably_damaging(0.999) | TCGA-BH-A18G-01 | Breast | breast invasive carcinoma | Female | >=65 | I/II | Unknown | Unknown | SD |
| DDB1 | SNV | Missense_Mutation | | c.2722A>C | p.Asn908His | p.N908H | Q16531 | protein_coding | tolerated(0.62) | benign(0.047) | TCGA-E9-A22G-01 | Breast | breast invasive carcinoma | Female | <65 | I/II | Chemotherapy | doxorubicin | SD |
| DDB1 | insertion | Frame_Shift_Ins | rs757472327 | c.685_686insG | p.Ala229GlyfsTer15 | p.A229Gfs*15 | Q16531 | protein_coding | | | TCGA-AN-A04C-01 | Breast | breast invasive carcinoma | Female | <65 | I/II | Unknown | Unknown | SD |
| DDB1 | insertion | Frame_Shift_Ins | rs757472327 | c.685_686insG | p.Ala229GlyfsTer15 | p.A229Gfs*15 | Q16531 | protein_coding | | | TCGA-AN-A0FY-01 | Breast | breast invasive carcinoma | Female | <65 | I/II | Unknown | Unknown | SD |
| DDB1 | insertion | Frame_Shift_Ins | rs757472327 | c.685dupG | p.Ala229GlyfsTer15 | p.A229Gfs*15 | Q16531 | protein_coding | | | TCGA-AR-A0TY-01 | Breast | breast invasive carcinoma | Female | <65 | I/II | Unspecific | Paclitaxel | PD |


