
|
|||||
|
 | |
| |
| |
| |
| |
| |
|
Gene: DDAH2 |
Gene summary for DDAH2 |
| Gene information | Species | Human | Gene symbol | DDAH2 | Gene ID | 23564 |
| Gene name | dimethylarginine dimethylaminohydrolase 2 | |
| Gene Alias | DDAH | |
| Cytomap | 6p21.33 | |
| Gene Type | protein-coding | GO ID | GO:0000052 | UniProtAcc | O95865 |
Top |
Malignant transformation analysis |
| Identification of the aberrant gene expression in precancerous and cancerous lesions by comparing the gene expression of stem-like cells in diseased tissues with normal stem cells |
| Entrez ID | Symbol | Replicates | Species | Organ | Tissue | Adj P-value | Log2FC | Malignancy |
| 23564 | DDAH2 | HTA11_3410_2000001011 | Human | Colorectum | AD | 4.64e-04 | 2.11e-01 | 0.0155 |
| 23564 | DDAH2 | HTA11_2487_2000001011 | Human | Colorectum | SER | 2.44e-11 | 5.87e-01 | -0.1808 |
| 23564 | DDAH2 | HTA11_1938_2000001011 | Human | Colorectum | AD | 1.24e-09 | 4.07e-01 | -0.0811 |
| 23564 | DDAH2 | HTA11_78_2000001011 | Human | Colorectum | AD | 1.28e-06 | 2.09e-01 | -0.1088 |
| 23564 | DDAH2 | HTA11_347_2000001011 | Human | Colorectum | AD | 3.13e-23 | 5.98e-01 | -0.1954 |
| 23564 | DDAH2 | HTA11_411_2000001011 | Human | Colorectum | SER | 5.97e-05 | 6.36e-01 | -0.2602 |
| 23564 | DDAH2 | HTA11_2112_2000001011 | Human | Colorectum | SER | 1.96e-06 | 7.43e-01 | -0.2196 |
| 23564 | DDAH2 | HTA11_3361_2000001011 | Human | Colorectum | AD | 2.85e-13 | 7.11e-01 | -0.1207 |
| 23564 | DDAH2 | HTA11_83_2000001011 | Human | Colorectum | SER | 5.87e-04 | 3.17e-01 | -0.1526 |
| 23564 | DDAH2 | HTA11_696_2000001011 | Human | Colorectum | AD | 6.47e-26 | 6.07e-01 | -0.1464 |
| 23564 | DDAH2 | HTA11_866_2000001011 | Human | Colorectum | AD | 1.79e-13 | 3.82e-01 | -0.1001 |
| 23564 | DDAH2 | HTA11_1391_2000001011 | Human | Colorectum | AD | 4.10e-15 | 4.95e-01 | -0.059 |
| 23564 | DDAH2 | HTA11_2992_2000001011 | Human | Colorectum | SER | 1.93e-04 | 5.12e-01 | -0.1706 |
| 23564 | DDAH2 | HTA11_5212_2000001011 | Human | Colorectum | AD | 4.58e-11 | 7.68e-01 | -0.2061 |
| 23564 | DDAH2 | HTA11_5216_2000001011 | Human | Colorectum | SER | 5.96e-04 | 6.83e-01 | -0.1462 |
| 23564 | DDAH2 | HTA11_546_2000001011 | Human | Colorectum | AD | 2.22e-04 | 3.34e-01 | -0.0842 |
| 23564 | DDAH2 | HTA11_7862_2000001011 | Human | Colorectum | AD | 2.10e-02 | 2.34e-01 | -0.0179 |
| 23564 | DDAH2 | HTA11_866_3004761011 | Human | Colorectum | AD | 2.20e-25 | 7.14e-01 | 0.096 |
| 23564 | DDAH2 | HTA11_9408_2000001011 | Human | Colorectum | AD | 9.90e-03 | 4.44e-01 | 0.0451 |
| 23564 | DDAH2 | HTA11_8622_2000001021 | Human | Colorectum | SER | 4.98e-02 | 3.67e-01 | 0.0528 |
| Page: 1 2 3 4 5 6 7 8 9 |
| Tissue | Expression Dynamics | Abbreviation |
| Colorectum (GSE201348) | 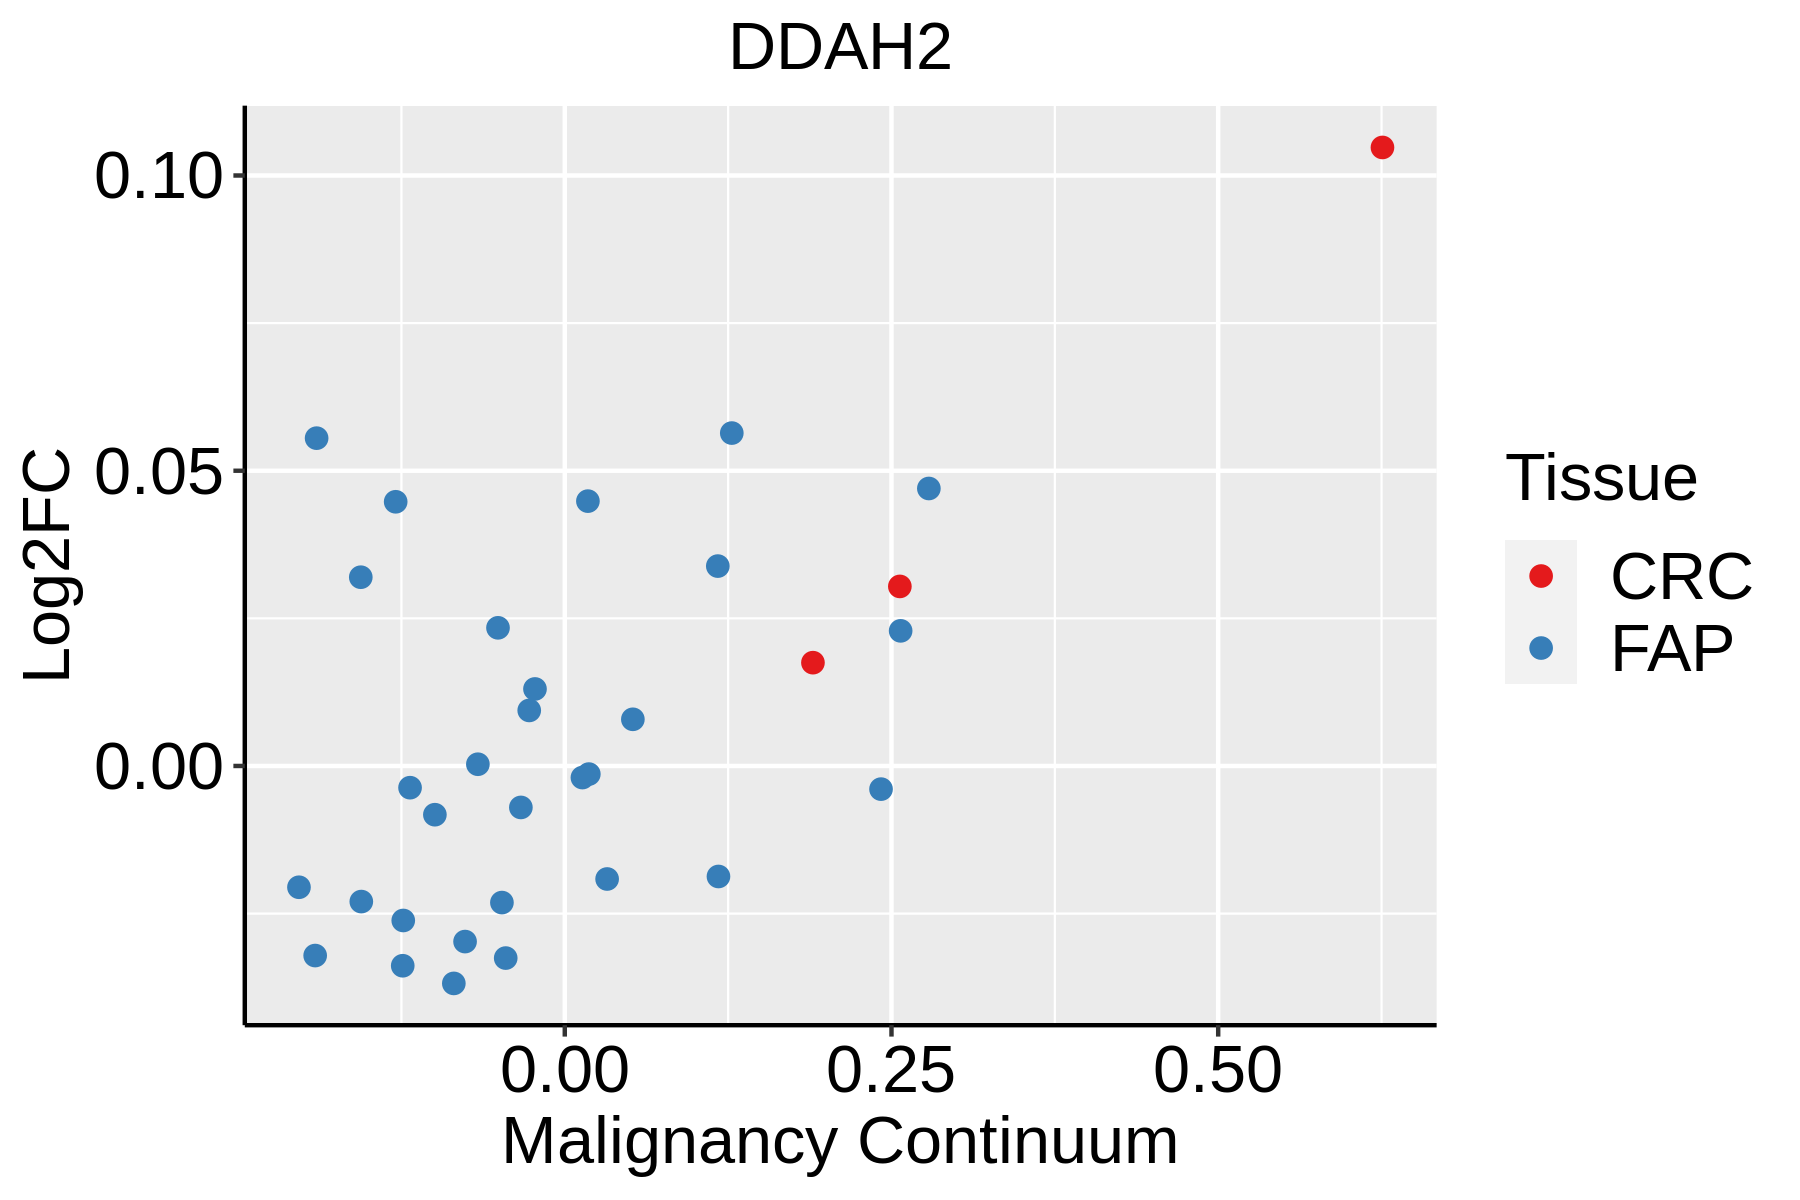 | FAP: Familial adenomatous polyposis |
| CRC: Colorectal cancer | ||
| Colorectum (HTA11) |  | AD: Adenomas |
| SER: Sessile serrated lesions | ||
| MSI-H: Microsatellite-high colorectal cancer | ||
| MSS: Microsatellite stable colorectal cancer | ||
| Endometrium | 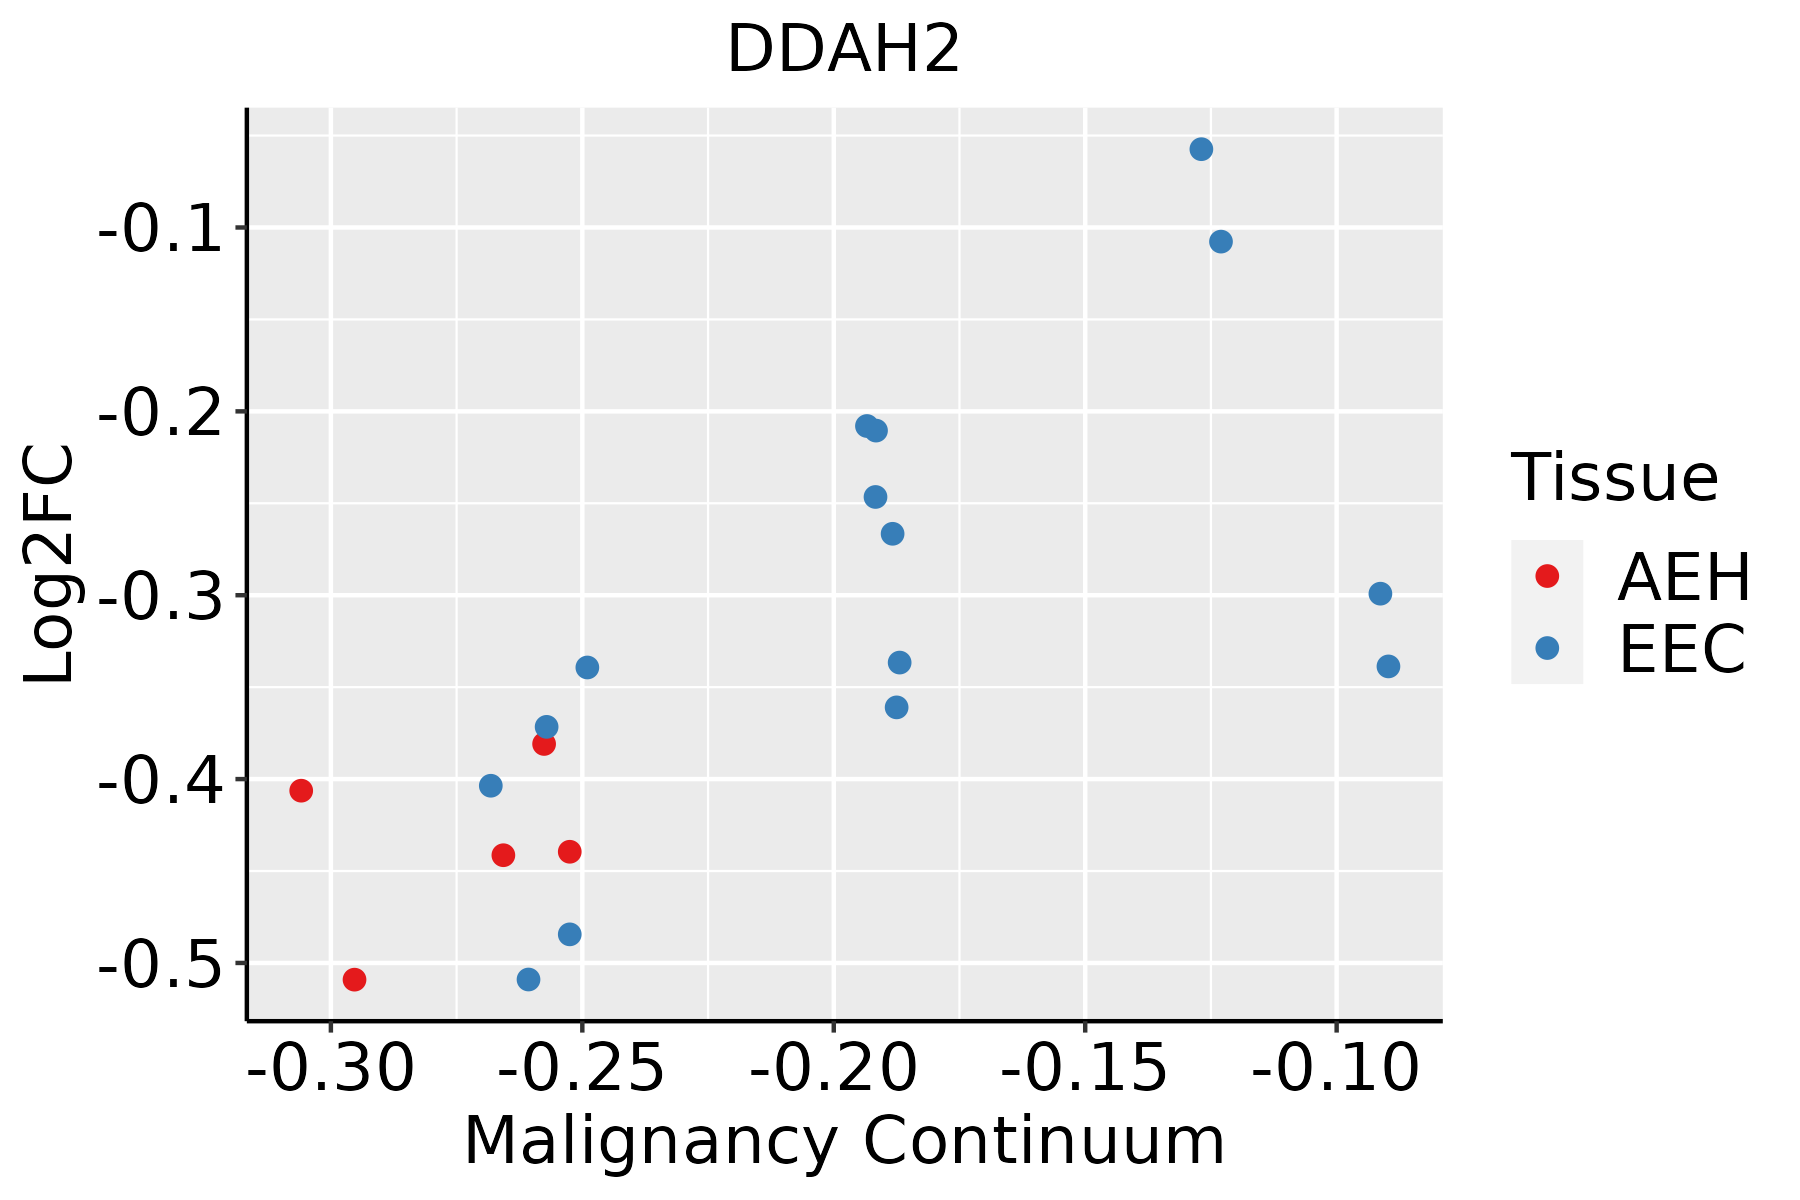 | AEH: Atypical endometrial hyperplasia |
| EEC: Endometrioid Cancer | ||
| Esophagus |  | ESCC: Esophageal squamous cell carcinoma |
| HGIN: High-grade intraepithelial neoplasias | ||
| LGIN: Low-grade intraepithelial neoplasias | ||
| Liver |  | HCC: Hepatocellular carcinoma |
| NAFLD: Non-alcoholic fatty liver disease | ||
| Oral Cavity | 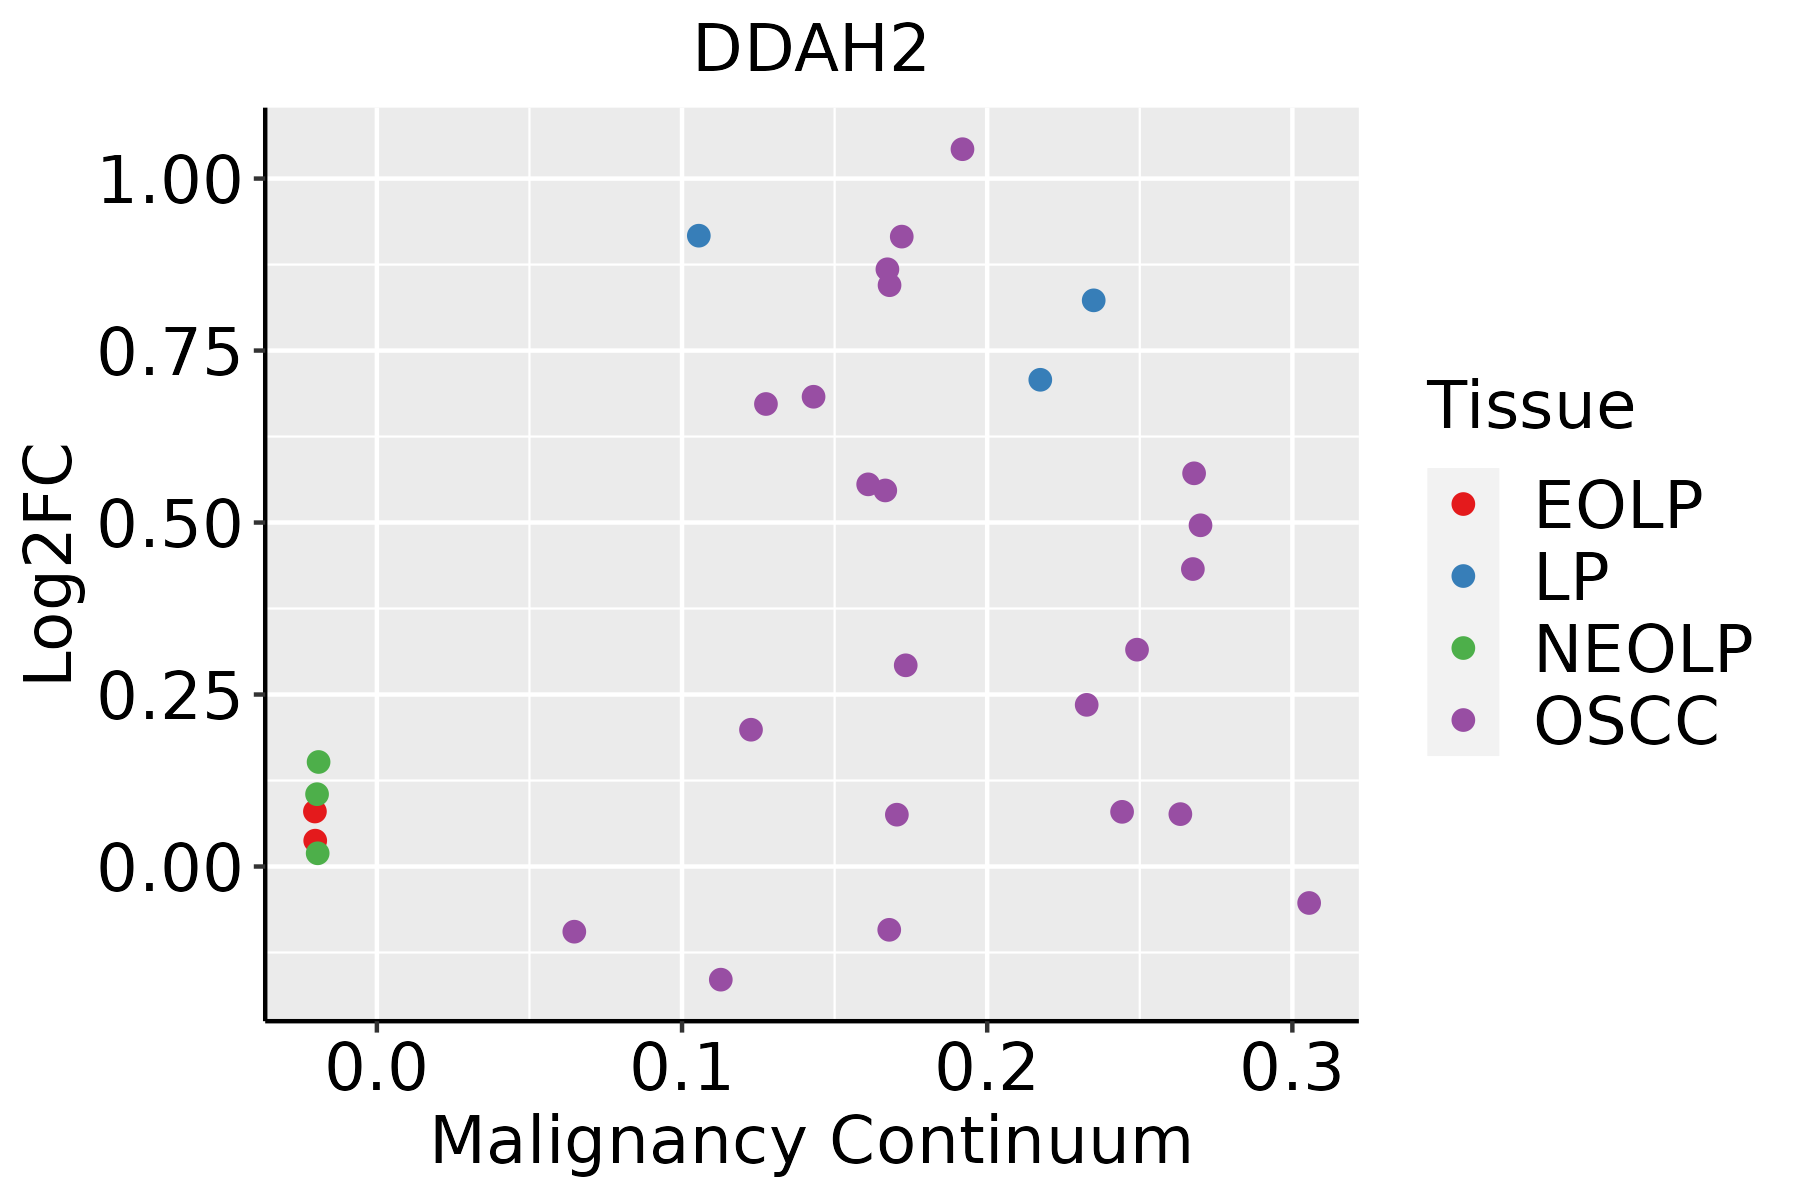 | EOLP: Erosive Oral lichen planus |
| LP: leukoplakia | ||
| NEOLP: Non-erosive oral lichen planus | ||
| OSCC: Oral squamous cell carcinoma | ||
| Skin | 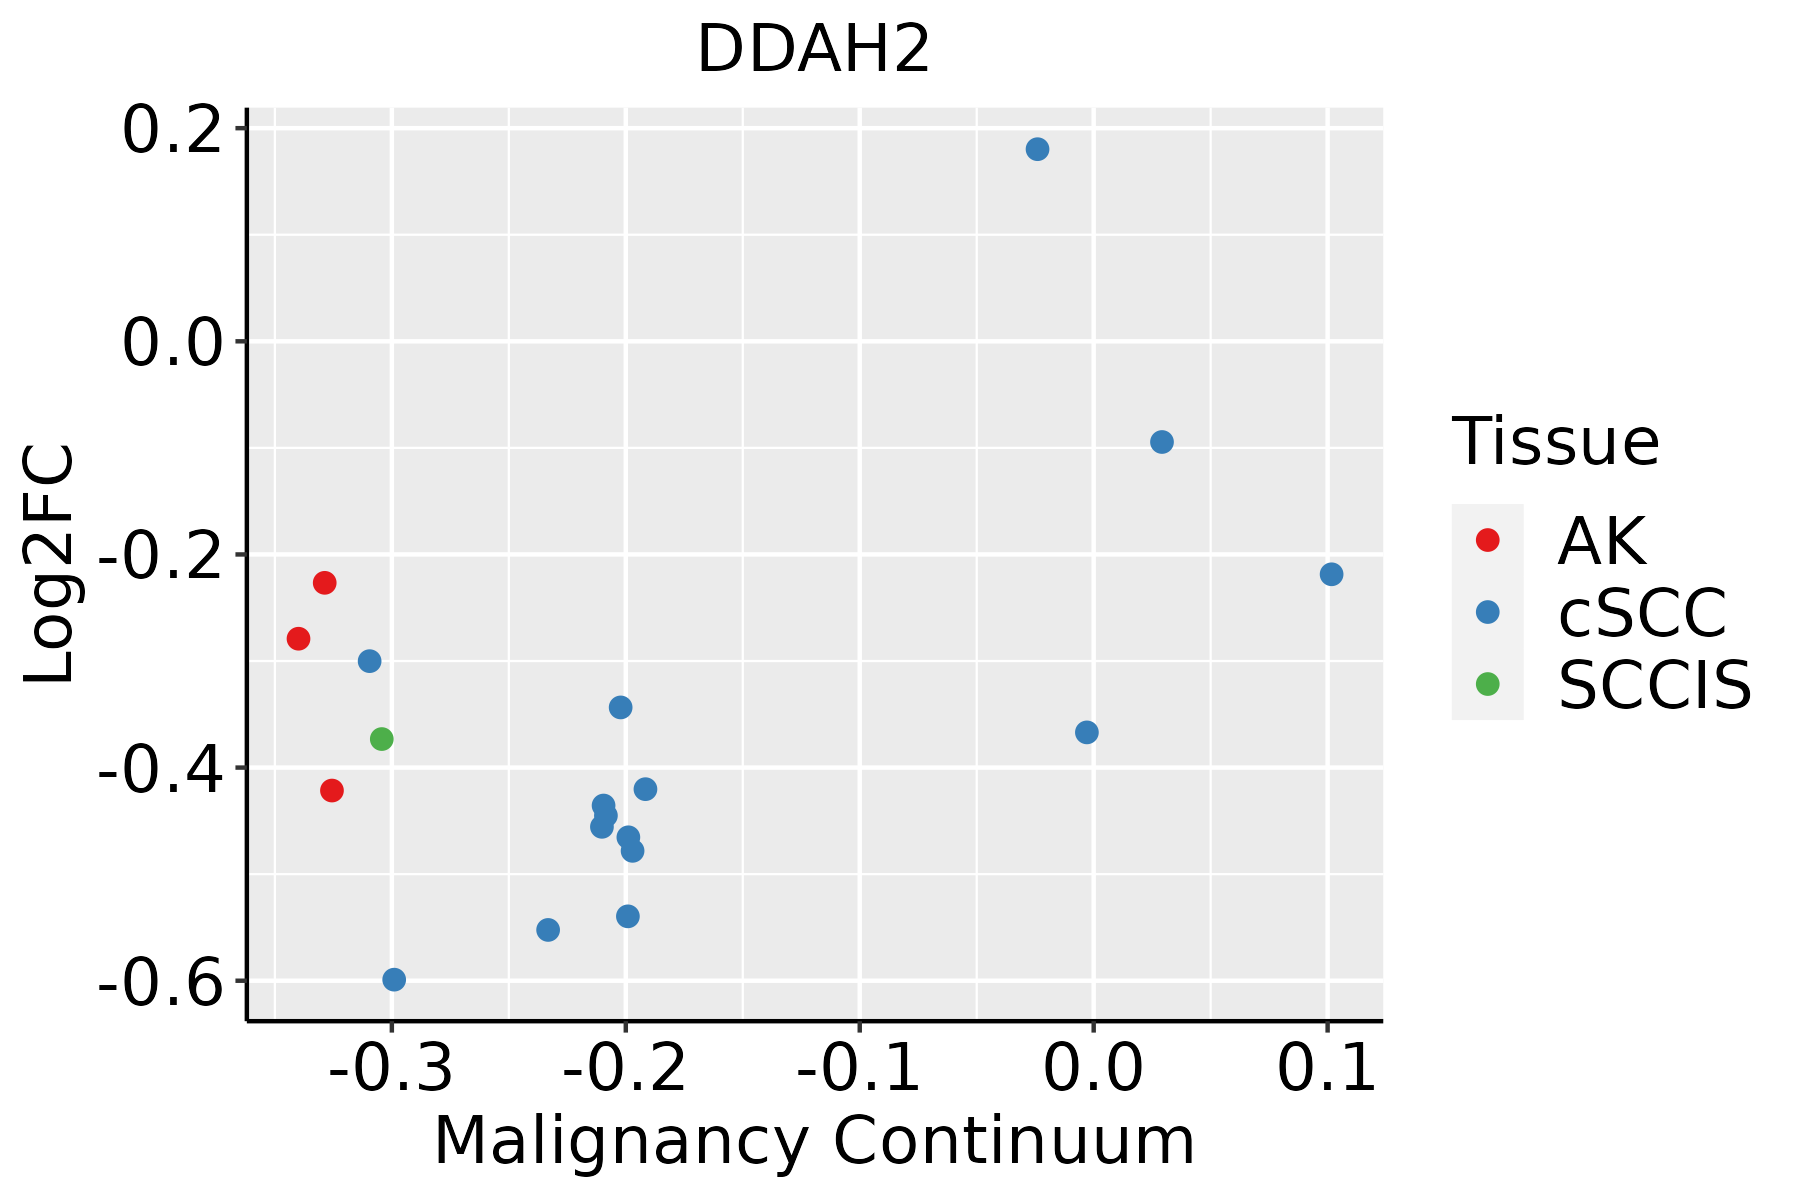 | AK: Actinic keratosis |
| cSCC: Cutaneous squamous cell carcinoma | ||
| SCCIS:squamous cell carcinoma in situ | ||
| Thyroid |  | ATC: Anaplastic thyroid cancer |
| HT: Hashimoto's thyroiditis | ||
| PTC: Papillary thyroid cancer |
| ∗log2FC in expression of this searched gene in stem-like cells from each diseased tissue sample relative to stem-like cells in normal samples in each tissue plotted against the malignancy continuum. Samples are colored based on if they are from different disease stage. |
Top |
Malignant transformation related pathway analysis |
| Find out the enriched GO biological processes and KEGG pathways involved in transition from healthy to precancer to cancer |
| Tissue | Disease Stage | Enriched GO biological Processes |
| Colorectum | AD |  |
| Colorectum | SER |  |
| Colorectum | MSS |  |
| Colorectum | MSI-H |  |
| Colorectum | FAP |  |
| ∗Top 15 enriched GO BP terms are showed in the bar plot of each disease state in each tissue. Each row represents a significant GO biological process which is colored according to the -log10(p.adjust). |
| Page: 1 2 3 4 5 6 7 8 9 |
| GO ID | Tissue | Disease Stage | Description | Gene Ratio | Bg Ratio | pvalue | p.adjust | Count |
| GO:0044282 | Colorectum | AD | small molecule catabolic process | 118/3918 | 376/18723 | 1.05e-06 | 3.55e-05 | 118 |
| GO:0006809 | Colorectum | AD | nitric oxide biosynthetic process | 30/3918 | 76/18723 | 1.72e-04 | 2.33e-03 | 30 |
| GO:0046209 | Colorectum | AD | nitric oxide metabolic process | 31/3918 | 81/18723 | 2.61e-04 | 3.25e-03 | 31 |
| GO:0016054 | Colorectum | AD | organic acid catabolic process | 73/3918 | 240/18723 | 3.20e-04 | 3.81e-03 | 73 |
| GO:2001057 | Colorectum | AD | reactive nitrogen species metabolic process | 31/3918 | 82/18723 | 3.37e-04 | 3.94e-03 | 31 |
| GO:0046395 | Colorectum | AD | carboxylic acid catabolic process | 70/3918 | 236/18723 | 9.06e-04 | 8.71e-03 | 70 |
| GO:0006520 | Colorectum | AD | cellular amino acid metabolic process | 81/3918 | 284/18723 | 1.37e-03 | 1.19e-02 | 81 |
| GO:0045429 | Colorectum | AD | positive regulation of nitric oxide biosynthetic process | 17/3918 | 40/18723 | 1.66e-03 | 1.38e-02 | 17 |
| GO:1904407 | Colorectum | AD | positive regulation of nitric oxide metabolic process | 17/3918 | 41/18723 | 2.29e-03 | 1.79e-02 | 17 |
| GO:0080164 | Colorectum | AD | regulation of nitric oxide metabolic process | 23/3918 | 64/18723 | 3.99e-03 | 2.80e-02 | 23 |
| GO:0045428 | Colorectum | AD | regulation of nitric oxide biosynthetic process | 22/3918 | 62/18723 | 5.72e-03 | 3.64e-02 | 22 |
| GO:00068091 | Colorectum | SER | nitric oxide biosynthetic process | 27/2897 | 76/18723 | 1.38e-05 | 4.28e-04 | 27 |
| GO:00462091 | Colorectum | SER | nitric oxide metabolic process | 28/2897 | 81/18723 | 1.73e-05 | 5.15e-04 | 28 |
| GO:20010571 | Colorectum | SER | reactive nitrogen species metabolic process | 28/2897 | 82/18723 | 2.24e-05 | 6.43e-04 | 28 |
| GO:00442821 | Colorectum | SER | small molecule catabolic process | 87/2897 | 376/18723 | 5.31e-05 | 1.27e-03 | 87 |
| GO:00801641 | Colorectum | SER | regulation of nitric oxide metabolic process | 21/2897 | 64/18723 | 4.26e-04 | 6.26e-03 | 21 |
| GO:00454291 | Colorectum | SER | positive regulation of nitric oxide biosynthetic process | 15/2897 | 40/18723 | 5.71e-04 | 7.86e-03 | 15 |
| GO:00454281 | Colorectum | SER | regulation of nitric oxide biosynthetic process | 20/2897 | 62/18723 | 7.41e-04 | 9.64e-03 | 20 |
| GO:19044071 | Colorectum | SER | positive regulation of nitric oxide metabolic process | 15/2897 | 41/18723 | 7.73e-04 | 9.84e-03 | 15 |
| GO:00160541 | Colorectum | SER | organic acid catabolic process | 53/2897 | 240/18723 | 4.04e-03 | 3.30e-02 | 53 |
| Page: 1 2 3 4 5 |
| Pathway ID | Tissue | Disease Stage | Description | Gene Ratio | Bg Ratio | pvalue | p.adjust | qvalue | Count |
| Page: 1 |
Top |
Cell-cell communication analysis |
| Identification of potential cell-cell interactions between two cell types and their ligand-receptor pairs for different disease states |
| Ligand | Receptor | LRpair | Pathway | Tissue | Disease Stage |
| Page: 1 |
Top |
Single-cell gene regulatory network inference analysis |
| Find out the significant the regulons (TFs) and the target genes of each regulon across cell types for different disease states |
| TF | Cell Type | Tissue | Disease Stage | Target Gene | RSS | Regulon Activity |
| ∗The dot plots of a searched regulon are shown for all cell subpopulations in each disease state of each tissue based on the regulon specific score inferred using pySCENIC and by calculating the average expression. |
| Page: 1 |
Top |
Somatic mutation of malignant transformation related genes |
| Annotation of somatic variants for genes involved in malignant transformation |
| Hugo Symbol | Variant Class | Variant Classification | dbSNP RS | HGVSc | HGVSp | HGVSp Short | SWISSPROT | BIOTYPE | SIFT | PolyPhen | Tumor Sample Barcode | Tissue | Histology | Sex | Age | Stage | Therapy Types | Drugs | Outcome |
| DDAH2 | SNV | Missense_Mutation | novel | c.368C>T | p.Thr123Met | p.T123M | O95865 | protein_coding | deleterious(0.03) | probably_damaging(0.998) | TCGA-VS-A9UC-01 | Cervix | cervical & endocervical cancer | Female | <65 | I/II | Chemotherapy | cisplatin | SD |
| DDAH2 | SNV | Missense_Mutation | c.713N>T | p.Gly238Val | p.G238V | O95865 | protein_coding | tolerated(0.08) | benign(0.246) | TCGA-A6-2686-01 | Colorectum | colon adenocarcinoma | Female | >=65 | I/II | Unknown | Unknown | SD | |
| DDAH2 | SNV | Missense_Mutation | c.568N>A | p.Asp190Asn | p.D190N | O95865 | protein_coding | tolerated(0.05) | benign(0.113) | TCGA-AZ-4313-01 | Colorectum | colon adenocarcinoma | Female | <65 | I/II | Unknown | Unknown | SD | |
| DDAH2 | SNV | Missense_Mutation | novel | c.809N>T | p.Ala270Val | p.A270V | O95865 | protein_coding | deleterious(0.01) | possibly_damaging(0.816) | TCGA-G4-6302-01 | Colorectum | colon adenocarcinoma | Female | >=65 | I/II | Unknown | Unknown | SD |
| DDAH2 | SNV | Missense_Mutation | c.544N>T | p.Arg182Cys | p.R182C | O95865 | protein_coding | deleterious(0.01) | possibly_damaging(0.76) | TCGA-A5-A0G2-01 | Endometrium | uterine corpus endometrioid carcinoma | Female | <65 | III/IV | Unknown | Unknown | SD | |
| DDAH2 | SNV | Missense_Mutation | novel | c.412N>A | p.Val138Ile | p.V138I | O95865 | protein_coding | deleterious(0.04) | probably_damaging(0.944) | TCGA-A5-A0G2-01 | Endometrium | uterine corpus endometrioid carcinoma | Female | <65 | III/IV | Unknown | Unknown | SD |
| DDAH2 | SNV | Missense_Mutation | novel | c.757N>G | p.Ser253Ala | p.S253A | O95865 | protein_coding | tolerated(0.78) | benign(0) | TCGA-A5-A1OF-01 | Endometrium | uterine corpus endometrioid carcinoma | Female | <65 | I/II | Unknown | Unknown | SD |
| DDAH2 | SNV | Missense_Mutation | rs150096378 | c.844N>T | p.Arg282Cys | p.R282C | O95865 | protein_coding | deleterious(0) | benign(0.136) | TCGA-A5-A2K3-01 | Endometrium | uterine corpus endometrioid carcinoma | Female | >=65 | I/II | Chemotherapy | carboplatin | SD |
| DDAH2 | SNV | Missense_Mutation | rs760623483 | c.808N>A | p.Ala270Thr | p.A270T | O95865 | protein_coding | deleterious(0.01) | possibly_damaging(0.761) | TCGA-AX-A06F-01 | Endometrium | uterine corpus endometrioid carcinoma | Female | <65 | III/IV | Chemotherapy | carboplatin | SD |
| DDAH2 | SNV | Missense_Mutation | novel | c.566G>A | p.Ser189Asn | p.S189N | O95865 | protein_coding | deleterious(0.01) | benign(0.339) | TCGA-B5-A3FA-01 | Endometrium | uterine corpus endometrioid carcinoma | Female | >=65 | I/II | Unknown | Unknown | SD |
| Page: 1 2 3 |
Top |
Related drugs of malignant transformation related genes |
| Identification of chemicals and drugs interact with genes involved in malignant transfromation |
| (DGIdb 4.0) |
| Entrez ID | Symbol | Category | Interaction Types | Drug Claim Name | Drug Name | PMIDs |
| Page: 1 |

Copyright 2023-Present -The University of Texas Health Science Center at Houston |