
|
|||||
|
 | |
| |
| |
| |
| |
| |
|
Gene: DDAH1 |
Gene summary for DDAH1 |
| Gene information | Species | Human | Gene symbol | DDAH1 | Gene ID | 23576 |
| Gene name | dimethylarginine dimethylaminohydrolase 1 | |
| Gene Alias | DDAH | |
| Cytomap | 1p22.3 | |
| Gene Type | protein-coding | GO ID | GO:0000052 | UniProtAcc | B4E3V1 |
Top |
Malignant transformation analysis |
| Identification of the aberrant gene expression in precancerous and cancerous lesions by comparing the gene expression of stem-like cells in diseased tissues with normal stem cells |
| Entrez ID | Symbol | Replicates | Species | Organ | Tissue | Adj P-value | Log2FC | Malignancy |
| 23576 | DDAH1 | HTA11_3410_2000001011 | Human | Colorectum | AD | 1.22e-29 | -8.09e-01 | 0.0155 |
| 23576 | DDAH1 | HTA11_2487_2000001011 | Human | Colorectum | SER | 4.72e-08 | -6.24e-01 | -0.1808 |
| 23576 | DDAH1 | HTA11_2951_2000001011 | Human | Colorectum | AD | 8.05e-05 | -8.65e-01 | 0.0216 |
| 23576 | DDAH1 | HTA11_1938_2000001011 | Human | Colorectum | AD | 3.32e-06 | -5.71e-01 | -0.0811 |
| 23576 | DDAH1 | HTA11_347_2000001011 | Human | Colorectum | AD | 1.30e-05 | -3.89e-01 | -0.1954 |
| 23576 | DDAH1 | HTA11_2112_2000001011 | Human | Colorectum | SER | 4.85e-02 | -7.54e-01 | -0.2196 |
| 23576 | DDAH1 | HTA11_3361_2000001011 | Human | Colorectum | AD | 1.12e-12 | -7.86e-01 | -0.1207 |
| 23576 | DDAH1 | HTA11_83_2000001011 | Human | Colorectum | SER | 1.65e-06 | -6.87e-01 | -0.1526 |
| 23576 | DDAH1 | HTA11_696_2000001011 | Human | Colorectum | AD | 6.98e-27 | -7.04e-01 | -0.1464 |
| 23576 | DDAH1 | HTA11_866_2000001011 | Human | Colorectum | AD | 4.52e-21 | -7.31e-01 | -0.1001 |
| 23576 | DDAH1 | HTA11_1391_2000001011 | Human | Colorectum | AD | 7.03e-14 | -6.17e-01 | -0.059 |
| 23576 | DDAH1 | HTA11_546_2000001011 | Human | Colorectum | AD | 4.23e-06 | -6.28e-01 | -0.0842 |
| 23576 | DDAH1 | HTA11_9341_2000001011 | Human | Colorectum | SER | 2.59e-02 | -8.42e-01 | -0.00410000000000005 |
| 23576 | DDAH1 | HTA11_7862_2000001011 | Human | Colorectum | AD | 1.26e-02 | -5.60e-01 | -0.0179 |
| 23576 | DDAH1 | HTA11_866_3004761011 | Human | Colorectum | AD | 3.50e-14 | -6.39e-01 | 0.096 |
| 23576 | DDAH1 | HTA11_4255_2000001011 | Human | Colorectum | SER | 8.00e-03 | -7.70e-01 | 0.0446 |
| 23576 | DDAH1 | HTA11_9408_2000001011 | Human | Colorectum | AD | 1.95e-02 | -8.10e-01 | 0.0451 |
| 23576 | DDAH1 | HTA11_8622_2000001021 | Human | Colorectum | SER | 2.24e-05 | -7.70e-01 | 0.0528 |
| 23576 | DDAH1 | HTA11_10623_2000001011 | Human | Colorectum | AD | 4.22e-03 | -5.62e-01 | -0.0177 |
| 23576 | DDAH1 | HTA11_10711_2000001011 | Human | Colorectum | AD | 5.52e-12 | -7.21e-01 | 0.0338 |
| Page: 1 2 3 4 5 6 |
| Tissue | Expression Dynamics | Abbreviation |
| Colorectum (GSE201348) |  | FAP: Familial adenomatous polyposis |
| CRC: Colorectal cancer | ||
| Colorectum (HTA11) | 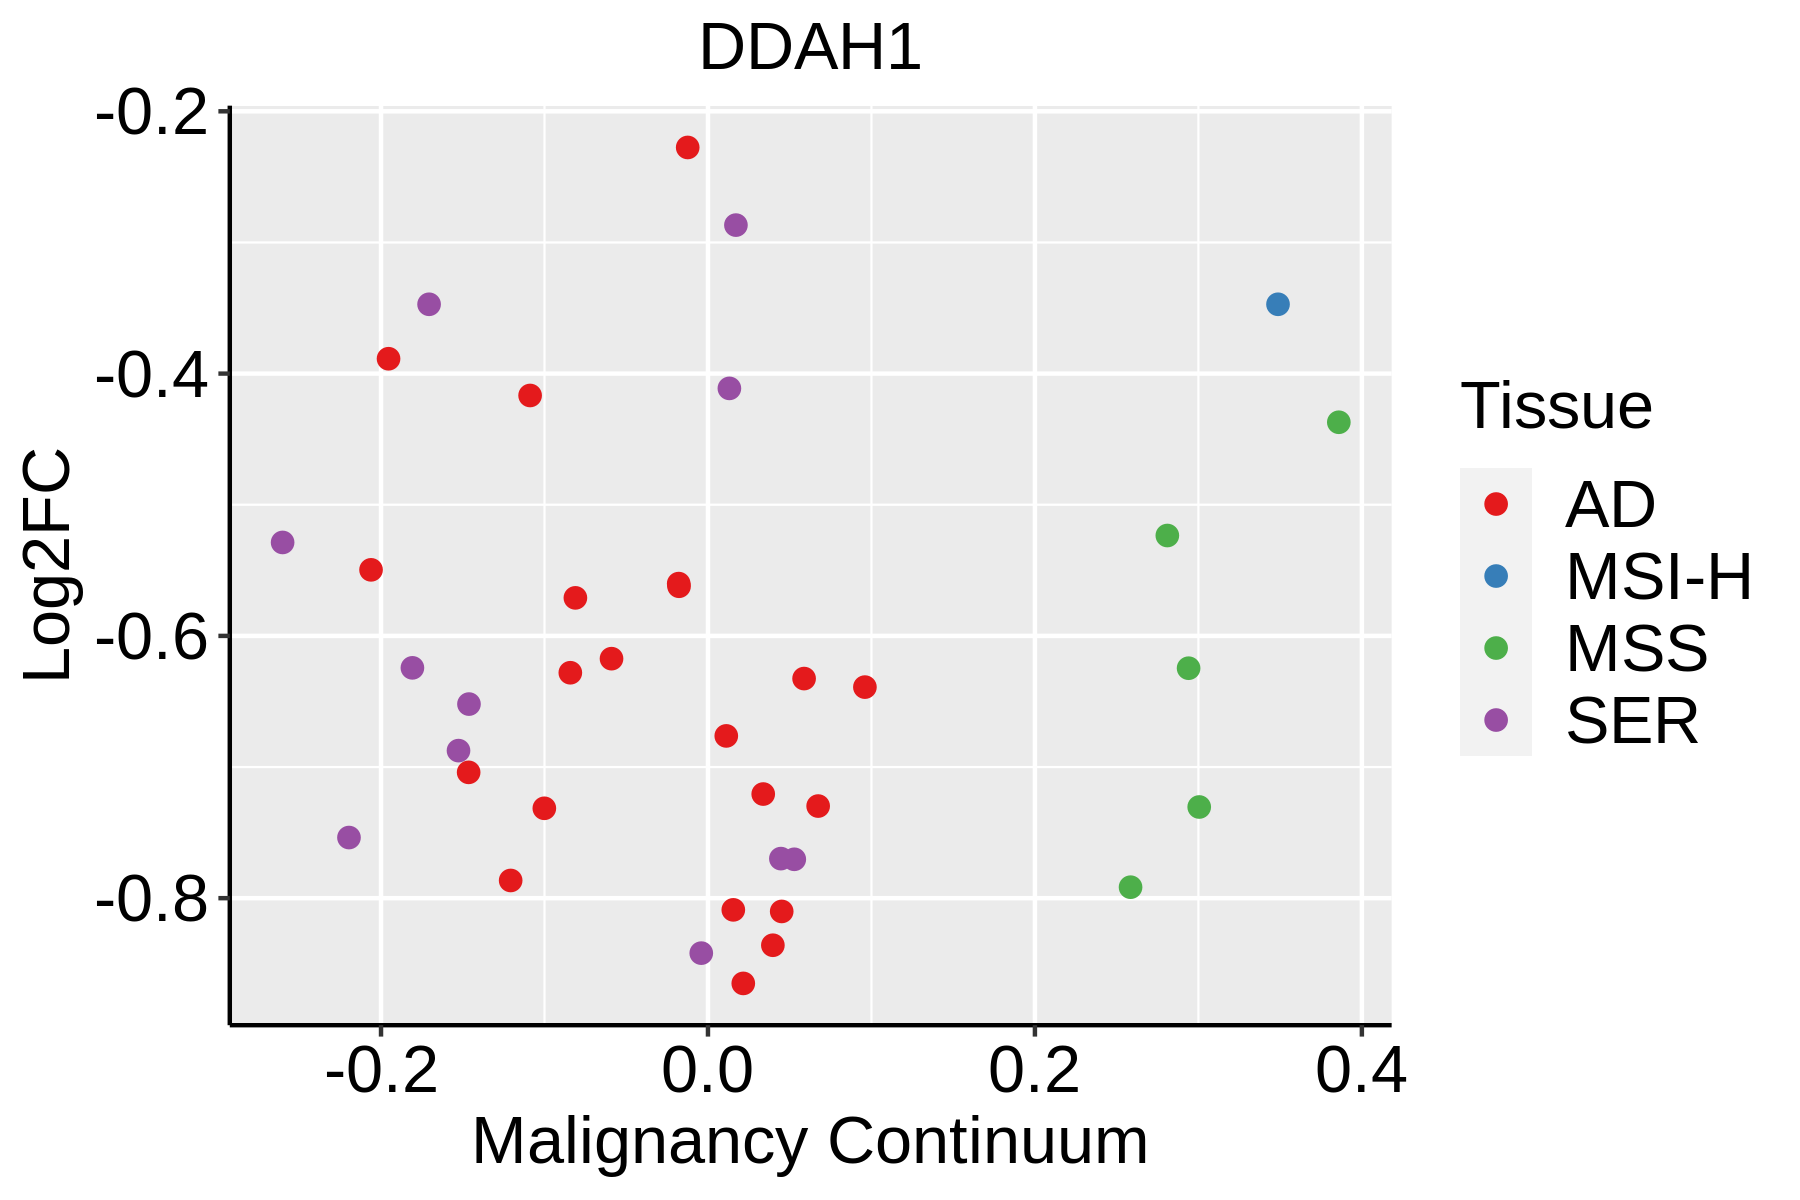 | AD: Adenomas |
| SER: Sessile serrated lesions | ||
| MSI-H: Microsatellite-high colorectal cancer | ||
| MSS: Microsatellite stable colorectal cancer | ||
| Liver |  | HCC: Hepatocellular carcinoma |
| NAFLD: Non-alcoholic fatty liver disease | ||
| Lung | 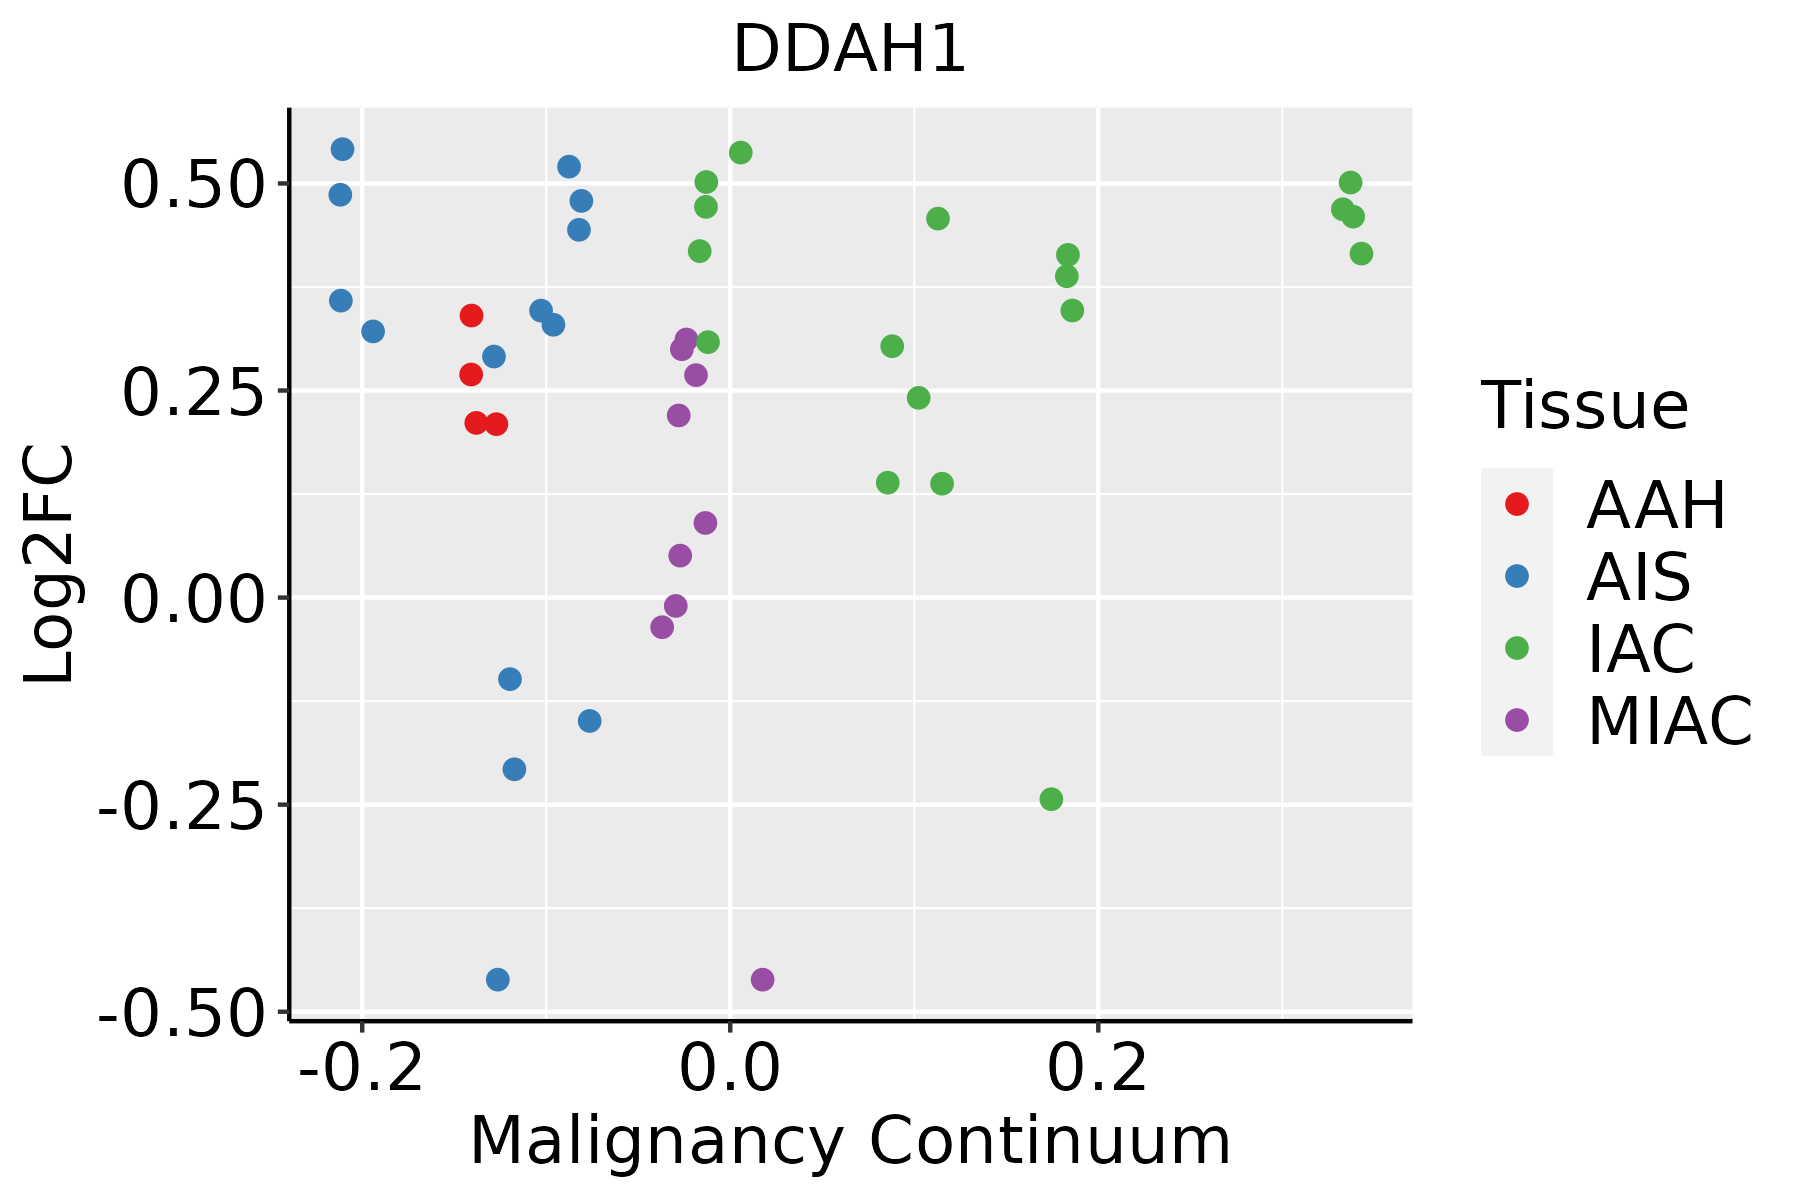 | AAH: Atypical adenomatous hyperplasia |
| AIS: Adenocarcinoma in situ | ||
| IAC: Invasive lung adenocarcinoma | ||
| MIA: Minimally invasive adenocarcinoma | ||
| Prostate | 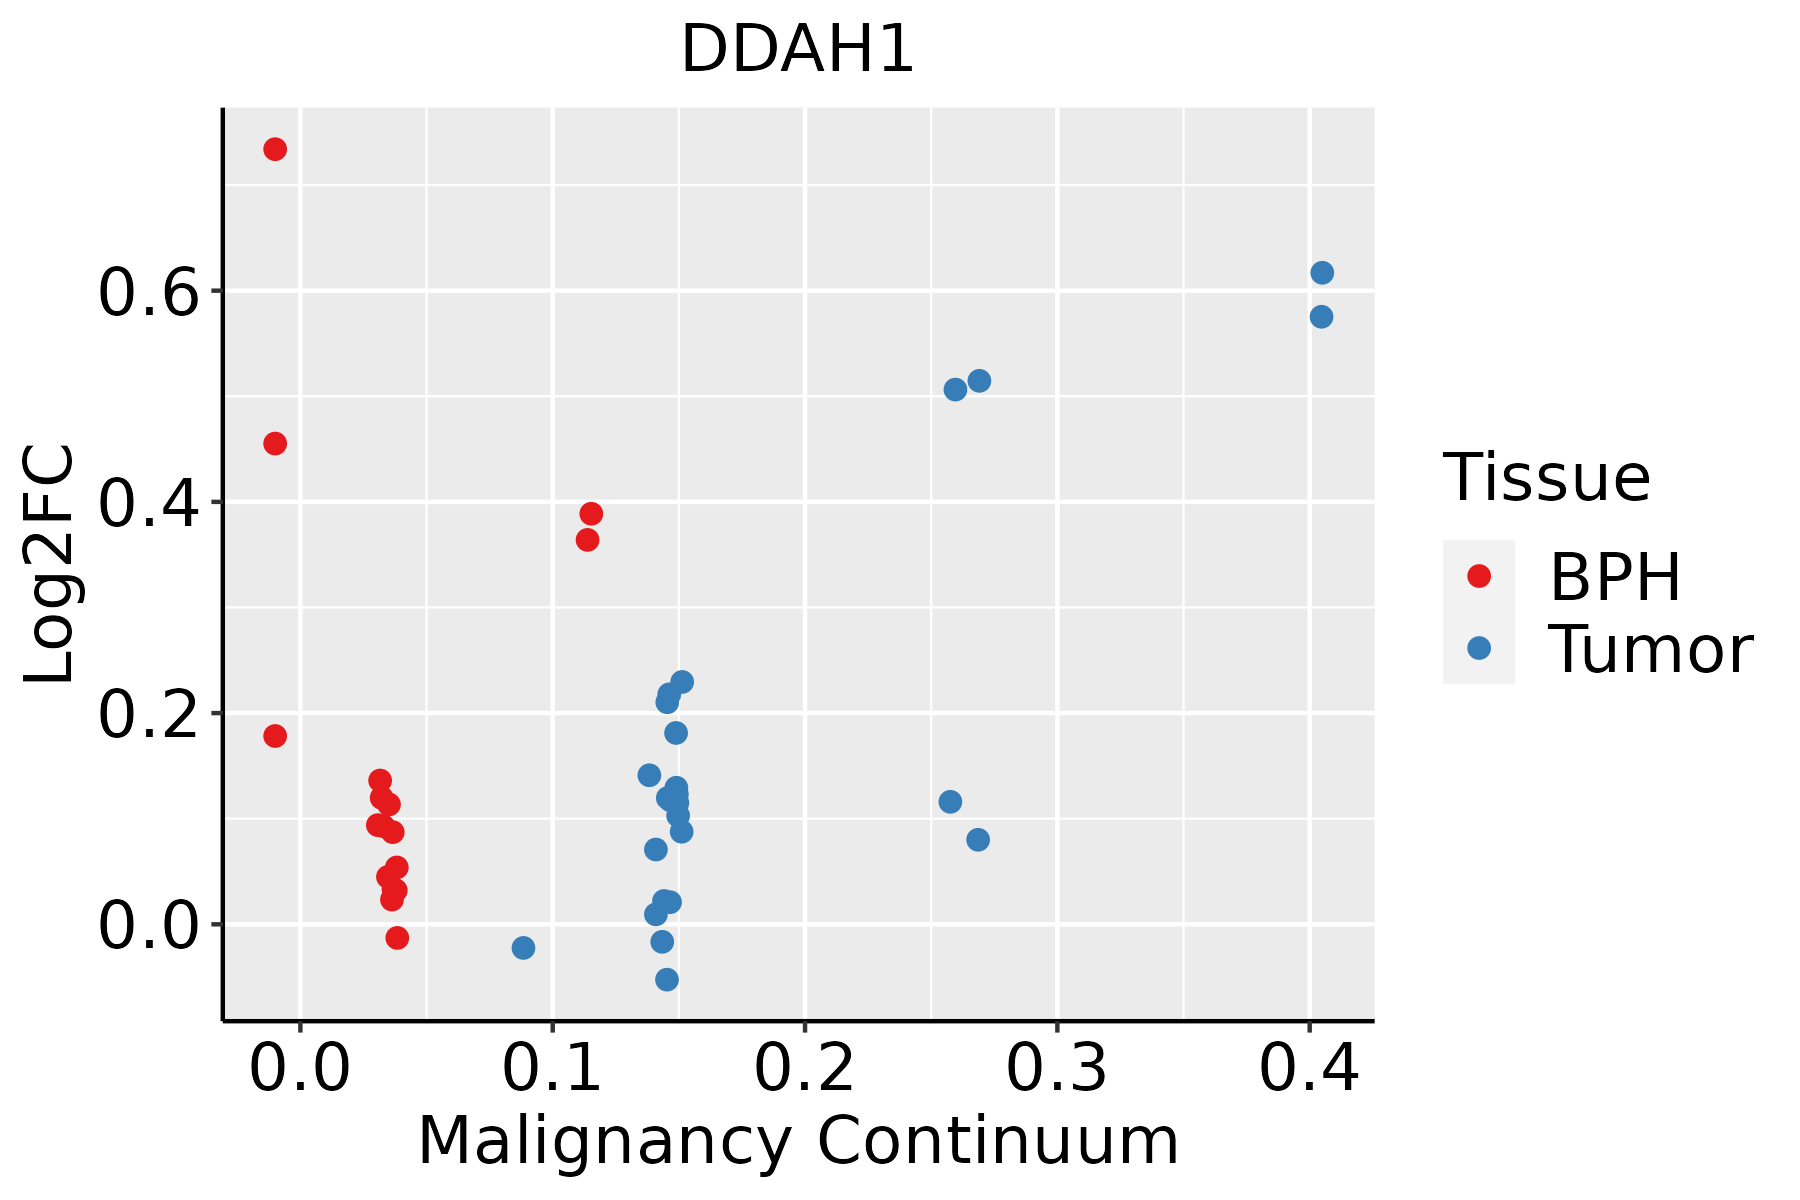 | BPH: Benign Prostatic Hyperplasia |
| Thyroid | 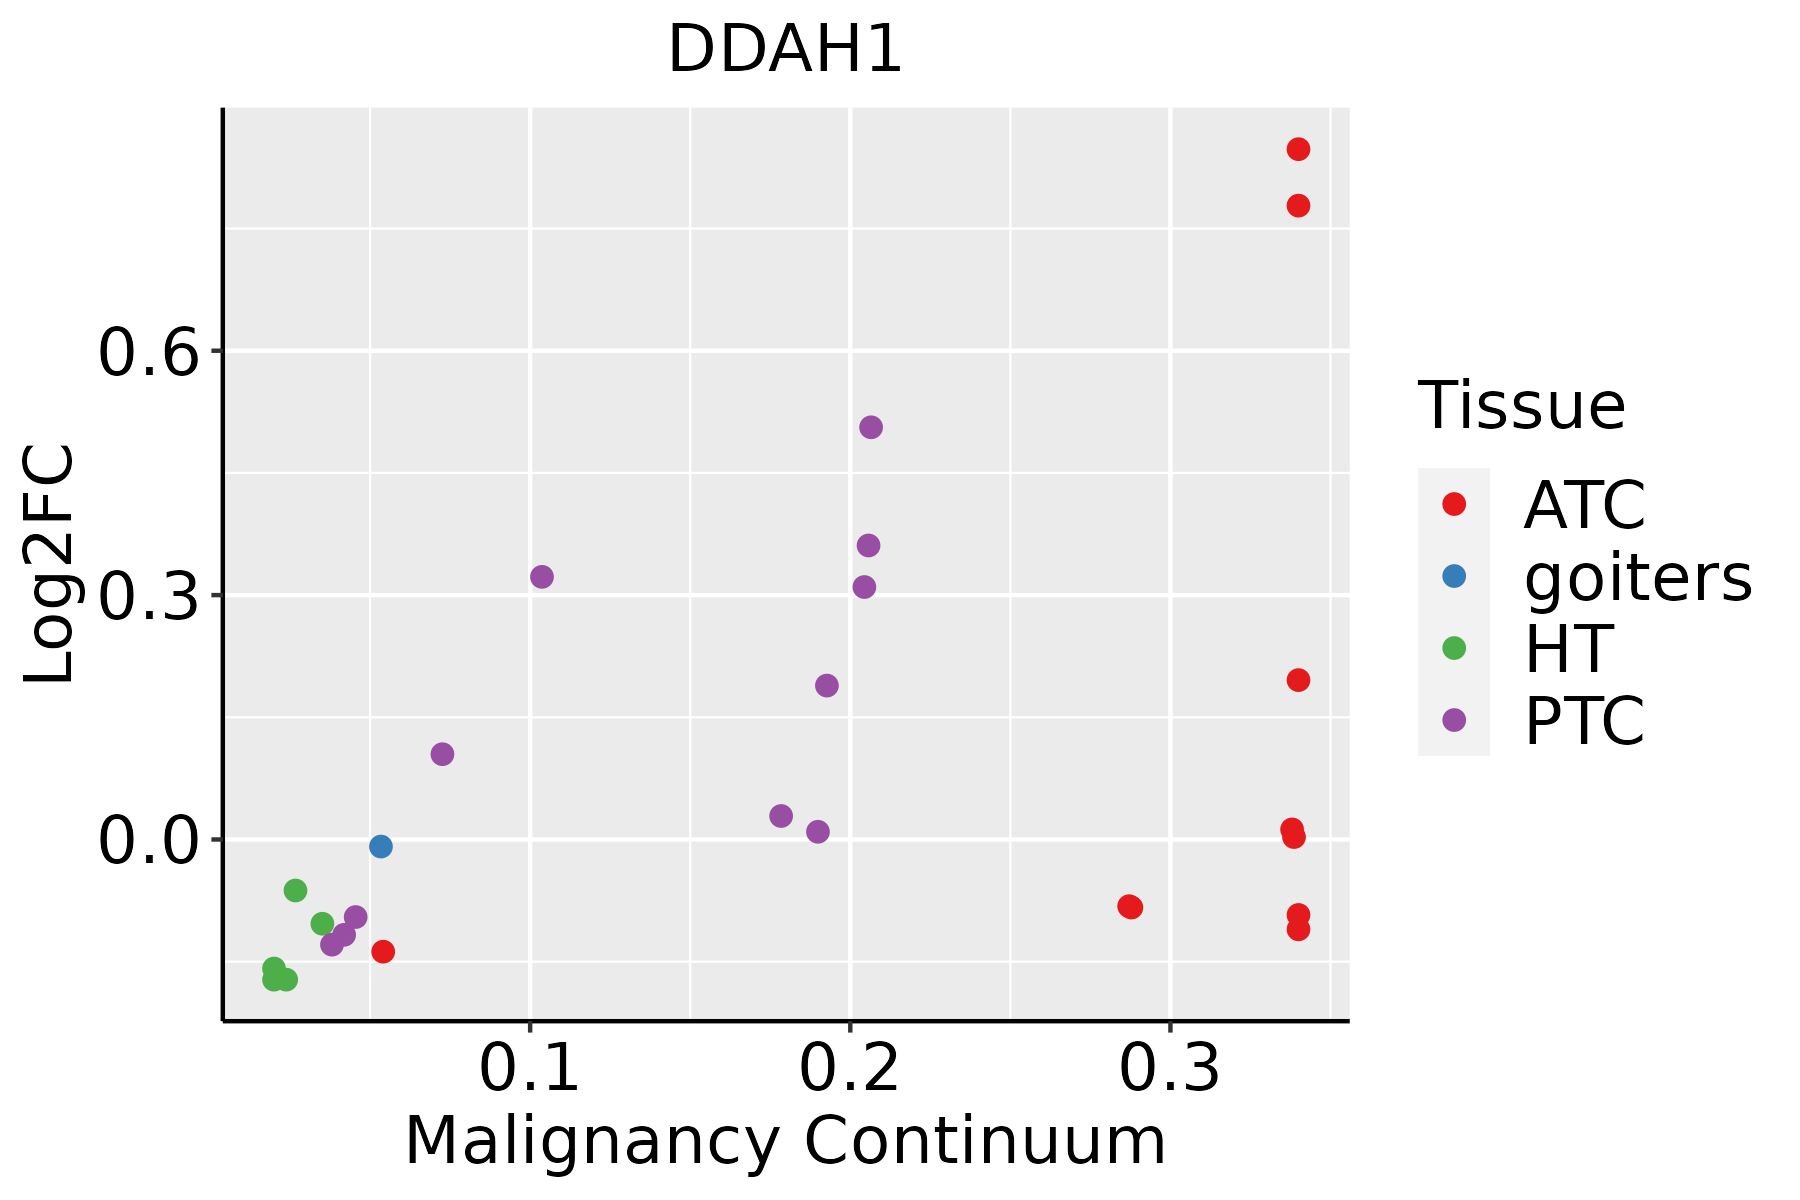 | ATC: Anaplastic thyroid cancer |
| HT: Hashimoto's thyroiditis | ||
| PTC: Papillary thyroid cancer |
| ∗log2FC in expression of this searched gene in stem-like cells from each diseased tissue sample relative to stem-like cells in normal samples in each tissue plotted against the malignancy continuum. Samples are colored based on if they are from different disease stage. |
Top |
Malignant transformation related pathway analysis |
| Find out the enriched GO biological processes and KEGG pathways involved in transition from healthy to precancer to cancer |
| Tissue | Disease Stage | Enriched GO biological Processes |
| Colorectum | AD |  |
| Colorectum | SER |  |
| Colorectum | MSS |  |
| Colorectum | MSI-H |  |
| Colorectum | FAP |  |
| ∗Top 15 enriched GO BP terms are showed in the bar plot of each disease state in each tissue. Each row represents a significant GO biological process which is colored according to the -log10(p.adjust). |
| Page: 1 2 3 4 5 6 7 8 9 |
| GO ID | Tissue | Disease Stage | Description | Gene Ratio | Bg Ratio | pvalue | p.adjust | Count |
| GO:0044282 | Colorectum | AD | small molecule catabolic process | 118/3918 | 376/18723 | 1.05e-06 | 3.55e-05 | 118 |
| GO:0006809 | Colorectum | AD | nitric oxide biosynthetic process | 30/3918 | 76/18723 | 1.72e-04 | 2.33e-03 | 30 |
| GO:0046209 | Colorectum | AD | nitric oxide metabolic process | 31/3918 | 81/18723 | 2.61e-04 | 3.25e-03 | 31 |
| GO:0016054 | Colorectum | AD | organic acid catabolic process | 73/3918 | 240/18723 | 3.20e-04 | 3.81e-03 | 73 |
| GO:2001057 | Colorectum | AD | reactive nitrogen species metabolic process | 31/3918 | 82/18723 | 3.37e-04 | 3.94e-03 | 31 |
| GO:0070482 | Colorectum | AD | response to oxygen levels | 99/3918 | 347/18723 | 4.29e-04 | 4.82e-03 | 99 |
| GO:0046395 | Colorectum | AD | carboxylic acid catabolic process | 70/3918 | 236/18723 | 9.06e-04 | 8.71e-03 | 70 |
| GO:0071453 | Colorectum | AD | cellular response to oxygen levels | 55/3918 | 177/18723 | 9.48e-04 | 8.96e-03 | 55 |
| GO:0006520 | Colorectum | AD | cellular amino acid metabolic process | 81/3918 | 284/18723 | 1.37e-03 | 1.19e-02 | 81 |
| GO:0045429 | Colorectum | AD | positive regulation of nitric oxide biosynthetic process | 17/3918 | 40/18723 | 1.66e-03 | 1.38e-02 | 17 |
| GO:0001666 | Colorectum | AD | response to hypoxia | 86/3918 | 307/18723 | 1.77e-03 | 1.46e-02 | 86 |
| GO:1904407 | Colorectum | AD | positive regulation of nitric oxide metabolic process | 17/3918 | 41/18723 | 2.29e-03 | 1.79e-02 | 17 |
| GO:0036293 | Colorectum | AD | response to decreased oxygen levels | 88/3918 | 322/18723 | 3.42e-03 | 2.49e-02 | 88 |
| GO:0080164 | Colorectum | AD | regulation of nitric oxide metabolic process | 23/3918 | 64/18723 | 3.99e-03 | 2.80e-02 | 23 |
| GO:0045428 | Colorectum | AD | regulation of nitric oxide biosynthetic process | 22/3918 | 62/18723 | 5.72e-03 | 3.64e-02 | 22 |
| GO:00068091 | Colorectum | SER | nitric oxide biosynthetic process | 27/2897 | 76/18723 | 1.38e-05 | 4.28e-04 | 27 |
| GO:00462091 | Colorectum | SER | nitric oxide metabolic process | 28/2897 | 81/18723 | 1.73e-05 | 5.15e-04 | 28 |
| GO:20010571 | Colorectum | SER | reactive nitrogen species metabolic process | 28/2897 | 82/18723 | 2.24e-05 | 6.43e-04 | 28 |
| GO:00442821 | Colorectum | SER | small molecule catabolic process | 87/2897 | 376/18723 | 5.31e-05 | 1.27e-03 | 87 |
| GO:00704821 | Colorectum | SER | response to oxygen levels | 79/2897 | 347/18723 | 1.99e-04 | 3.64e-03 | 79 |
| Page: 1 2 3 4 5 6 7 8 9 10 |
| Pathway ID | Tissue | Disease Stage | Description | Gene Ratio | Bg Ratio | pvalue | p.adjust | qvalue | Count |
| Page: 1 |
Top |
Cell-cell communication analysis |
| Identification of potential cell-cell interactions between two cell types and their ligand-receptor pairs for different disease states |
| Ligand | Receptor | LRpair | Pathway | Tissue | Disease Stage |
| Page: 1 |
Top |
Single-cell gene regulatory network inference analysis |
| Find out the significant the regulons (TFs) and the target genes of each regulon across cell types for different disease states |
| TF | Cell Type | Tissue | Disease Stage | Target Gene | RSS | Regulon Activity |
| ∗The dot plots of a searched regulon are shown for all cell subpopulations in each disease state of each tissue based on the regulon specific score inferred using pySCENIC and by calculating the average expression. |
| Page: 1 |
Top |
Somatic mutation of malignant transformation related genes |
| Annotation of somatic variants for genes involved in malignant transformation |
| Hugo Symbol | Variant Class | Variant Classification | dbSNP RS | HGVSc | HGVSp | HGVSp Short | SWISSPROT | BIOTYPE | SIFT | PolyPhen | Tumor Sample Barcode | Tissue | Histology | Sex | Age | Stage | Therapy Types | Drugs | Outcome |
| DDAH1 | SNV | Missense_Mutation | c.621N>A | p.His207Gln | p.H207Q | O94760 | protein_coding | deleterious(0.03) | benign(0.033) | TCGA-E2-A1BC-01 | Breast | breast invasive carcinoma | Female | <65 | I/II | Hormone Therapy | arimidex | SD | |
| DDAH1 | SNV | Missense_Mutation | rs770957315 | c.778N>A | p.Val260Met | p.V260M | O94760 | protein_coding | deleterious(0.03) | possibly_damaging(0.774) | TCGA-D5-6532-01 | Colorectum | colon adenocarcinoma | Male | <65 | I/II | Unknown | Unknown | SD |
| DDAH1 | SNV | Missense_Mutation | novel | c.658G>A | p.Ala220Thr | p.A220T | O94760 | protein_coding | tolerated(0.06) | possibly_damaging(0.89) | TCGA-AJ-A3NE-01 | Endometrium | uterine corpus endometrioid carcinoma | Female | <65 | I/II | Unknown | Unknown | SD |
| DDAH1 | SNV | Missense_Mutation | novel | c.540G>T | p.Met180Ile | p.M180I | O94760 | protein_coding | deleterious(0.04) | benign(0.255) | TCGA-AJ-A3NE-01 | Endometrium | uterine corpus endometrioid carcinoma | Female | <65 | I/II | Unknown | Unknown | SD |
| DDAH1 | SNV | Missense_Mutation | c.762C>A | p.Asp254Glu | p.D254E | O94760 | protein_coding | tolerated(0.16) | benign(0.001) | TCGA-AP-A051-01 | Endometrium | uterine corpus endometrioid carcinoma | Female | >=65 | I/II | Unknown | Unknown | SD | |
| DDAH1 | SNV | Missense_Mutation | c.340N>T | p.Leu114Phe | p.L114F | O94760 | protein_coding | deleterious(0.03) | benign(0.415) | TCGA-AP-A0LM-01 | Endometrium | uterine corpus endometrioid carcinoma | Female | <65 | III/IV | Chemotherapy | cisplatin | SD | |
| DDAH1 | SNV | Missense_Mutation | novel | c.404G>A | p.Gly135Asp | p.G135D | O94760 | protein_coding | deleterious(0) | possibly_damaging(0.68) | TCGA-AP-A1E0-01 | Endometrium | uterine corpus endometrioid carcinoma | Female | <65 | III/IV | Chemotherapy | paclitaxel | SD |
| DDAH1 | SNV | Missense_Mutation | rs202207743 | c.628N>A | p.Asp210Asn | p.D210N | O94760 | protein_coding | deleterious(0.02) | benign(0.007) | TCGA-AX-A05Y-01 | Endometrium | uterine corpus endometrioid carcinoma | Female | <65 | I/II | Unknown | Unknown | PD |
| DDAH1 | SNV | Missense_Mutation | rs377746010 | c.622C>T | p.Arg208Cys | p.R208C | O94760 | protein_coding | deleterious(0.05) | possibly_damaging(0.882) | TCGA-AX-A2HA-01 | Endometrium | uterine corpus endometrioid carcinoma | Female | <65 | I/II | Unknown | Unknown | SD |
| DDAH1 | SNV | Missense_Mutation | novel | c.365N>G | p.Glu122Gly | p.E122G | O94760 | protein_coding | deleterious(0.01) | benign(0.015) | TCGA-D1-A175-01 | Endometrium | uterine corpus endometrioid carcinoma | Female | <65 | I/II | Chemotherapy | paclitaxel | SD |
| Page: 1 2 |
Top |
Related drugs of malignant transformation related genes |
| Identification of chemicals and drugs interact with genes involved in malignant transfromation |
| (DGIdb 4.0) |
| Entrez ID | Symbol | Category | Interaction Types | Drug Claim Name | Drug Name | PMIDs |
| 23576 | DDAH1 | ENZYME | inhibitor | 252827487 | ||
| 23576 | DDAH1 | ENZYME | 2-ETHYL-BENZIMIDAZOLE | CHEMBL351569 | 22921743 |
| Page: 1 |

Copyright 2023-Present -The University of Texas Health Science Center at Houston |