
|
|||||
|
 | |
| |
| |
| |
| |
| |
|
Gene: DDA1 |
Gene summary for DDA1 |
| Gene information | Species | Human | Gene symbol | DDA1 | Gene ID | 79016 |
| Gene name | DET1 and DDB1 associated 1 | |
| Gene Alias | C19orf58 | |
| Cytomap | 19p13.11 | |
| Gene Type | protein-coding | GO ID | GO:0000209 | UniProtAcc | A0A024R7J7 |
Top |
Malignant transformation analysis |
| Identification of the aberrant gene expression in precancerous and cancerous lesions by comparing the gene expression of stem-like cells in diseased tissues with normal stem cells |
| Entrez ID | Symbol | Replicates | Species | Organ | Tissue | Adj P-value | Log2FC | Malignancy |
| 79016 | DDA1 | HTA11_2487_2000001011 | Human | Colorectum | SER | 1.89e-06 | 3.36e-01 | -0.1808 |
| 79016 | DDA1 | HTA11_1938_2000001011 | Human | Colorectum | AD | 4.94e-03 | 2.06e-01 | -0.0811 |
| 79016 | DDA1 | HTA11_347_2000001011 | Human | Colorectum | AD | 5.86e-06 | 2.03e-01 | -0.1954 |
| 79016 | DDA1 | HTA11_3361_2000001011 | Human | Colorectum | AD | 3.14e-03 | 2.50e-01 | -0.1207 |
| 79016 | DDA1 | HTA11_696_2000001011 | Human | Colorectum | AD | 2.90e-05 | 2.50e-01 | -0.1464 |
| 79016 | DDA1 | HTA11_1391_2000001011 | Human | Colorectum | AD | 3.25e-07 | 2.79e-01 | -0.059 |
| 79016 | DDA1 | HTA11_2992_2000001011 | Human | Colorectum | SER | 2.93e-06 | 4.06e-01 | -0.1706 |
| 79016 | DDA1 | HTA11_99999965104_69814 | Human | Colorectum | MSS | 5.94e-04 | 2.19e-01 | 0.281 |
| 79016 | DDA1 | HTA11_99999971662_82457 | Human | Colorectum | MSS | 3.20e-04 | 2.41e-01 | 0.3859 |
| 79016 | DDA1 | LZE4T | Human | Esophagus | ESCC | 5.06e-08 | 1.18e-01 | 0.0811 |
| 79016 | DDA1 | LZE5T | Human | Esophagus | ESCC | 6.12e-03 | 3.62e-01 | 0.0514 |
| 79016 | DDA1 | LZE7T | Human | Esophagus | ESCC | 4.06e-17 | 1.05e+00 | 0.0667 |
| 79016 | DDA1 | LZE8T | Human | Esophagus | ESCC | 5.68e-04 | 1.74e-01 | 0.067 |
| 79016 | DDA1 | LZE20T | Human | Esophagus | ESCC | 4.50e-09 | 9.76e-02 | 0.0662 |
| 79016 | DDA1 | LZE22T | Human | Esophagus | ESCC | 1.66e-02 | 4.32e-01 | 0.068 |
| 79016 | DDA1 | LZE24T | Human | Esophagus | ESCC | 4.36e-19 | 6.58e-01 | 0.0596 |
| 79016 | DDA1 | LZE21T | Human | Esophagus | ESCC | 6.18e-03 | 2.13e-01 | 0.0655 |
| 79016 | DDA1 | LZE6T | Human | Esophagus | ESCC | 1.88e-06 | 4.14e-01 | 0.0845 |
| 79016 | DDA1 | P1T-E | Human | Esophagus | ESCC | 1.15e-09 | 8.25e-01 | 0.0875 |
| 79016 | DDA1 | P2T-E | Human | Esophagus | ESCC | 8.87e-28 | 1.70e-01 | 0.1177 |
| Page: 1 2 3 4 5 6 7 |
| Tissue | Expression Dynamics | Abbreviation |
| Colorectum (GSE201348) |  | FAP: Familial adenomatous polyposis |
| CRC: Colorectal cancer | ||
| Colorectum (HTA11) |  | AD: Adenomas |
| SER: Sessile serrated lesions | ||
| MSI-H: Microsatellite-high colorectal cancer | ||
| MSS: Microsatellite stable colorectal cancer | ||
| Esophagus | 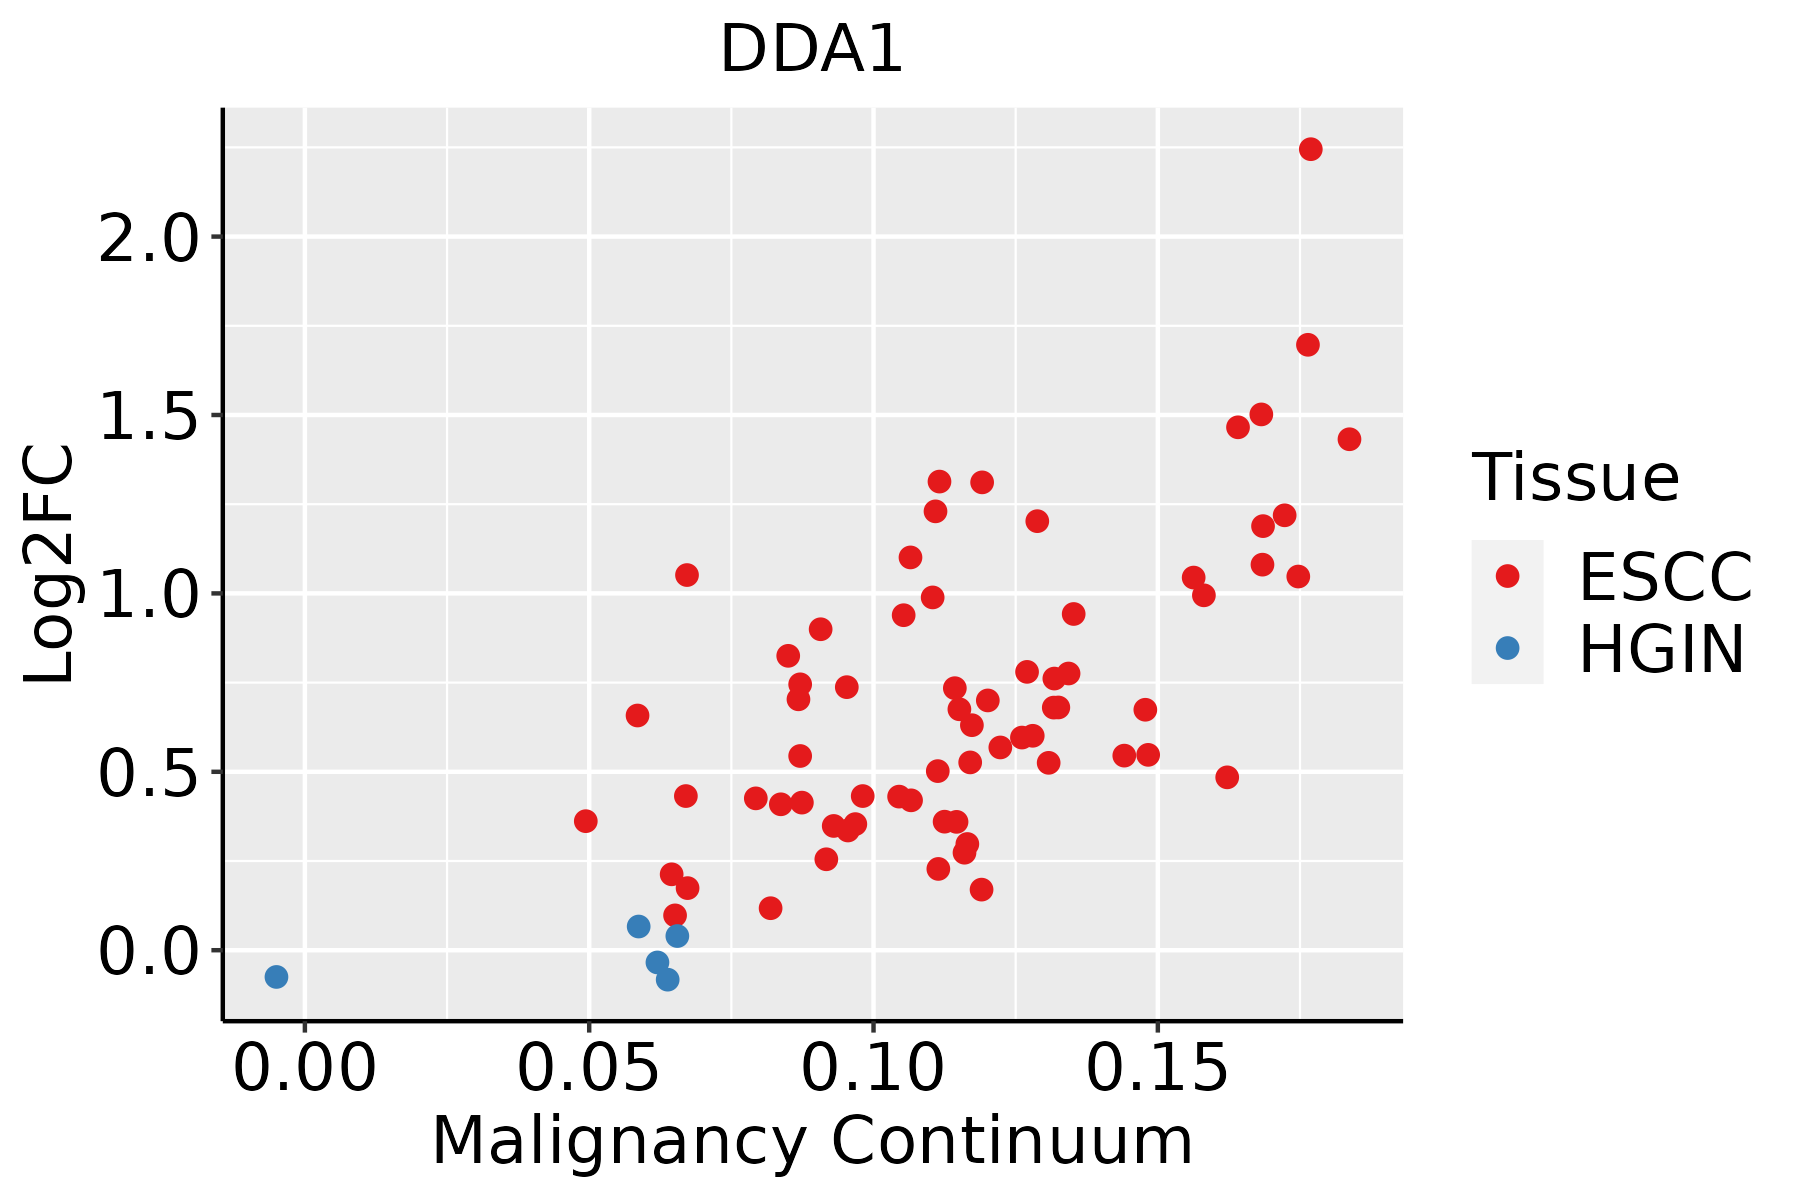 | ESCC: Esophageal squamous cell carcinoma |
| HGIN: High-grade intraepithelial neoplasias | ||
| LGIN: Low-grade intraepithelial neoplasias | ||
| Liver | 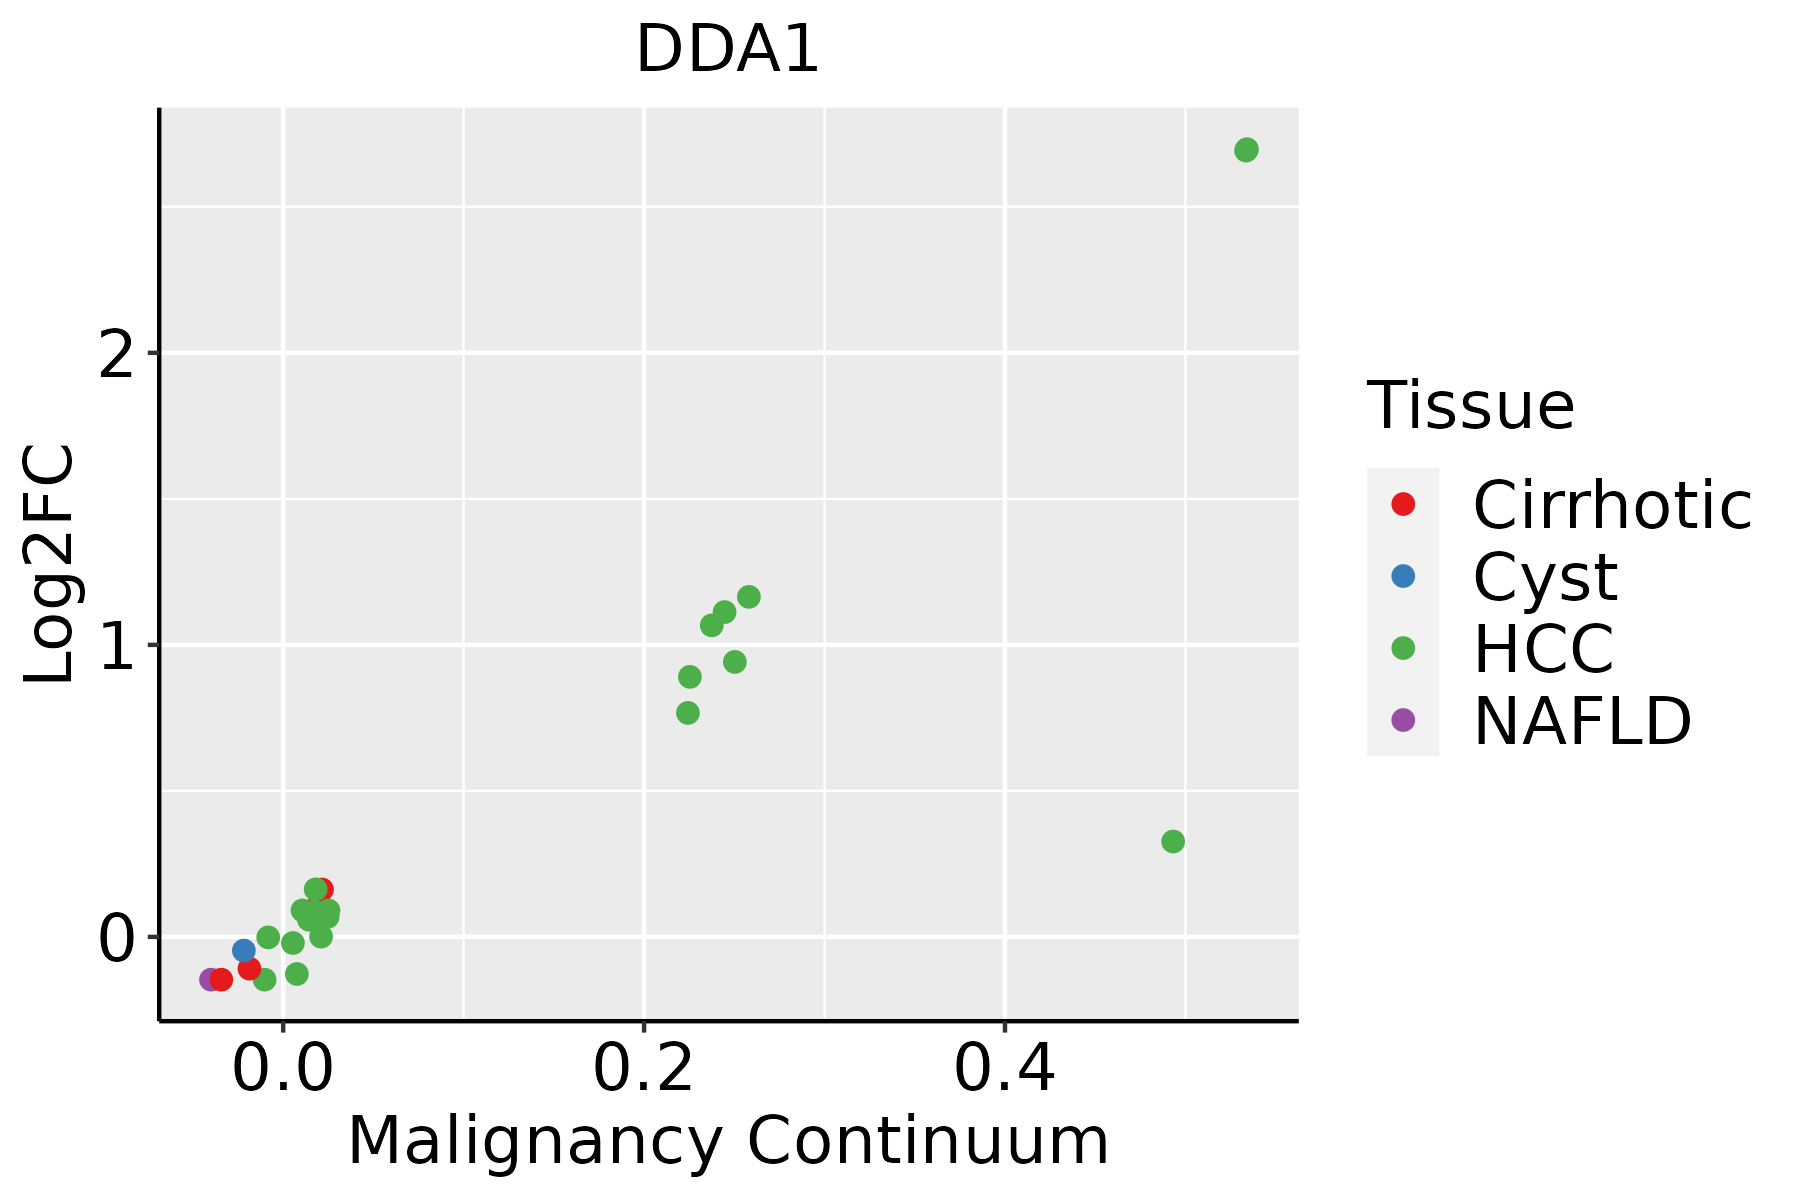 | HCC: Hepatocellular carcinoma |
| NAFLD: Non-alcoholic fatty liver disease | ||
| Oral Cavity | 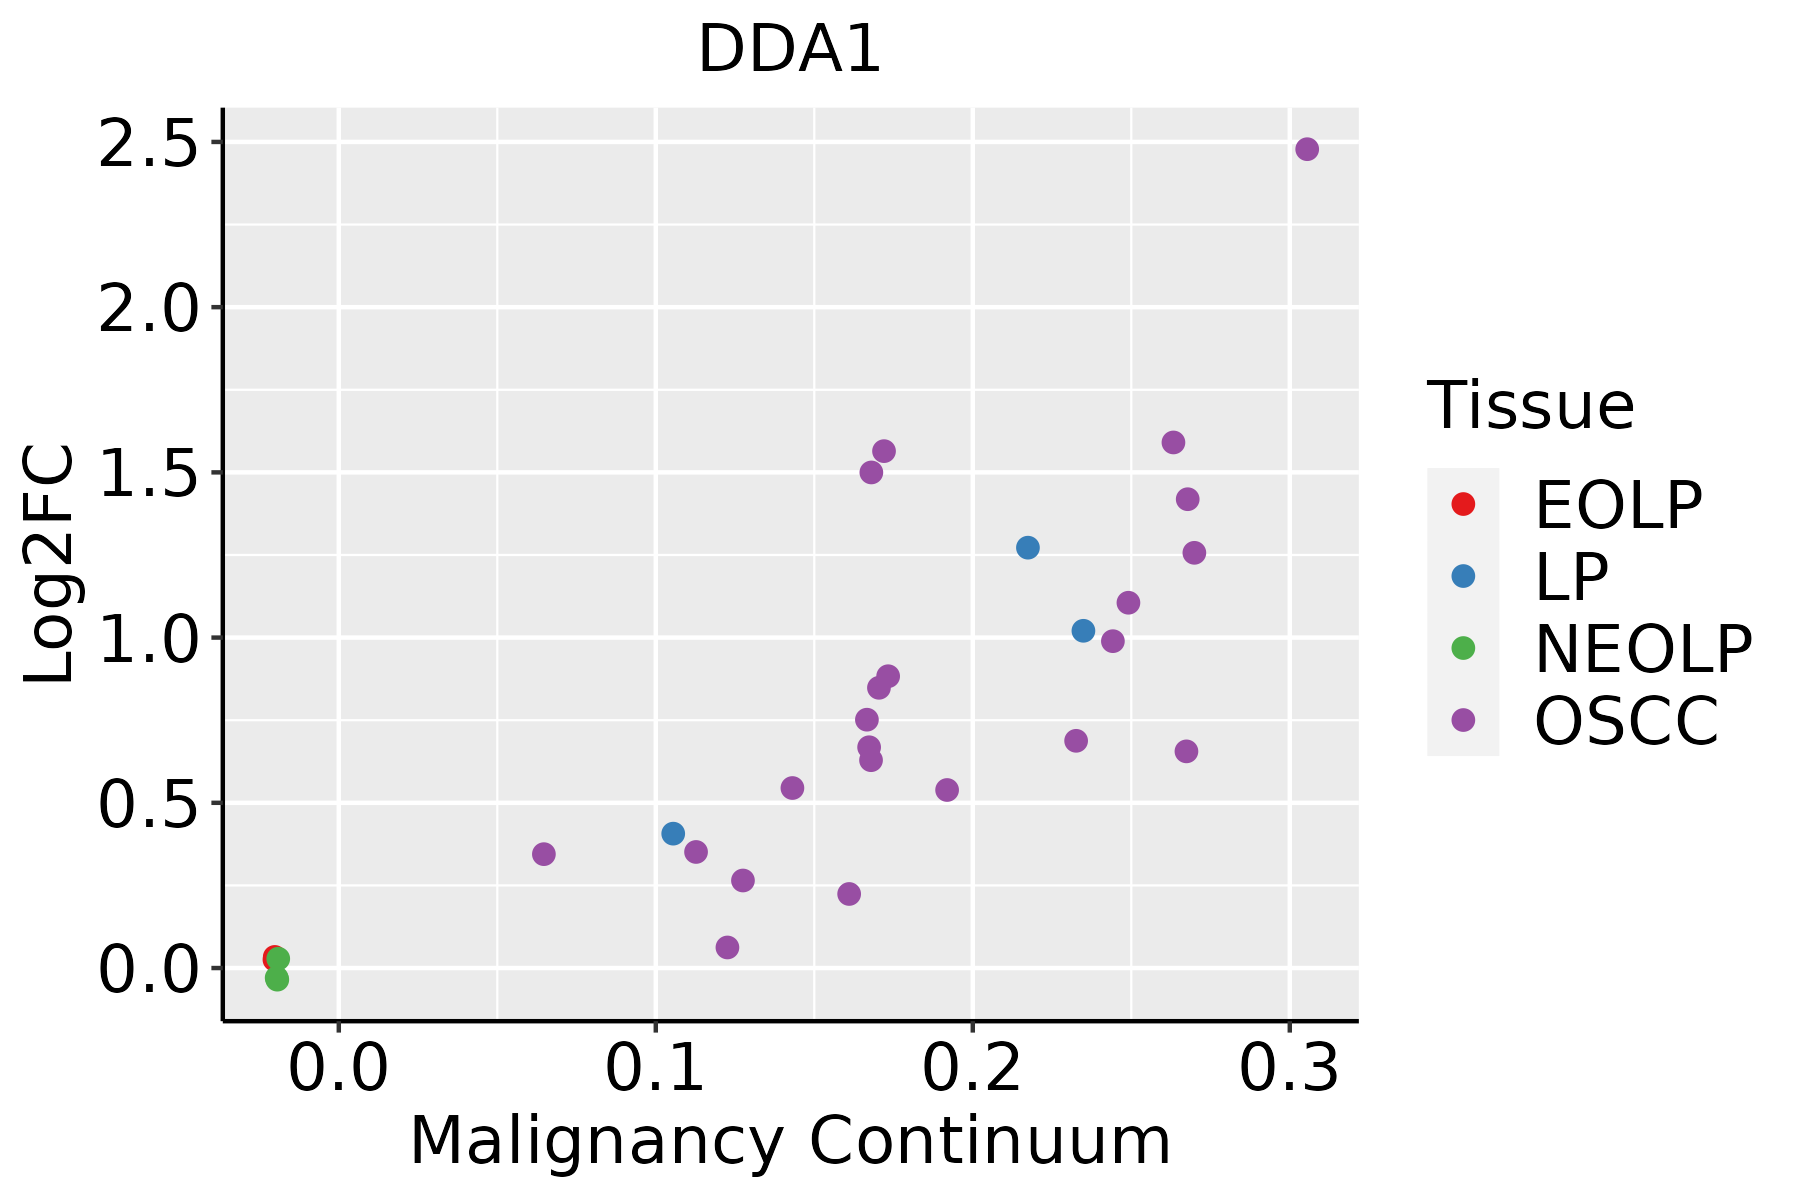 | EOLP: Erosive Oral lichen planus |
| LP: leukoplakia | ||
| NEOLP: Non-erosive oral lichen planus | ||
| OSCC: Oral squamous cell carcinoma | ||
| Skin | 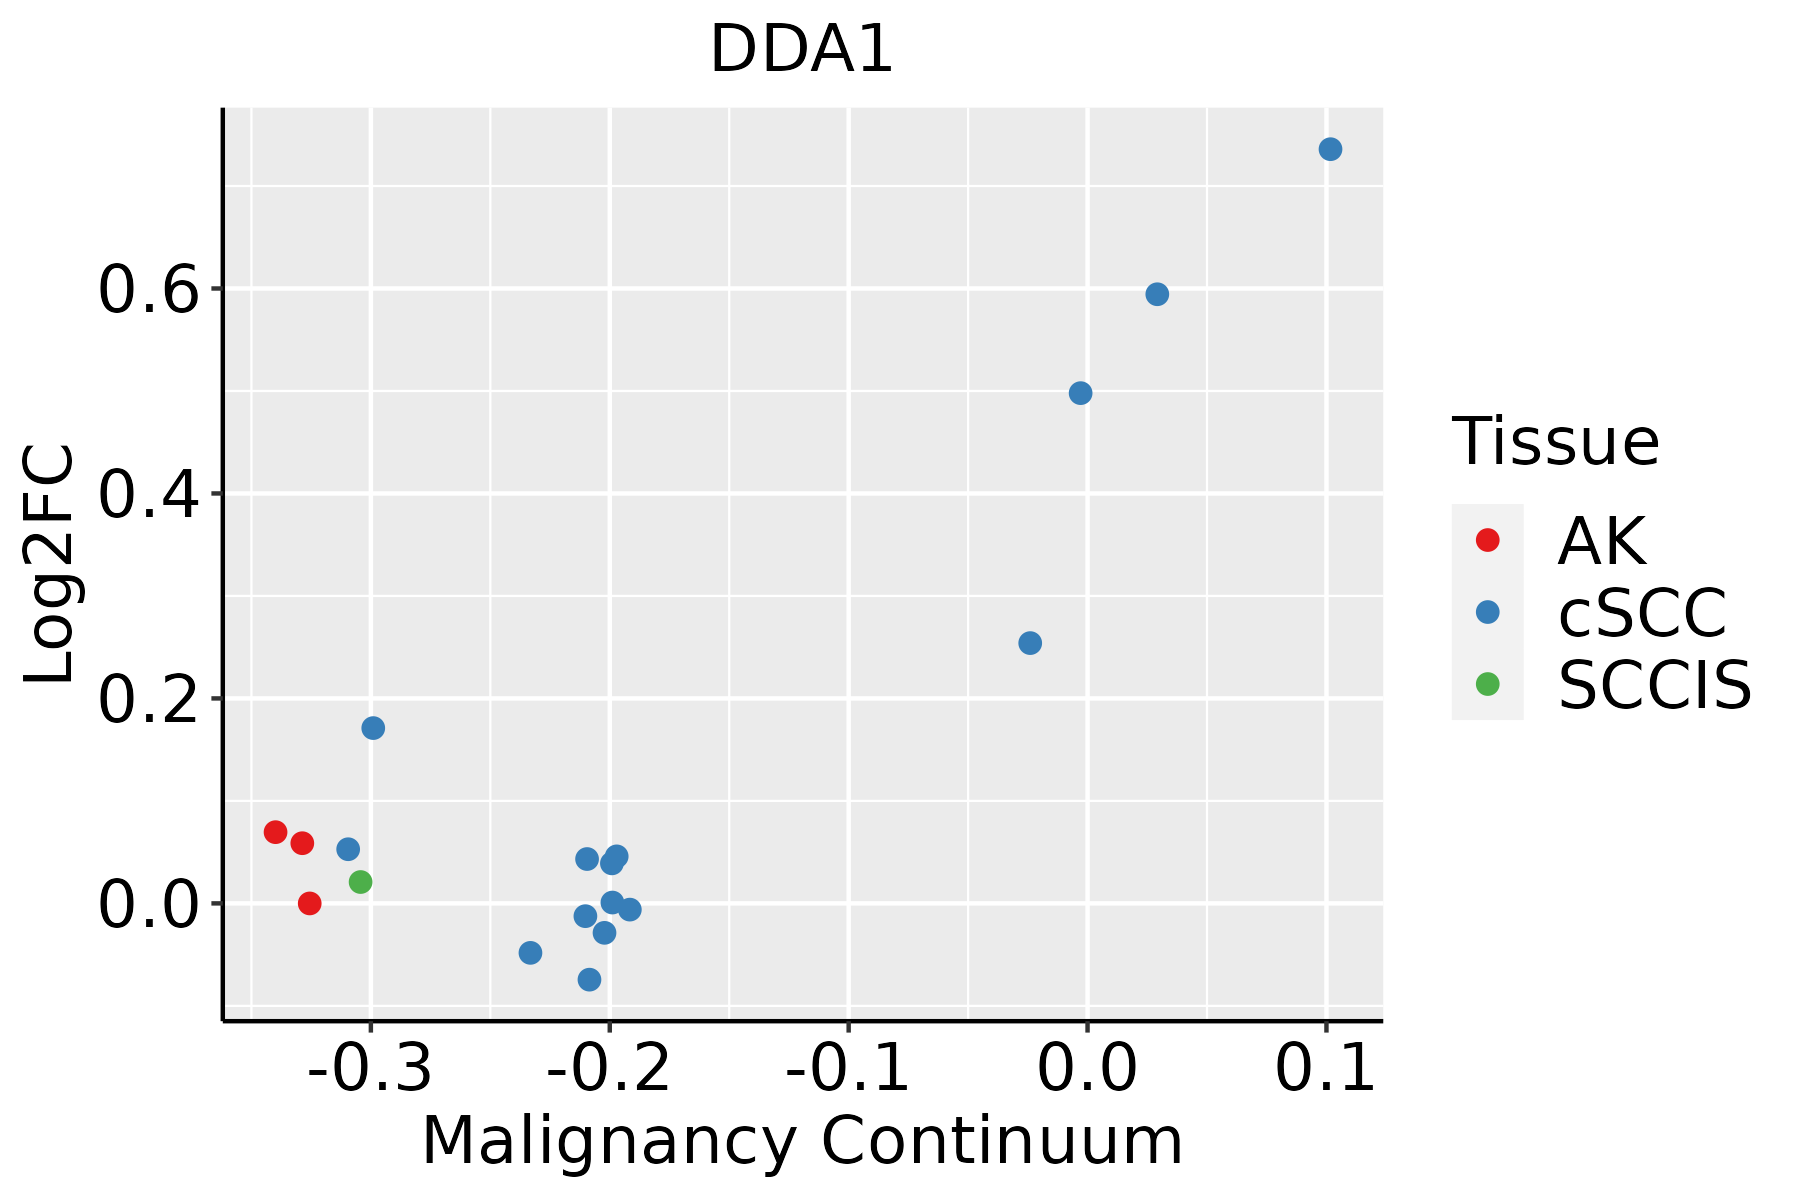 | AK: Actinic keratosis |
| cSCC: Cutaneous squamous cell carcinoma | ||
| SCCIS:squamous cell carcinoma in situ | ||
| Thyroid | 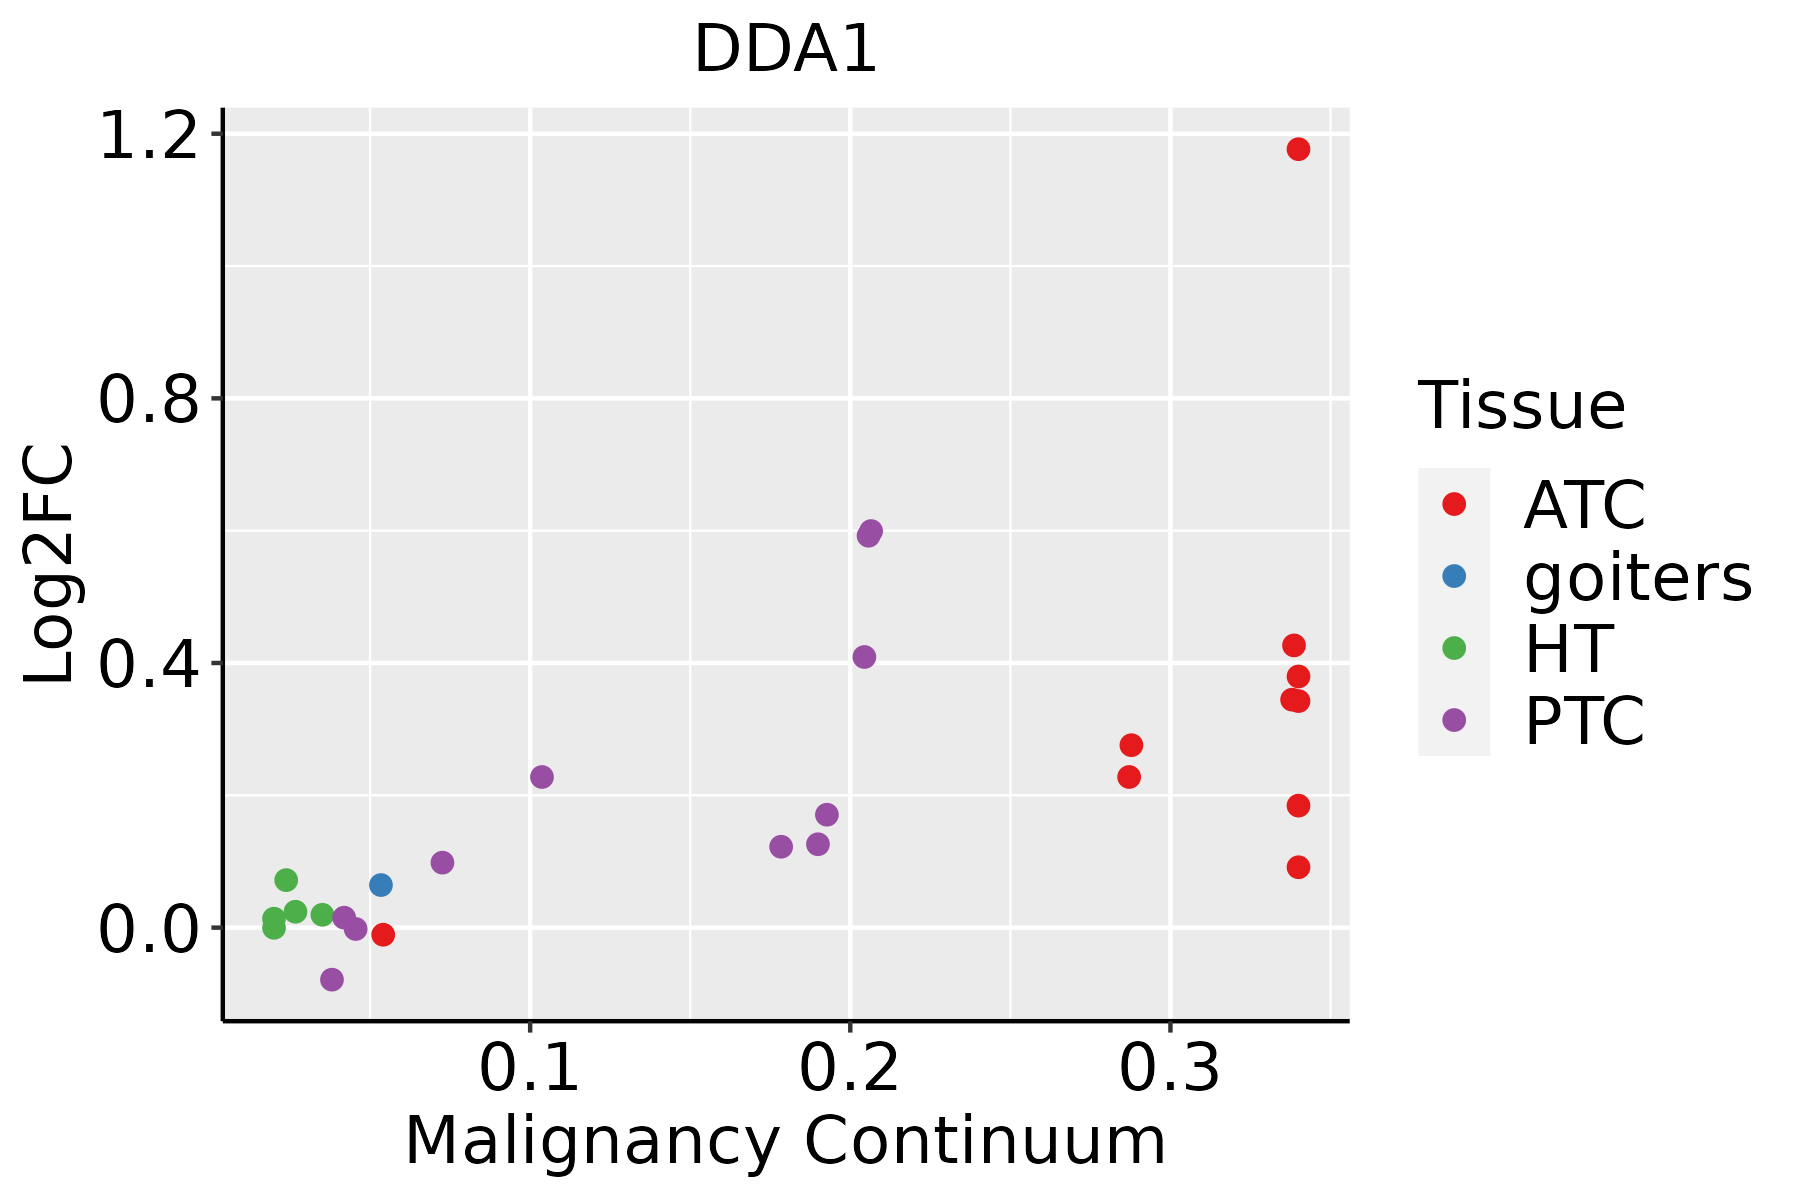 | ATC: Anaplastic thyroid cancer |
| HT: Hashimoto's thyroiditis | ||
| PTC: Papillary thyroid cancer |
| ∗log2FC in expression of this searched gene in stem-like cells from each diseased tissue sample relative to stem-like cells in normal samples in each tissue plotted against the malignancy continuum. Samples are colored based on if they are from different disease stage. |
Top |
Malignant transformation related pathway analysis |
| Find out the enriched GO biological processes and KEGG pathways involved in transition from healthy to precancer to cancer |
| Tissue | Disease Stage | Enriched GO biological Processes |
| Colorectum | AD |  |
| Colorectum | SER |  |
| Colorectum | MSS |  |
| Colorectum | MSI-H |  |
| Colorectum | FAP |  |
| ∗Top 15 enriched GO BP terms are showed in the bar plot of each disease state in each tissue. Each row represents a significant GO biological process which is colored according to the -log10(p.adjust). |
| Page: 1 2 3 4 5 6 7 8 9 |
| GO ID | Tissue | Disease Stage | Description | Gene Ratio | Bg Ratio | pvalue | p.adjust | Count |
| GO:0042176 | Colorectum | AD | regulation of protein catabolic process | 160/3918 | 391/18723 | 1.06e-19 | 7.34e-17 | 160 |
| GO:0009896 | Colorectum | AD | positive regulation of catabolic process | 180/3918 | 492/18723 | 4.33e-16 | 1.94e-13 | 180 |
| GO:1903362 | Colorectum | AD | regulation of cellular protein catabolic process | 109/3918 | 255/18723 | 2.14e-15 | 6.08e-13 | 109 |
| GO:0010498 | Colorectum | AD | proteasomal protein catabolic process | 174/3918 | 490/18723 | 3.18e-14 | 7.66e-12 | 174 |
| GO:0031331 | Colorectum | AD | positive regulation of cellular catabolic process | 156/3918 | 427/18723 | 4.68e-14 | 1.05e-11 | 156 |
| GO:1903050 | Colorectum | AD | regulation of proteolysis involved in cellular protein catabolic process | 92/3918 | 221/18723 | 2.04e-12 | 3.19e-10 | 92 |
| GO:0045732 | Colorectum | AD | positive regulation of protein catabolic process | 92/3918 | 231/18723 | 3.85e-11 | 4.47e-09 | 92 |
| GO:0043161 | Colorectum | AD | proteasome-mediated ubiquitin-dependent protein catabolic process | 141/3918 | 412/18723 | 1.77e-10 | 1.68e-08 | 141 |
| GO:0045862 | Colorectum | AD | positive regulation of proteolysis | 129/3918 | 372/18723 | 4.04e-10 | 3.46e-08 | 129 |
| GO:0061136 | Colorectum | AD | regulation of proteasomal protein catabolic process | 75/3918 | 187/18723 | 1.65e-09 | 1.20e-07 | 75 |
| GO:2000058 | Colorectum | AD | regulation of ubiquitin-dependent protein catabolic process | 68/3918 | 164/18723 | 1.82e-09 | 1.31e-07 | 68 |
| GO:1903364 | Colorectum | AD | positive regulation of cellular protein catabolic process | 62/3918 | 155/18723 | 4.66e-08 | 2.51e-06 | 62 |
| GO:0032434 | Colorectum | AD | regulation of proteasomal ubiquitin-dependent protein catabolic process | 54/3918 | 134/18723 | 2.51e-07 | 1.02e-05 | 54 |
| GO:1903052 | Colorectum | AD | positive regulation of proteolysis involved in cellular protein catabolic process | 53/3918 | 133/18723 | 4.93e-07 | 1.85e-05 | 53 |
| GO:2000060 | Colorectum | AD | positive regulation of ubiquitin-dependent protein catabolic process | 44/3918 | 107/18723 | 1.65e-06 | 5.03e-05 | 44 |
| GO:0000209 | Colorectum | AD | protein polyubiquitination | 78/3918 | 236/18723 | 8.71e-06 | 2.06e-04 | 78 |
| GO:1901800 | Colorectum | AD | positive regulation of proteasomal protein catabolic process | 44/3918 | 114/18723 | 1.18e-05 | 2.62e-04 | 44 |
| GO:0032436 | Colorectum | AD | positive regulation of proteasomal ubiquitin-dependent protein catabolic process | 36/3918 | 90/18723 | 2.89e-05 | 5.37e-04 | 36 |
| GO:00421761 | Colorectum | SER | regulation of protein catabolic process | 126/2897 | 391/18723 | 5.33e-17 | 2.52e-14 | 126 |
| GO:19033621 | Colorectum | SER | regulation of cellular protein catabolic process | 91/2897 | 255/18723 | 1.22e-15 | 5.36e-13 | 91 |
| Page: 1 2 3 4 5 6 7 8 9 10 |
| Pathway ID | Tissue | Disease Stage | Description | Gene Ratio | Bg Ratio | pvalue | p.adjust | qvalue | Count |
| Page: 1 |
Top |
Cell-cell communication analysis |
| Identification of potential cell-cell interactions between two cell types and their ligand-receptor pairs for different disease states |
| Ligand | Receptor | LRpair | Pathway | Tissue | Disease Stage |
| Page: 1 |
Top |
Single-cell gene regulatory network inference analysis |
| Find out the significant the regulons (TFs) and the target genes of each regulon across cell types for different disease states |
| TF | Cell Type | Tissue | Disease Stage | Target Gene | RSS | Regulon Activity |
| ∗The dot plots of a searched regulon are shown for all cell subpopulations in each disease state of each tissue based on the regulon specific score inferred using pySCENIC and by calculating the average expression. |
| Page: 1 |
Top |
Somatic mutation of malignant transformation related genes |
| Annotation of somatic variants for genes involved in malignant transformation |
| Hugo Symbol | Variant Class | Variant Classification | dbSNP RS | HGVSc | HGVSp | HGVSp Short | SWISSPROT | BIOTYPE | SIFT | PolyPhen | Tumor Sample Barcode | Tissue | Histology | Sex | Age | Stage | Therapy Types | Drugs | Outcome |
| DDA1 | SNV | Missense_Mutation | rs374142177 | c.70N>A | p.Val24Met | p.V24M | Q9BW61 | protein_coding | tolerated(0.22) | benign(0.151) | TCGA-AZ-6601-01 | Colorectum | colon adenocarcinoma | Male | >=65 | I/II | Unknown | Unknown | PD |
| DDA1 | SNV | Missense_Mutation | novel | c.125C>T | p.Pro42Leu | p.P42L | Q9BW61 | protein_coding | deleterious(0) | probably_damaging(0.941) | TCGA-AJ-A3BH-01 | Endometrium | uterine corpus endometrioid carcinoma | Female | Unknown | I/II | Unknown | Unknown | SD |
| DDA1 | SNV | Missense_Mutation | novel | c.7N>T | p.Asp3Tyr | p.D3Y | Q9BW61 | protein_coding | deleterious(0.02) | possibly_damaging(0.83) | TCGA-AP-A1E0-01 | Endometrium | uterine corpus endometrioid carcinoma | Female | <65 | III/IV | Chemotherapy | paclitaxel | SD |
| DDA1 | SNV | Missense_Mutation | rs759978228 | c.53N>A | p.Arg18Gln | p.R18Q | Q9BW61 | protein_coding | tolerated(0.07) | benign(0.066) | TCGA-E6-A1LX-01 | Endometrium | uterine corpus endometrioid carcinoma | Female | <65 | I/II | Unknown | Unknown | SD |
| DDA1 | SNV | Missense_Mutation | rs766625782 | c.92G>A | p.Arg31Gln | p.R31Q | Q9BW61 | protein_coding | deleterious(0.01) | probably_damaging(0.995) | TCGA-EY-A215-01 | Endometrium | uterine corpus endometrioid carcinoma | Female | <65 | I/II | Unknown | Unknown | SD |
| DDA1 | SNV | Missense_Mutation | novel | c.142G>A | p.Val48Met | p.V48M | Q9BW61 | protein_coding | deleterious(0) | benign(0.068) | TCGA-EY-A215-01 | Endometrium | uterine corpus endometrioid carcinoma | Female | <65 | I/II | Unknown | Unknown | SD |
| DDA1 | SNV | Missense_Mutation | novel | c.80N>G | p.Ala27Gly | p.A27G | Q9BW61 | protein_coding | tolerated(0.23) | possibly_damaging(0.617) | TCGA-62-8399-01 | Lung | lung adenocarcinoma | Male | <65 | III/IV | Unknown | Unknown | SD |
| DDA1 | SNV | Missense_Mutation | novel | c.98N>T | p.Ser33Leu | p.S33L | Q9BW61 | protein_coding | deleterious(0.04) | benign(0.007) | TCGA-98-A53J-01 | Lung | lung squamous cell carcinoma | Male | >=65 | I/II | Unknown | Unknown | SD |
| DDA1 | insertion | Frame_Shift_Ins | novel | c.192_193insA | p.Asn67GlufsTer93 | p.N67Efs*93 | Q9BW61 | protein_coding | TCGA-50-5049-01 | Lung | lung adenocarcinoma | Male | >=65 | I/II | Unknown | Unknown | PD | ||
| DDA1 | SNV | Missense_Mutation | novel | c.251C>G | p.Ser84Cys | p.S84C | Q9BW61 | protein_coding | deleterious(0.03) | benign(0.079) | TCGA-CV-7099-01 | Oral cavity | head & neck squamous cell carcinoma | Female | >=65 | I/II | Unknown | Unknown | SD |
| Page: 1 |
Top |
Related drugs of malignant transformation related genes |
| Identification of chemicals and drugs interact with genes involved in malignant transfromation |
| (DGIdb 4.0) |
| Entrez ID | Symbol | Category | Interaction Types | Drug Claim Name | Drug Name | PMIDs |
| Page: 1 |

Copyright 2023-Present -The University of Texas Health Science Center at Houston |