
|
|||||
|
 | |
| |
| |
| |
| |
| |
|
Gene: DCUN1D5 |
Gene summary for DCUN1D5 |
| Gene information | Species | Human | Gene symbol | DCUN1D5 | Gene ID | 84259 |
| Gene name | defective in cullin neddylation 1 domain containing 5 | |
| Gene Alias | DCNL5 | |
| Cytomap | 11q22.3 | |
| Gene Type | protein-coding | GO ID | GO:0001558 | UniProtAcc | B4DP84 |
Top |
Malignant transformation analysis |
| Identification of the aberrant gene expression in precancerous and cancerous lesions by comparing the gene expression of stem-like cells in diseased tissues with normal stem cells |
| Entrez ID | Symbol | Replicates | Species | Organ | Tissue | Adj P-value | Log2FC | Malignancy |
| 84259 | DCUN1D5 | LZE4T | Human | Esophagus | ESCC | 9.22e-15 | 6.87e-01 | 0.0811 |
| 84259 | DCUN1D5 | LZE7T | Human | Esophagus | ESCC | 1.33e-02 | 6.10e-01 | 0.0667 |
| 84259 | DCUN1D5 | LZE8T | Human | Esophagus | ESCC | 1.97e-09 | 6.20e-01 | 0.067 |
| 84259 | DCUN1D5 | LZE20T | Human | Esophagus | ESCC | 4.20e-03 | 2.60e-01 | 0.0662 |
| 84259 | DCUN1D5 | LZE21D1 | Human | Esophagus | HGIN | 3.26e-02 | 8.45e-02 | 0.0632 |
| 84259 | DCUN1D5 | LZE22D1 | Human | Esophagus | HGIN | 1.18e-12 | 1.69e+00 | 0.0595 |
| 84259 | DCUN1D5 | LZE22T | Human | Esophagus | ESCC | 5.35e-27 | 3.63e+00 | 0.068 |
| 84259 | DCUN1D5 | LZE24T | Human | Esophagus | ESCC | 4.61e-26 | 1.00e+00 | 0.0596 |
| 84259 | DCUN1D5 | LZE22D3 | Human | Esophagus | HGIN | 1.19e-04 | 2.23e+00 | 0.0653 |
| 84259 | DCUN1D5 | LZE21T | Human | Esophagus | ESCC | 3.05e-04 | 6.44e-02 | 0.0655 |
| 84259 | DCUN1D5 | LZE6T | Human | Esophagus | ESCC | 5.69e-08 | 4.15e-01 | 0.0845 |
| 84259 | DCUN1D5 | P1T-E | Human | Esophagus | ESCC | 4.80e-03 | 2.19e-01 | 0.0875 |
| 84259 | DCUN1D5 | P2T-E | Human | Esophagus | ESCC | 1.09e-21 | 4.09e-01 | 0.1177 |
| 84259 | DCUN1D5 | P4T-E | Human | Esophagus | ESCC | 1.52e-47 | 1.73e+00 | 0.1323 |
| 84259 | DCUN1D5 | P5T-E | Human | Esophagus | ESCC | 6.09e-69 | 1.65e+00 | 0.1327 |
| 84259 | DCUN1D5 | P8T-E | Human | Esophagus | ESCC | 1.52e-75 | 1.58e+00 | 0.0889 |
| 84259 | DCUN1D5 | P9T-E | Human | Esophagus | ESCC | 1.31e-20 | 6.63e-01 | 0.1131 |
| 84259 | DCUN1D5 | P10T-E | Human | Esophagus | ESCC | 5.21e-38 | 6.63e-01 | 0.116 |
| 84259 | DCUN1D5 | P11T-E | Human | Esophagus | ESCC | 2.17e-17 | 1.12e+00 | 0.1426 |
| 84259 | DCUN1D5 | P12T-E | Human | Esophagus | ESCC | 1.90e-47 | 8.81e-01 | 0.1122 |
| Page: 1 2 3 4 5 6 7 |
| Tissue | Expression Dynamics | Abbreviation |
| Esophagus | 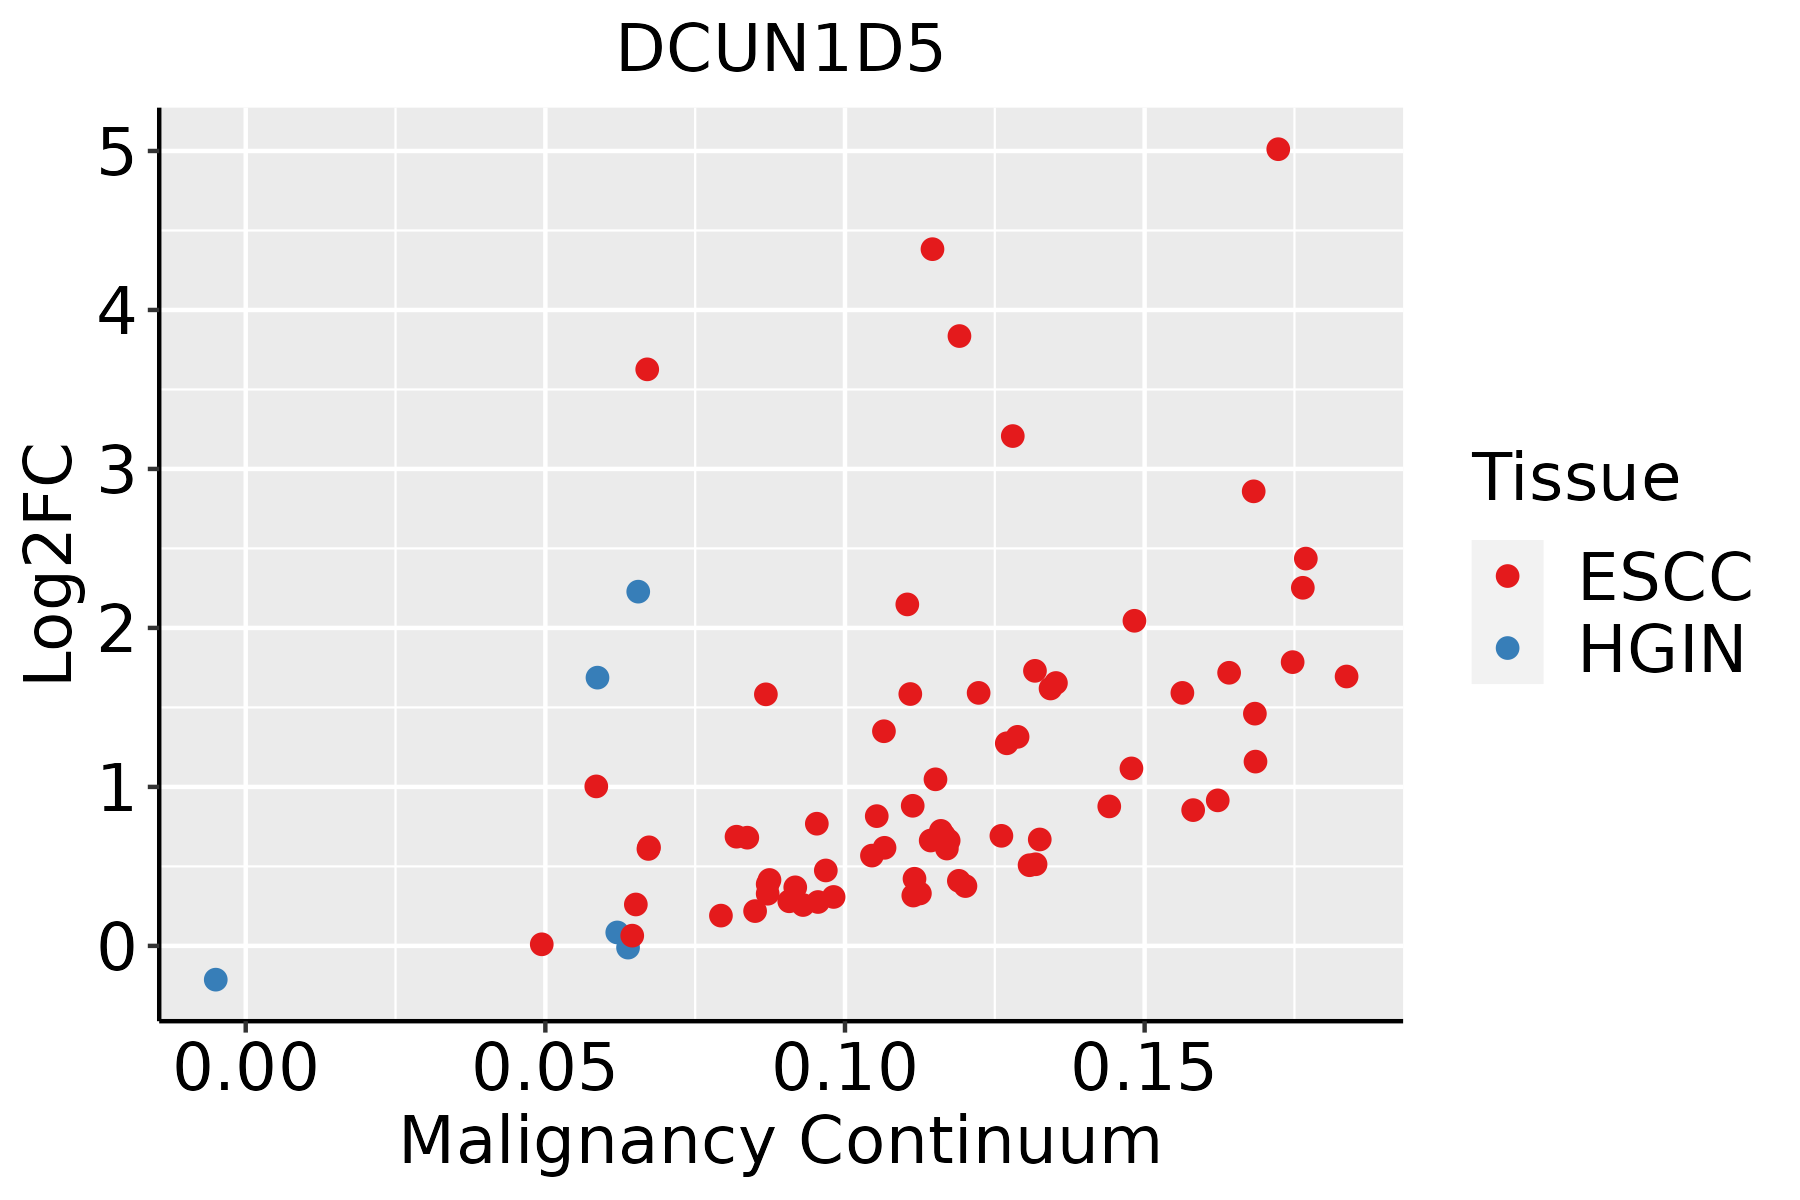 | ESCC: Esophageal squamous cell carcinoma |
| HGIN: High-grade intraepithelial neoplasias | ||
| LGIN: Low-grade intraepithelial neoplasias | ||
| Liver |  | HCC: Hepatocellular carcinoma |
| NAFLD: Non-alcoholic fatty liver disease | ||
| Oral Cavity | 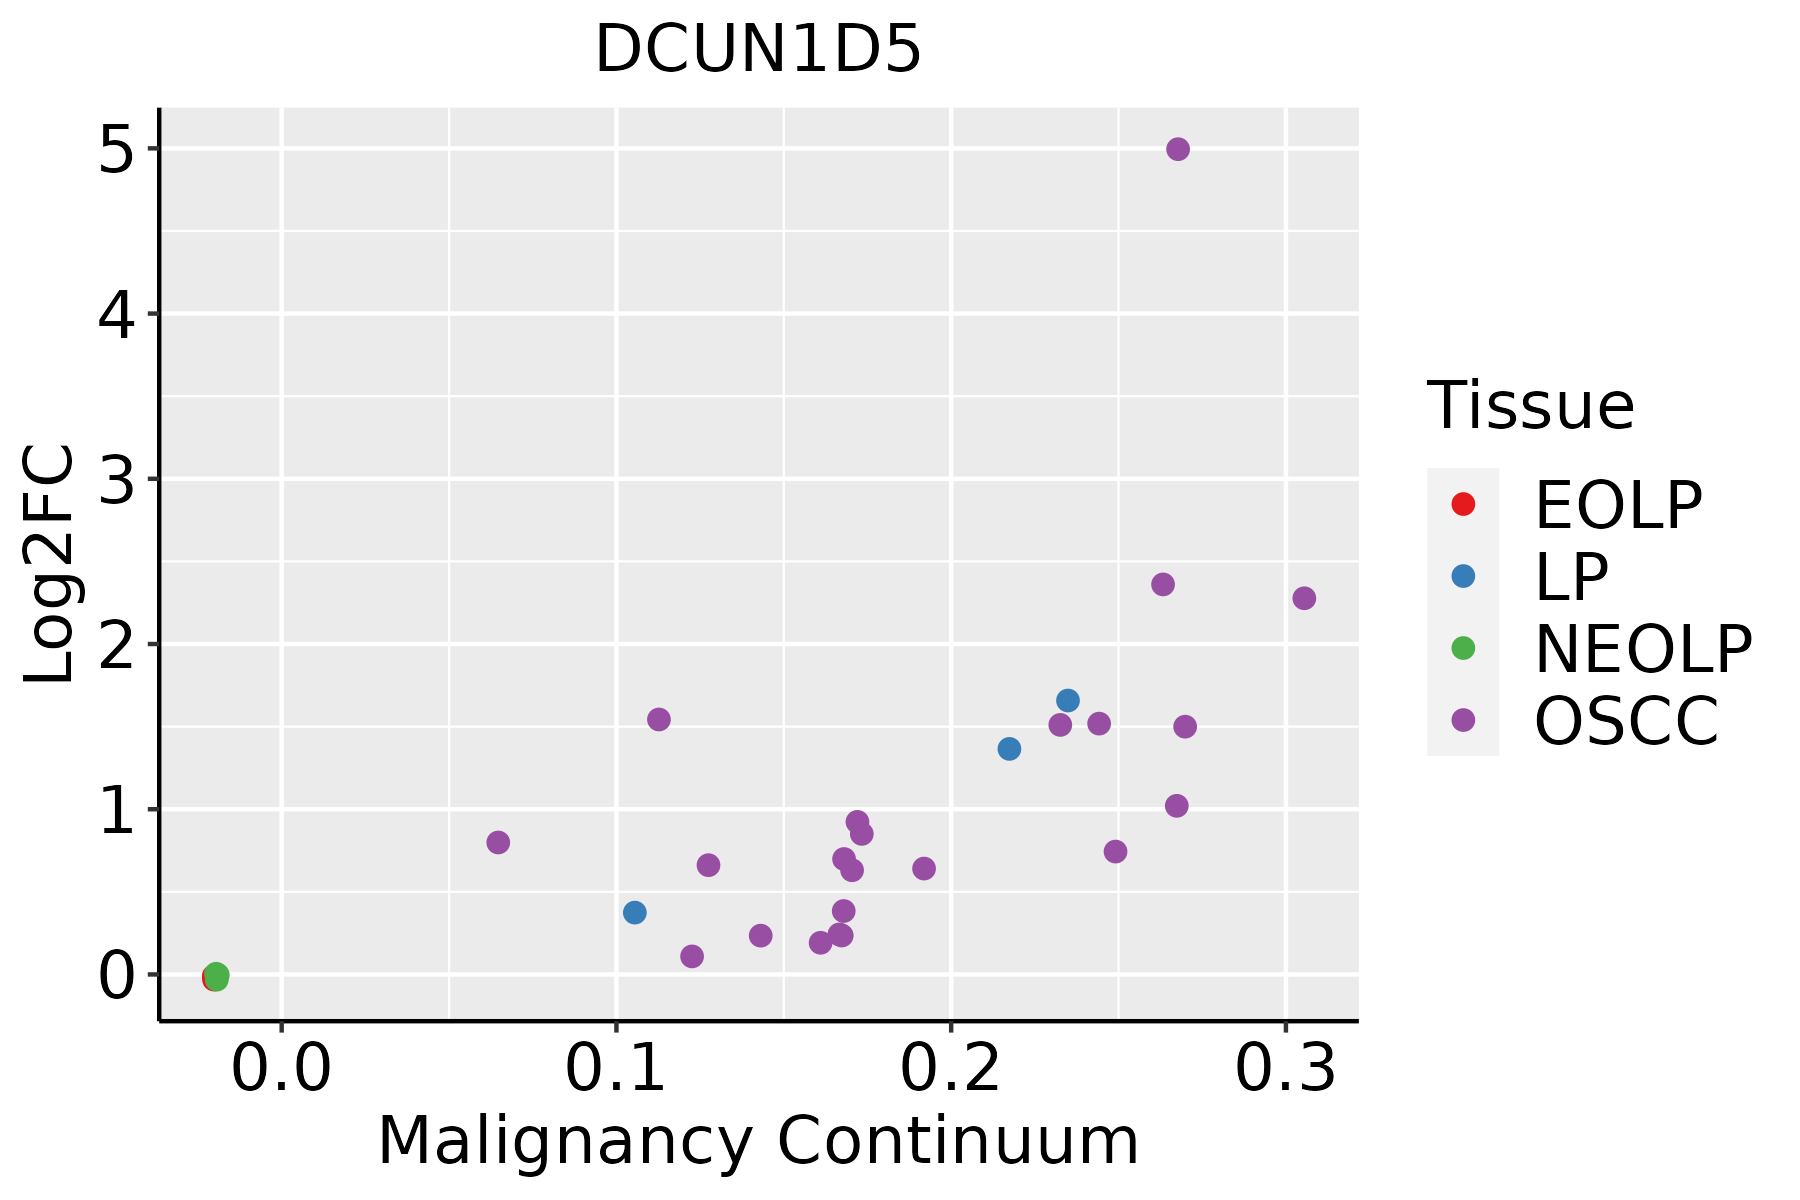 | EOLP: Erosive Oral lichen planus |
| LP: leukoplakia | ||
| NEOLP: Non-erosive oral lichen planus | ||
| OSCC: Oral squamous cell carcinoma | ||
| Prostate |  | BPH: Benign Prostatic Hyperplasia |
| Skin | 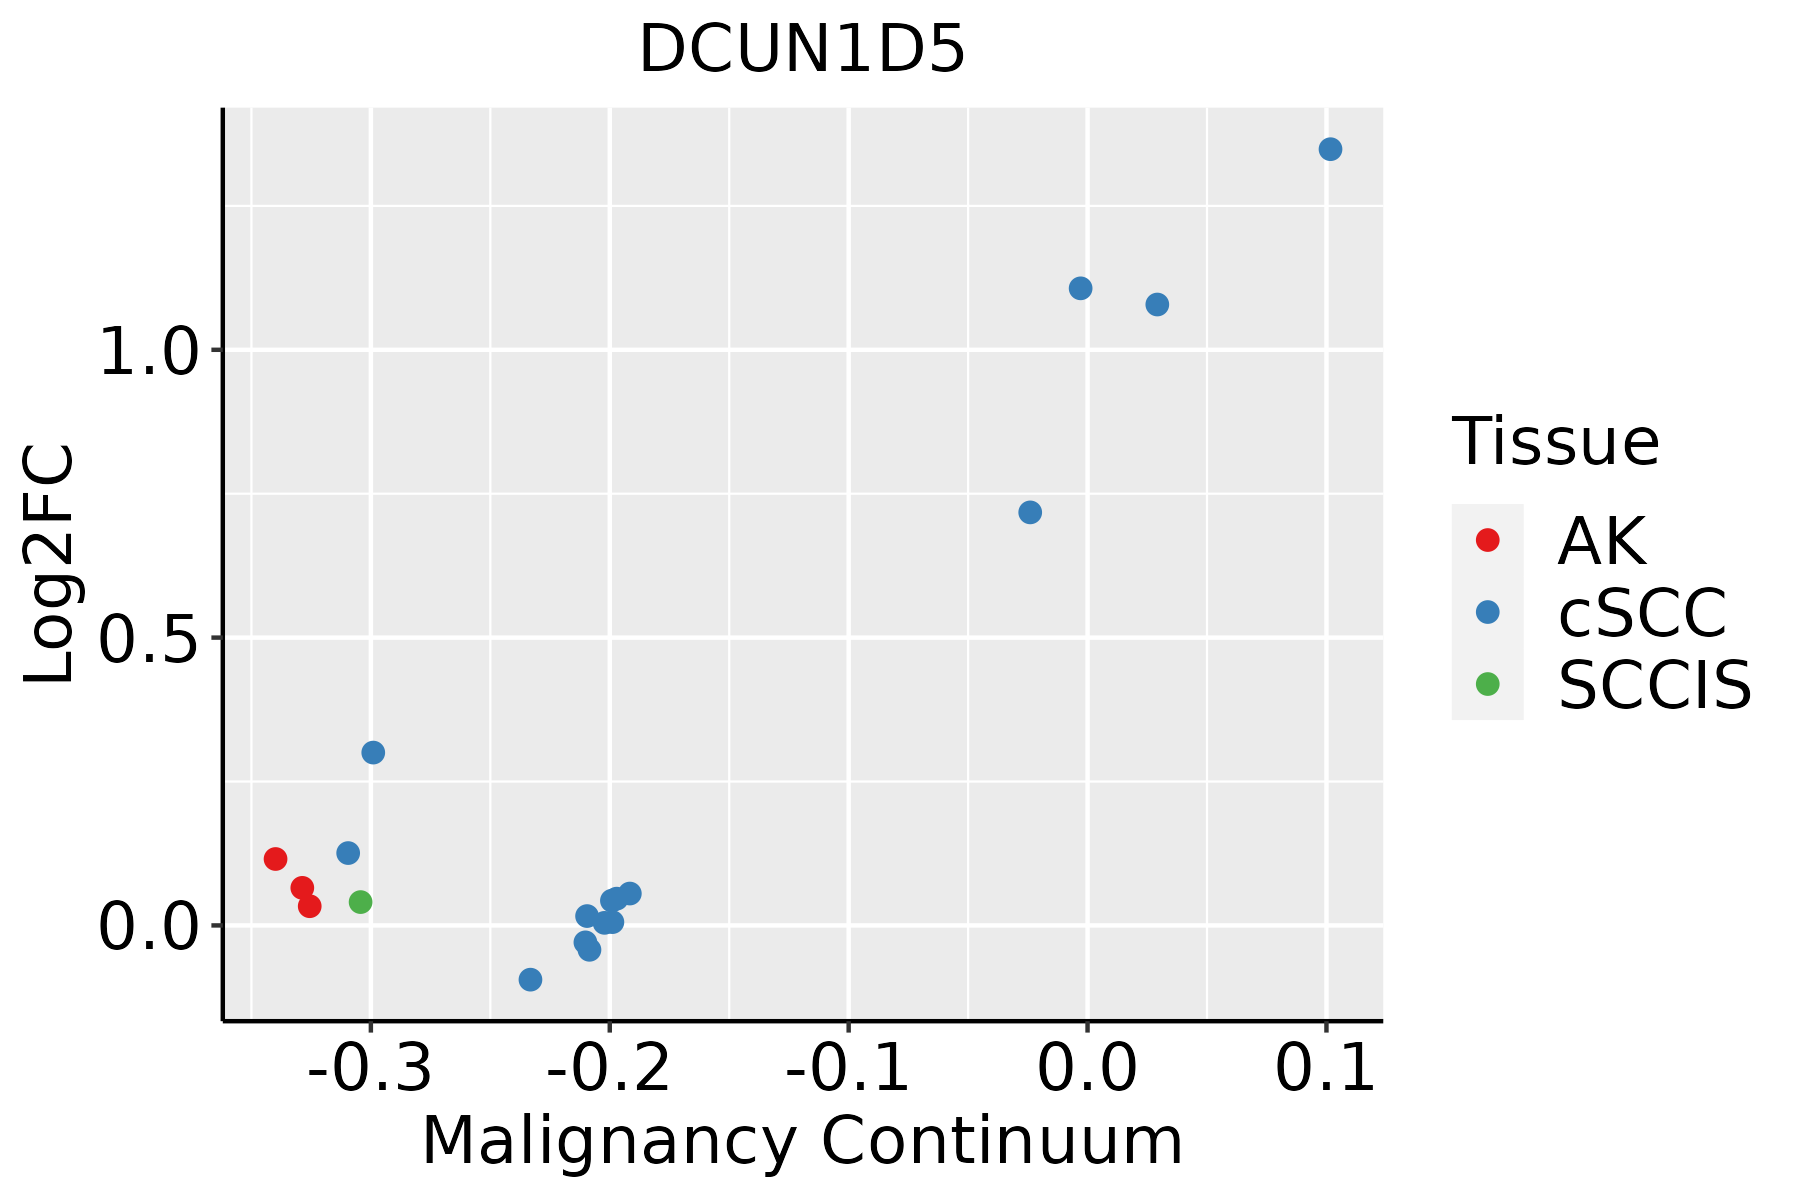 | AK: Actinic keratosis |
| cSCC: Cutaneous squamous cell carcinoma | ||
| SCCIS:squamous cell carcinoma in situ | ||
| Thyroid | 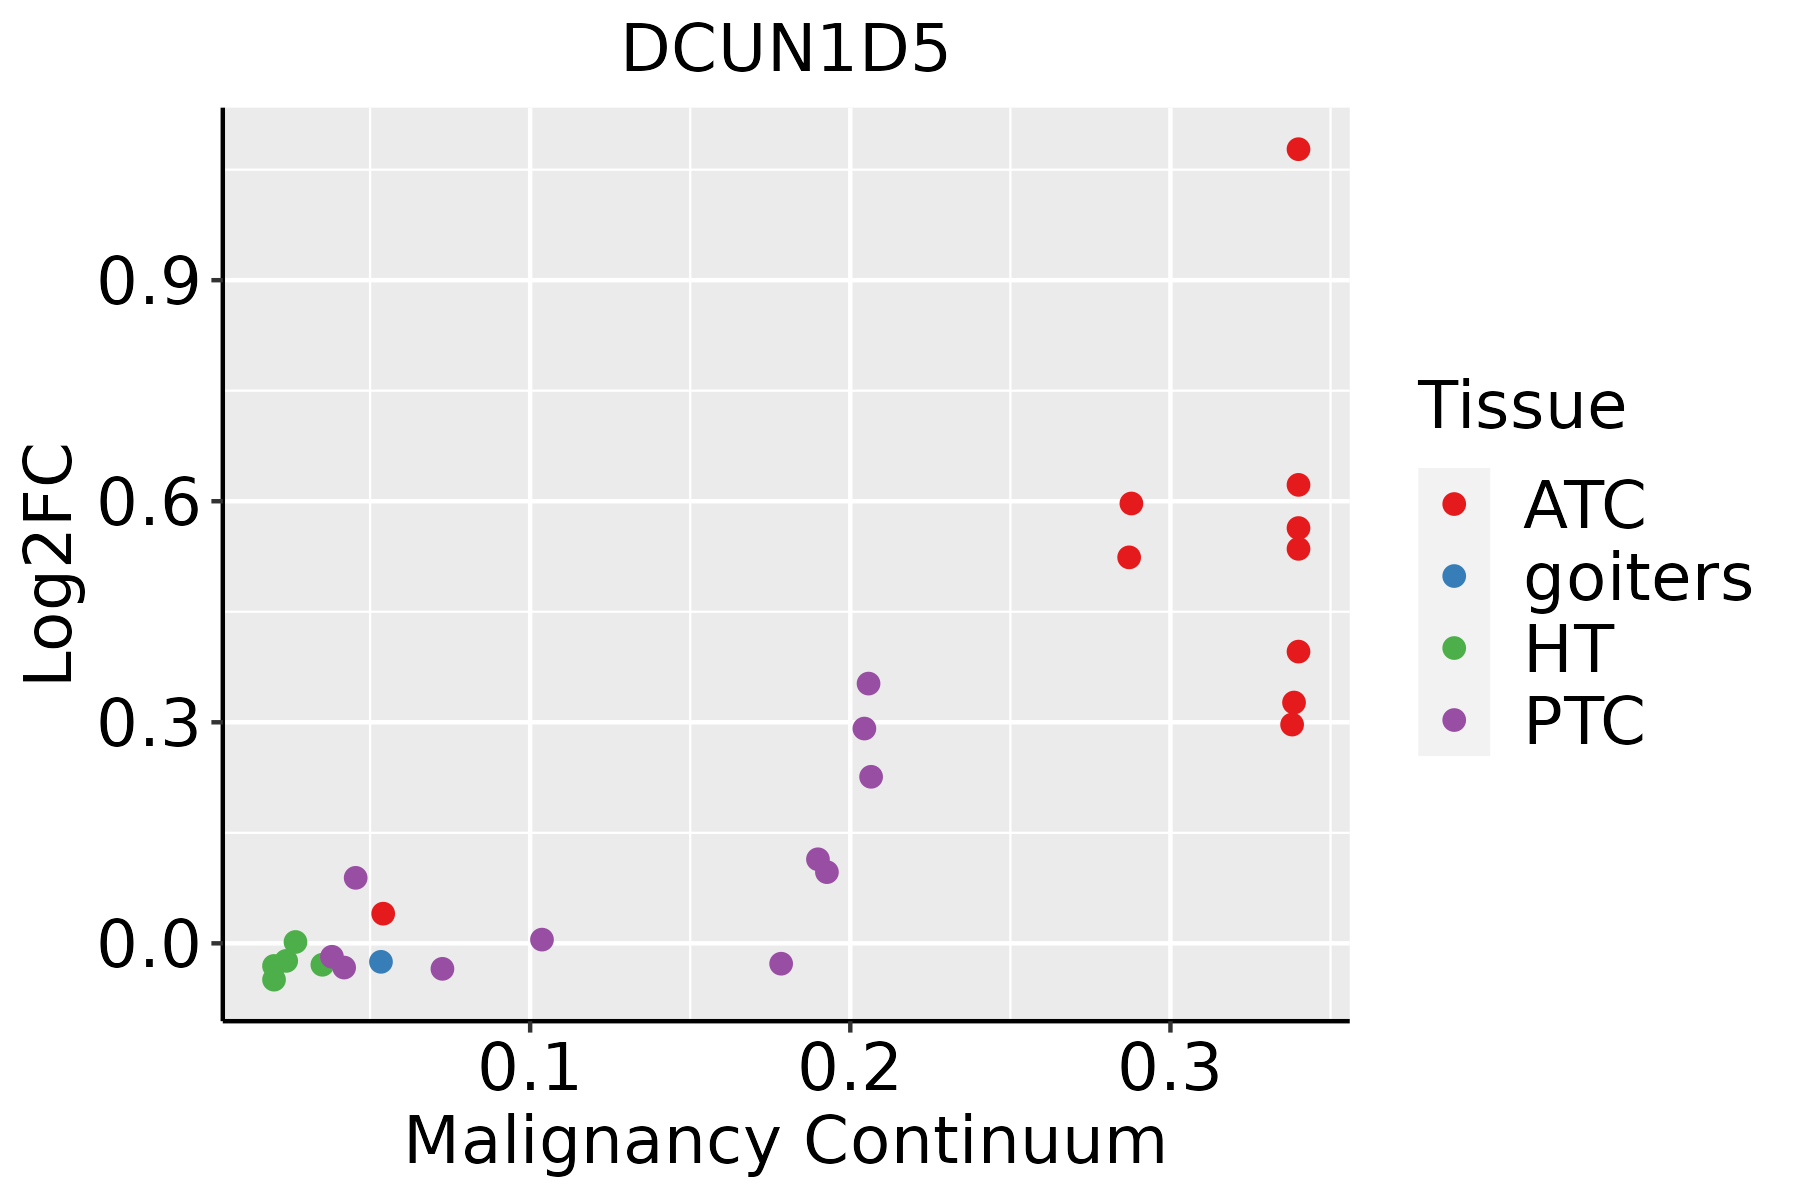 | ATC: Anaplastic thyroid cancer |
| HT: Hashimoto's thyroiditis | ||
| PTC: Papillary thyroid cancer |
| ∗log2FC in expression of this searched gene in stem-like cells from each diseased tissue sample relative to stem-like cells in normal samples in each tissue plotted against the malignancy continuum. Samples are colored based on if they are from different disease stage. |
Top |
Malignant transformation related pathway analysis |
| Find out the enriched GO biological processes and KEGG pathways involved in transition from healthy to precancer to cancer |
| Tissue | Disease Stage | Enriched GO biological Processes |
| Colorectum | AD |  |
| Colorectum | SER |  |
| Colorectum | MSS |  |
| Colorectum | MSI-H |  |
| Colorectum | FAP |  |
| ∗Top 15 enriched GO BP terms are showed in the bar plot of each disease state in each tissue. Each row represents a significant GO biological process which is colored according to the -log10(p.adjust). |
| Page: 1 2 3 4 5 6 7 8 9 |
| GO ID | Tissue | Disease Stage | Description | Gene Ratio | Bg Ratio | pvalue | p.adjust | Count |
| GO:190332027 | Esophagus | HGIN | regulation of protein modification by small protein conjugation or removal | 78/2587 | 242/18723 | 1.40e-13 | 2.26e-11 | 78 |
| GO:003139627 | Esophagus | HGIN | regulation of protein ubiquitination | 64/2587 | 210/18723 | 3.02e-10 | 2.71e-08 | 64 |
| GO:19033228 | Esophagus | HGIN | positive regulation of protein modification by small protein conjugation or removal | 35/2587 | 138/18723 | 2.11e-04 | 3.88e-03 | 35 |
| GO:001604919 | Esophagus | HGIN | cell growth | 93/2587 | 482/18723 | 4.49e-04 | 6.62e-03 | 93 |
| GO:00451166 | Esophagus | HGIN | protein neddylation | 8/2587 | 18/18723 | 1.58e-03 | 1.79e-02 | 8 |
| GO:00313987 | Esophagus | HGIN | positive regulation of protein ubiquitination | 28/2587 | 119/18723 | 2.89e-03 | 2.81e-02 | 28 |
| GO:000155818 | Esophagus | HGIN | regulation of cell growth | 76/2587 | 414/18723 | 5.40e-03 | 4.42e-02 | 76 |
| GO:1903320111 | Esophagus | ESCC | regulation of protein modification by small protein conjugation or removal | 181/8552 | 242/18723 | 1.80e-20 | 2.60e-18 | 181 |
| GO:0031396111 | Esophagus | ESCC | regulation of protein ubiquitination | 154/8552 | 210/18723 | 2.70e-16 | 2.04e-14 | 154 |
| GO:0016049110 | Esophagus | ESCC | cell growth | 289/8552 | 482/18723 | 1.29e-10 | 3.77e-09 | 289 |
| GO:190332216 | Esophagus | ESCC | positive regulation of protein modification by small protein conjugation or removal | 99/8552 | 138/18723 | 4.39e-10 | 1.16e-08 | 99 |
| GO:000155819 | Esophagus | ESCC | regulation of cell growth | 248/8552 | 414/18723 | 2.97e-09 | 6.45e-08 | 248 |
| GO:003139816 | Esophagus | ESCC | positive regulation of protein ubiquitination | 82/8552 | 119/18723 | 2.41e-07 | 3.64e-06 | 82 |
| GO:005143819 | Esophagus | ESCC | regulation of ubiquitin-protein transferase activity | 38/8552 | 53/18723 | 1.10e-04 | 7.69e-04 | 38 |
| GO:004511614 | Esophagus | ESCC | protein neddylation | 15/8552 | 18/18723 | 1.20e-03 | 5.88e-03 | 15 |
| GO:00514433 | Esophagus | ESCC | positive regulation of ubiquitin-protein transferase activity | 21/8552 | 31/18723 | 1.10e-02 | 3.70e-02 | 21 |
| GO:190332012 | Liver | Cirrhotic | regulation of protein modification by small protein conjugation or removal | 105/4634 | 242/18723 | 1.43e-10 | 7.43e-09 | 105 |
| GO:003139612 | Liver | Cirrhotic | regulation of protein ubiquitination | 89/4634 | 210/18723 | 1.40e-08 | 5.30e-07 | 89 |
| GO:001604911 | Liver | Cirrhotic | cell growth | 160/4634 | 482/18723 | 1.50e-05 | 2.07e-04 | 160 |
| GO:19033222 | Liver | Cirrhotic | positive regulation of protein modification by small protein conjugation or removal | 52/4634 | 138/18723 | 4.91e-04 | 3.94e-03 | 52 |
| Page: 1 2 3 4 5 |
| Pathway ID | Tissue | Disease Stage | Description | Gene Ratio | Bg Ratio | pvalue | p.adjust | qvalue | Count |
| Page: 1 |
Top |
Cell-cell communication analysis |
| Identification of potential cell-cell interactions between two cell types and their ligand-receptor pairs for different disease states |
| Ligand | Receptor | LRpair | Pathway | Tissue | Disease Stage |
| Page: 1 |
Top |
Single-cell gene regulatory network inference analysis |
| Find out the significant the regulons (TFs) and the target genes of each regulon across cell types for different disease states |
| TF | Cell Type | Tissue | Disease Stage | Target Gene | RSS | Regulon Activity |
| ∗The dot plots of a searched regulon are shown for all cell subpopulations in each disease state of each tissue based on the regulon specific score inferred using pySCENIC and by calculating the average expression. |
| Page: 1 |
Top |
Somatic mutation of malignant transformation related genes |
| Annotation of somatic variants for genes involved in malignant transformation |
| Hugo Symbol | Variant Class | Variant Classification | dbSNP RS | HGVSc | HGVSp | HGVSp Short | SWISSPROT | BIOTYPE | SIFT | PolyPhen | Tumor Sample Barcode | Tissue | Histology | Sex | Age | Stage | Therapy Types | Drugs | Outcome |
| DCUN1D5 | SNV | Missense_Mutation | c.643G>A | p.Asp215Asn | p.D215N | Q9BTE7 | protein_coding | deleterious(0) | probably_damaging(0.999) | TCGA-E2-A1IN-01 | Breast | breast invasive carcinoma | Female | <65 | I/II | Hormone Therapy | arimidex | SD | |
| DCUN1D5 | SNV | Missense_Mutation | novel | c.400G>A | p.Asp134Asn | p.D134N | Q9BTE7 | protein_coding | tolerated(0.05) | possibly_damaging(0.856) | TCGA-C5-A8XK-01 | Cervix | cervical & endocervical cancer | Female | <65 | I/II | Chemotherapy | cisplatin | SD |
| DCUN1D5 | SNV | Missense_Mutation | c.184N>A | p.Asp62Asn | p.D62N | Q9BTE7 | protein_coding | tolerated(0.11) | benign(0.259) | TCGA-EK-A3GK-01 | Cervix | cervical & endocervical cancer | Female | <65 | I/II | Unknown | Unknown | SD | |
| DCUN1D5 | SNV | Missense_Mutation | rs774048924 | c.407N>T | p.Ser136Leu | p.S136L | Q9BTE7 | protein_coding | tolerated(0.67) | benign(0.005) | TCGA-AG-3892-01 | Colorectum | rectum adenocarcinoma | Female | <65 | I/II | Unknown | Unknown | SD |
| DCUN1D5 | SNV | Missense_Mutation | rs778617984 | c.26C>T | p.Ser9Phe | p.S9F | Q9BTE7 | protein_coding | deleterious(0.03) | benign(0.092) | TCGA-F5-6814-01 | Colorectum | rectum adenocarcinoma | Male | <65 | I/II | Unknown | Unknown | SD |
| DCUN1D5 | SNV | Missense_Mutation | rs774048924 | c.407C>T | p.Ser136Leu | p.S136L | Q9BTE7 | protein_coding | tolerated(0.67) | benign(0.005) | TCGA-AJ-A3EL-01 | Endometrium | uterine corpus endometrioid carcinoma | Female | <65 | I/II | Unknown | Unknown | SD |
| DCUN1D5 | SNV | Missense_Mutation | novel | c.131A>G | p.Glu44Gly | p.E44G | Q9BTE7 | protein_coding | deleterious(0.04) | benign(0.044) | TCGA-AX-A06F-01 | Endometrium | uterine corpus endometrioid carcinoma | Female | <65 | III/IV | Chemotherapy | carboplatin | SD |
| DCUN1D5 | SNV | Missense_Mutation | novel | c.98N>A | p.Ser33Tyr | p.S33Y | Q9BTE7 | protein_coding | deleterious(0.02) | possibly_damaging(0.615) | TCGA-AX-A2HC-01 | Endometrium | uterine corpus endometrioid carcinoma | Female | <65 | III/IV | Chemotherapy | paclitaxel | PD |
| DCUN1D5 | SNV | Missense_Mutation | novel | c.389N>T | p.Ser130Leu | p.S130L | Q9BTE7 | protein_coding | deleterious(0.04) | benign(0.02) | TCGA-BG-A221-01 | Endometrium | uterine corpus endometrioid carcinoma | Female | >=65 | I/II | Unknown | Unknown | SD |
| DCUN1D5 | SNV | Missense_Mutation | c.487N>G | p.Lys163Glu | p.K163E | Q9BTE7 | protein_coding | tolerated(0.29) | possibly_damaging(0.842) | TCGA-D1-A17R-01 | Endometrium | uterine corpus endometrioid carcinoma | Female | <65 | I/II | Unknown | Unknown | SD |
| Page: 1 2 |
Top |
Related drugs of malignant transformation related genes |
| Identification of chemicals and drugs interact with genes involved in malignant transfromation |
| (DGIdb 4.0) |
| Entrez ID | Symbol | Category | Interaction Types | Drug Claim Name | Drug Name | PMIDs |
| Page: 1 |

Copyright 2023-Present -The University of Texas Health Science Center at Houston |