
|
|||||
|
 | |
| |
| |
| |
| |
| |
|
Gene: DCUN1D2 |
Gene summary for DCUN1D2 |
| Gene information | Species | Human | Gene symbol | DCUN1D2 | Gene ID | 55208 |
| Gene name | defective in cullin neddylation 1 domain containing 2 | |
| Gene Alias | C13orf17 | |
| Cytomap | 13q34 | |
| Gene Type | protein-coding | GO ID | GO:0006464 | UniProtAcc | Q6PH85 |
Top |
Malignant transformation analysis |
| Identification of the aberrant gene expression in precancerous and cancerous lesions by comparing the gene expression of stem-like cells in diseased tissues with normal stem cells |
| Entrez ID | Symbol | Replicates | Species | Organ | Tissue | Adj P-value | Log2FC | Malignancy |
| 55208 | DCUN1D2 | HCC1_Meng | Human | Liver | HCC | 2.06e-07 | -2.99e-02 | 0.0246 |
| 55208 | DCUN1D2 | HCC1 | Human | Liver | HCC | 2.95e-07 | 1.87e+00 | 0.5336 |
| 55208 | DCUN1D2 | HCC2 | Human | Liver | HCC | 3.16e-24 | 2.41e+00 | 0.5341 |
| 55208 | DCUN1D2 | HCC5 | Human | Liver | HCC | 2.29e-09 | 1.41e+00 | 0.4932 |
| Page: 1 |
| Tissue | Expression Dynamics | Abbreviation |
| Liver | 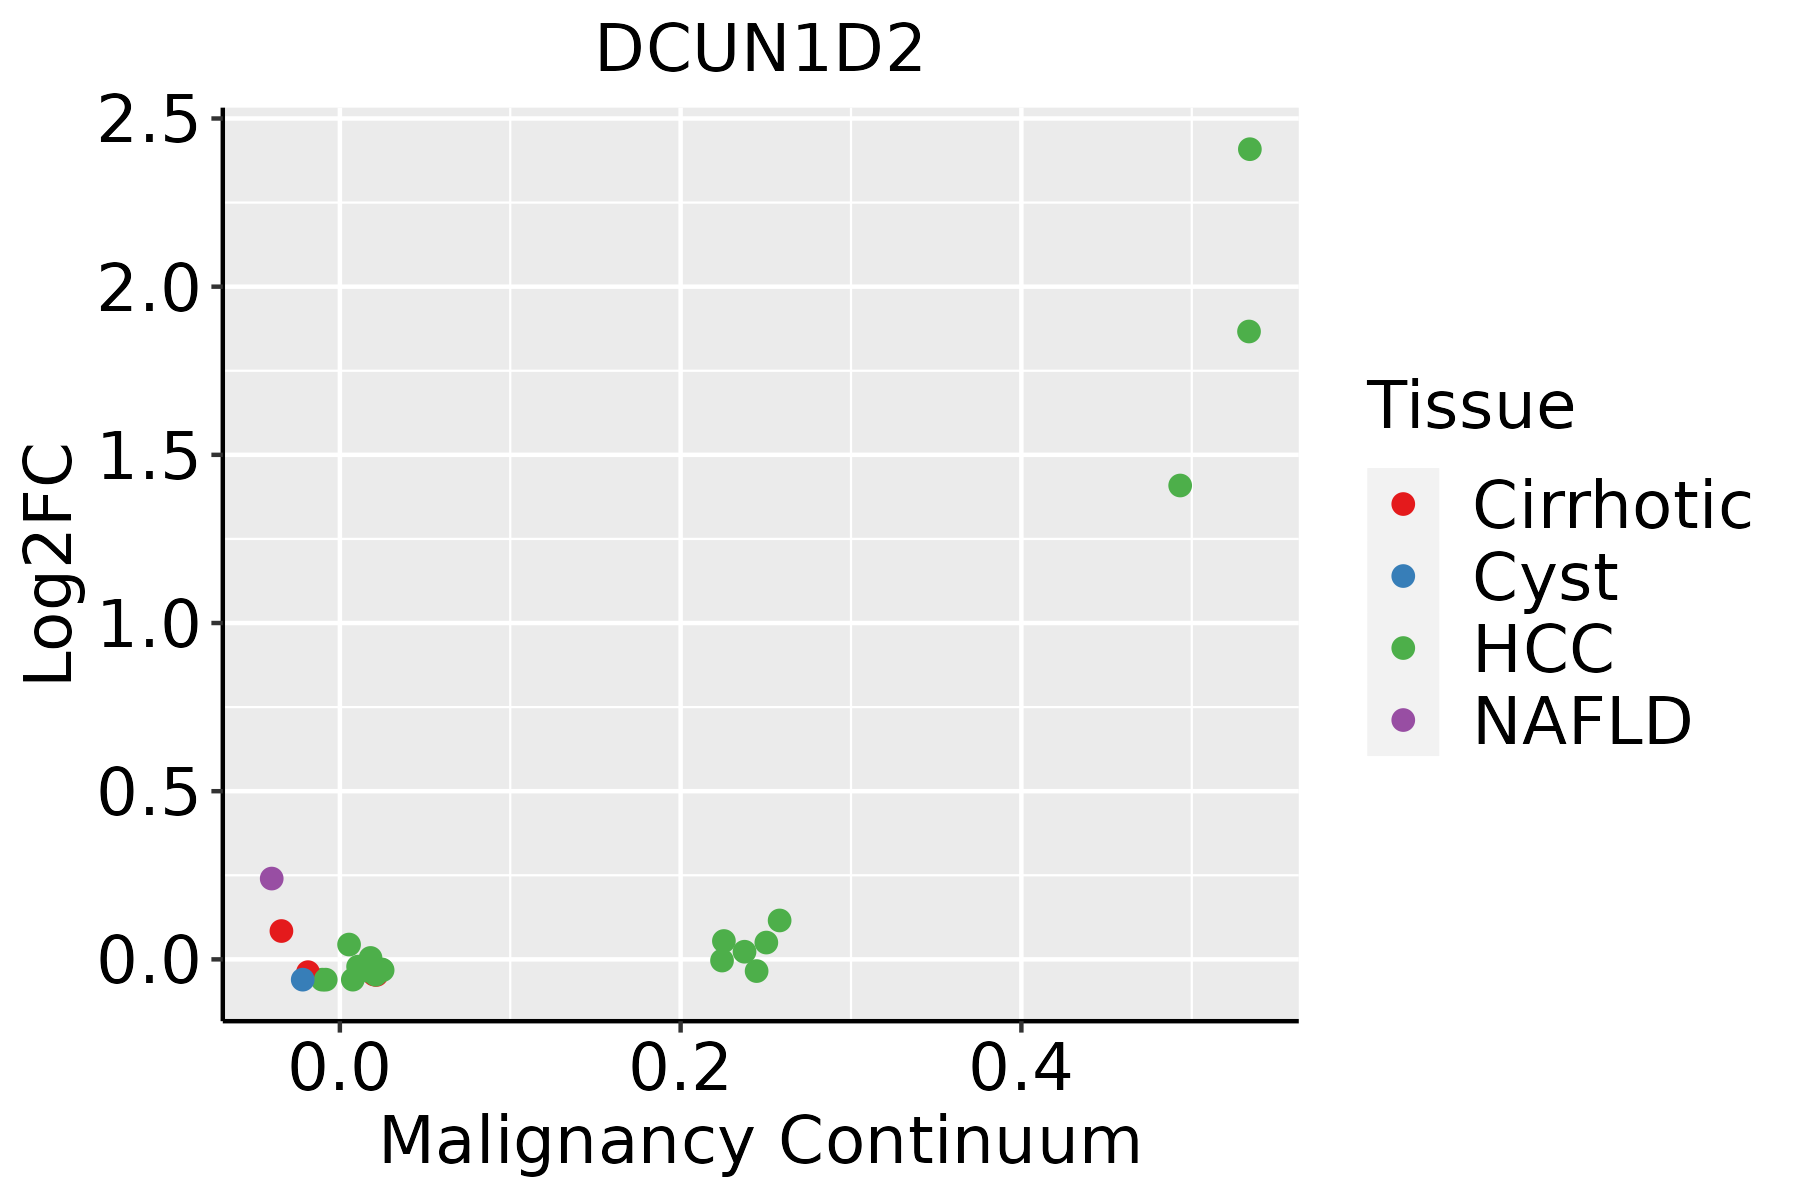 | HCC: Hepatocellular carcinoma |
| NAFLD: Non-alcoholic fatty liver disease |
| ∗log2FC in expression of this searched gene in stem-like cells from each diseased tissue sample relative to stem-like cells in normal samples in each tissue plotted against the malignancy continuum. Samples are colored based on if they are from different disease stage. |
Top |
Malignant transformation related pathway analysis |
| Find out the enriched GO biological processes and KEGG pathways involved in transition from healthy to precancer to cancer |
| Tissue | Disease Stage | Enriched GO biological Processes |
| Colorectum | AD |  |
| Colorectum | SER |  |
| Colorectum | MSS |  |
| Colorectum | MSI-H |  |
| Colorectum | FAP |  |
| ∗Top 15 enriched GO BP terms are showed in the bar plot of each disease state in each tissue. Each row represents a significant GO biological process which is colored according to the -log10(p.adjust). |
| Page: 1 2 3 4 5 6 7 8 9 |
| GO ID | Tissue | Disease Stage | Description | Gene Ratio | Bg Ratio | pvalue | p.adjust | Count |
| GO:190332022 | Liver | HCC | regulation of protein modification by small protein conjugation or removal | 167/7958 | 242/18723 | 4.99e-17 | 4.72e-15 | 167 |
| GO:003139622 | Liver | HCC | regulation of protein ubiquitination | 142/7958 | 210/18723 | 1.39e-13 | 7.81e-12 | 142 |
| GO:19033221 | Liver | HCC | positive regulation of protein modification by small protein conjugation or removal | 94/7958 | 138/18723 | 9.87e-10 | 3.01e-08 | 94 |
| GO:00313981 | Liver | HCC | positive regulation of protein ubiquitination | 79/7958 | 119/18723 | 1.18e-07 | 2.26e-06 | 79 |
| GO:005143821 | Liver | HCC | regulation of ubiquitin-protein transferase activity | 36/7958 | 53/18723 | 1.62e-04 | 1.29e-03 | 36 |
| GO:00451161 | Liver | HCC | protein neddylation | 15/7958 | 18/18723 | 4.74e-04 | 3.12e-03 | 15 |
| GO:0051443 | Liver | HCC | positive regulation of ubiquitin-protein transferase activity | 21/7958 | 31/18723 | 4.01e-03 | 1.76e-02 | 21 |
| Page: 1 |
| Pathway ID | Tissue | Disease Stage | Description | Gene Ratio | Bg Ratio | pvalue | p.adjust | qvalue | Count |
| Page: 1 |
Top |
Cell-cell communication analysis |
| Identification of potential cell-cell interactions between two cell types and their ligand-receptor pairs for different disease states |
| Ligand | Receptor | LRpair | Pathway | Tissue | Disease Stage |
| Page: 1 |
Top |
Single-cell gene regulatory network inference analysis |
| Find out the significant the regulons (TFs) and the target genes of each regulon across cell types for different disease states |
| TF | Cell Type | Tissue | Disease Stage | Target Gene | RSS | Regulon Activity |
| ∗The dot plots of a searched regulon are shown for all cell subpopulations in each disease state of each tissue based on the regulon specific score inferred using pySCENIC and by calculating the average expression. |
| Page: 1 |
Top |
Somatic mutation of malignant transformation related genes |
| Annotation of somatic variants for genes involved in malignant transformation |
| Hugo Symbol | Variant Class | Variant Classification | dbSNP RS | HGVSc | HGVSp | HGVSp Short | SWISSPROT | BIOTYPE | SIFT | PolyPhen | Tumor Sample Barcode | Tissue | Histology | Sex | Age | Stage | Therapy Types | Drugs | Outcome |
| DCUN1D2 | SNV | Missense_Mutation | c.149N>T | p.Ser50Leu | p.S50L | Q6PH85 | protein_coding | tolerated(1) | benign(0) | TCGA-B6-A0RO-01 | Breast | breast invasive carcinoma | Female | >=65 | III/IV | Unknown | Unknown | SD | |
| DCUN1D2 | SNV | Missense_Mutation | c.460T>C | p.Phe154Leu | p.F154L | Q6PH85 | protein_coding | deleterious(0.01) | probably_damaging(0.964) | TCGA-C8-A130-01 | Breast | breast invasive carcinoma | Female | <65 | III/IV | Unknown | Unknown | SD | |
| DCUN1D2 | insertion | Nonsense_Mutation | novel | c.586_587insAATGTTTTTTAAAATTGGTGCCAG | p.Trp196delinsTer | p.W196delins* | Q6PH85 | protein_coding | TCGA-B6-A0IA-01 | Breast | breast invasive carcinoma | Female | <65 | I/II | Unknown | Unknown | SD | ||
| DCUN1D2 | SNV | Missense_Mutation | novel | c.337A>G | p.Thr113Ala | p.T113A | Q6PH85 | protein_coding | deleterious(0.04) | benign(0.058) | TCGA-2W-A8YY-01 | Cervix | cervical & endocervical cancer | Female | <65 | I/II | Chemotherapy | cisplatin | CR |
| DCUN1D2 | SNV | Missense_Mutation | c.356N>T | p.Arg119Ile | p.R119I | Q6PH85 | protein_coding | deleterious(0) | benign(0.115) | TCGA-FU-A3HZ-01 | Cervix | cervical & endocervical cancer | Female | <65 | I/II | Chemotherapy | cisplatin | CR | |
| DCUN1D2 | SNV | Missense_Mutation | c.470N>G | p.Phe157Cys | p.F157C | Q6PH85 | protein_coding | deleterious(0) | probably_damaging(0.977) | TCGA-AA-3977-01 | Colorectum | colon adenocarcinoma | Male | >=65 | I/II | Unknown | Unknown | SD | |
| DCUN1D2 | SNV | Missense_Mutation | novel | c.463A>G | p.Lys155Glu | p.K155E | Q6PH85 | protein_coding | deleterious(0.02) | possibly_damaging(0.615) | TCGA-AA-A010-01 | Colorectum | colon adenocarcinoma | Female | <65 | I/II | Chemotherapy | folinic | CR |
| DCUN1D2 | SNV | Missense_Mutation | c.92N>T | p.Thr31Met | p.T31M | Q6PH85 | protein_coding | tolerated(0.12) | benign(0.011) | TCGA-AG-4021-01 | Colorectum | rectum adenocarcinoma | Female | >=65 | III/IV | Unknown | Unknown | PD | |
| DCUN1D2 | SNV | Missense_Mutation | rs772546123 | c.766N>T | p.Arg256Cys | p.R256C | Q6PH85 | protein_coding | deleterious(0.02) | possibly_damaging(0.513) | TCGA-A5-A0G2-01 | Endometrium | uterine corpus endometrioid carcinoma | Female | <65 | III/IV | Unknown | Unknown | SD |
| DCUN1D2 | SNV | Missense_Mutation | novel | c.625N>T | p.Pro209Ser | p.P209S | Q6PH85 | protein_coding | tolerated(0.68) | benign(0.054) | TCGA-A5-A0G2-01 | Endometrium | uterine corpus endometrioid carcinoma | Female | <65 | III/IV | Unknown | Unknown | SD |
| Page: 1 2 3 4 |
Top |
Related drugs of malignant transformation related genes |
| Identification of chemicals and drugs interact with genes involved in malignant transfromation |
| (DGIdb 4.0) |
| Entrez ID | Symbol | Category | Interaction Types | Drug Claim Name | Drug Name | PMIDs |
| Page: 1 |

Copyright 2023-Present -The University of Texas Health Science Center at Houston |