
|
|||||
|
 | |
| |
| |
| |
| |
| |
|
Gene: DCUN1D1 |
Gene summary for DCUN1D1 |
| Gene information | Species | Human | Gene symbol | DCUN1D1 | Gene ID | 54165 |
| Gene name | defective in cullin neddylation 1 domain containing 1 | |
| Gene Alias | DCNL1 | |
| Cytomap | 3q26.33 | |
| Gene Type | protein-coding | GO ID | GO:0006464 | UniProtAcc | C9JVE2 |
Top |
Malignant transformation analysis |
| Identification of the aberrant gene expression in precancerous and cancerous lesions by comparing the gene expression of stem-like cells in diseased tissues with normal stem cells |
| Entrez ID | Symbol | Replicates | Species | Organ | Tissue | Adj P-value | Log2FC | Malignancy |
| 54165 | DCUN1D1 | LZE2T | Human | Esophagus | ESCC | 5.03e-03 | 8.34e-01 | 0.082 |
| 54165 | DCUN1D1 | LZE4T | Human | Esophagus | ESCC | 2.55e-20 | 5.78e-01 | 0.0811 |
| 54165 | DCUN1D1 | LZE7T | Human | Esophagus | ESCC | 1.84e-05 | 4.11e-01 | 0.0667 |
| 54165 | DCUN1D1 | LZE8T | Human | Esophagus | ESCC | 3.29e-02 | 2.21e-01 | 0.067 |
| 54165 | DCUN1D1 | LZE20T | Human | Esophagus | ESCC | 4.90e-05 | 1.13e-01 | 0.0662 |
| 54165 | DCUN1D1 | LZE24T | Human | Esophagus | ESCC | 3.41e-18 | 3.89e-01 | 0.0596 |
| 54165 | DCUN1D1 | LZE21T | Human | Esophagus | ESCC | 2.96e-03 | 4.14e-01 | 0.0655 |
| 54165 | DCUN1D1 | LZE6T | Human | Esophagus | ESCC | 3.82e-03 | 4.34e-01 | 0.0845 |
| 54165 | DCUN1D1 | P1T-E | Human | Esophagus | ESCC | 1.06e-05 | 4.30e-01 | 0.0875 |
| 54165 | DCUN1D1 | P2T-E | Human | Esophagus | ESCC | 7.07e-47 | 8.61e-01 | 0.1177 |
| 54165 | DCUN1D1 | P4T-E | Human | Esophagus | ESCC | 2.48e-36 | 9.08e-01 | 0.1323 |
| 54165 | DCUN1D1 | P5T-E | Human | Esophagus | ESCC | 7.96e-28 | 3.95e-01 | 0.1327 |
| 54165 | DCUN1D1 | P8T-E | Human | Esophagus | ESCC | 1.53e-35 | 5.92e-01 | 0.0889 |
| 54165 | DCUN1D1 | P9T-E | Human | Esophagus | ESCC | 9.42e-22 | 4.52e-01 | 0.1131 |
| 54165 | DCUN1D1 | P10T-E | Human | Esophagus | ESCC | 4.48e-34 | 6.71e-01 | 0.116 |
| 54165 | DCUN1D1 | P11T-E | Human | Esophagus | ESCC | 6.79e-16 | 6.92e-01 | 0.1426 |
| 54165 | DCUN1D1 | P12T-E | Human | Esophagus | ESCC | 1.32e-101 | 2.00e+00 | 0.1122 |
| 54165 | DCUN1D1 | P15T-E | Human | Esophagus | ESCC | 8.43e-36 | 8.52e-01 | 0.1149 |
| 54165 | DCUN1D1 | P16T-E | Human | Esophagus | ESCC | 1.45e-27 | 5.35e-01 | 0.1153 |
| 54165 | DCUN1D1 | P17T-E | Human | Esophagus | ESCC | 3.17e-08 | 2.19e-01 | 0.1278 |
| Page: 1 2 3 4 5 |
| Tissue | Expression Dynamics | Abbreviation |
| Esophagus |  | ESCC: Esophageal squamous cell carcinoma |
| HGIN: High-grade intraepithelial neoplasias | ||
| LGIN: Low-grade intraepithelial neoplasias | ||
| Oral Cavity |  | EOLP: Erosive Oral lichen planus |
| LP: leukoplakia | ||
| NEOLP: Non-erosive oral lichen planus | ||
| OSCC: Oral squamous cell carcinoma | ||
| Skin | 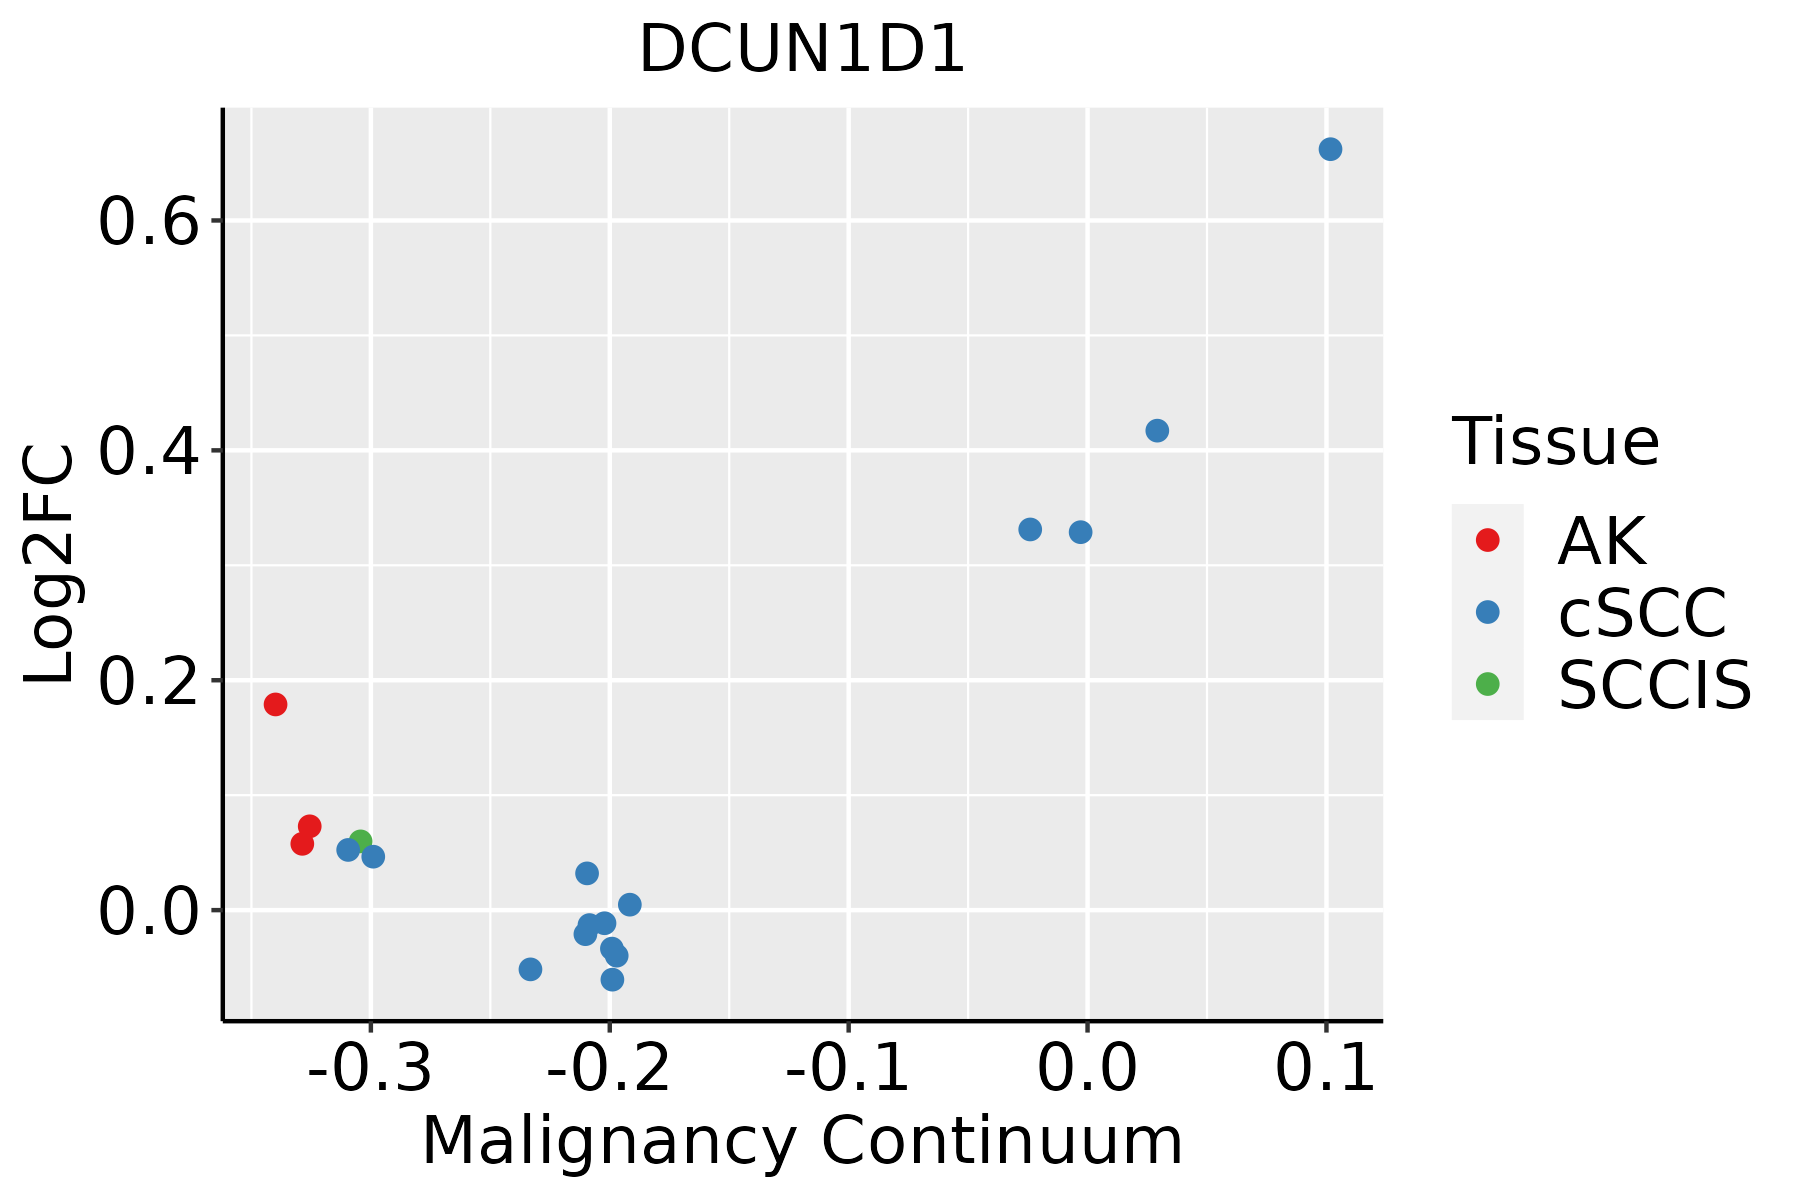 | AK: Actinic keratosis |
| cSCC: Cutaneous squamous cell carcinoma | ||
| SCCIS:squamous cell carcinoma in situ | ||
| Thyroid | 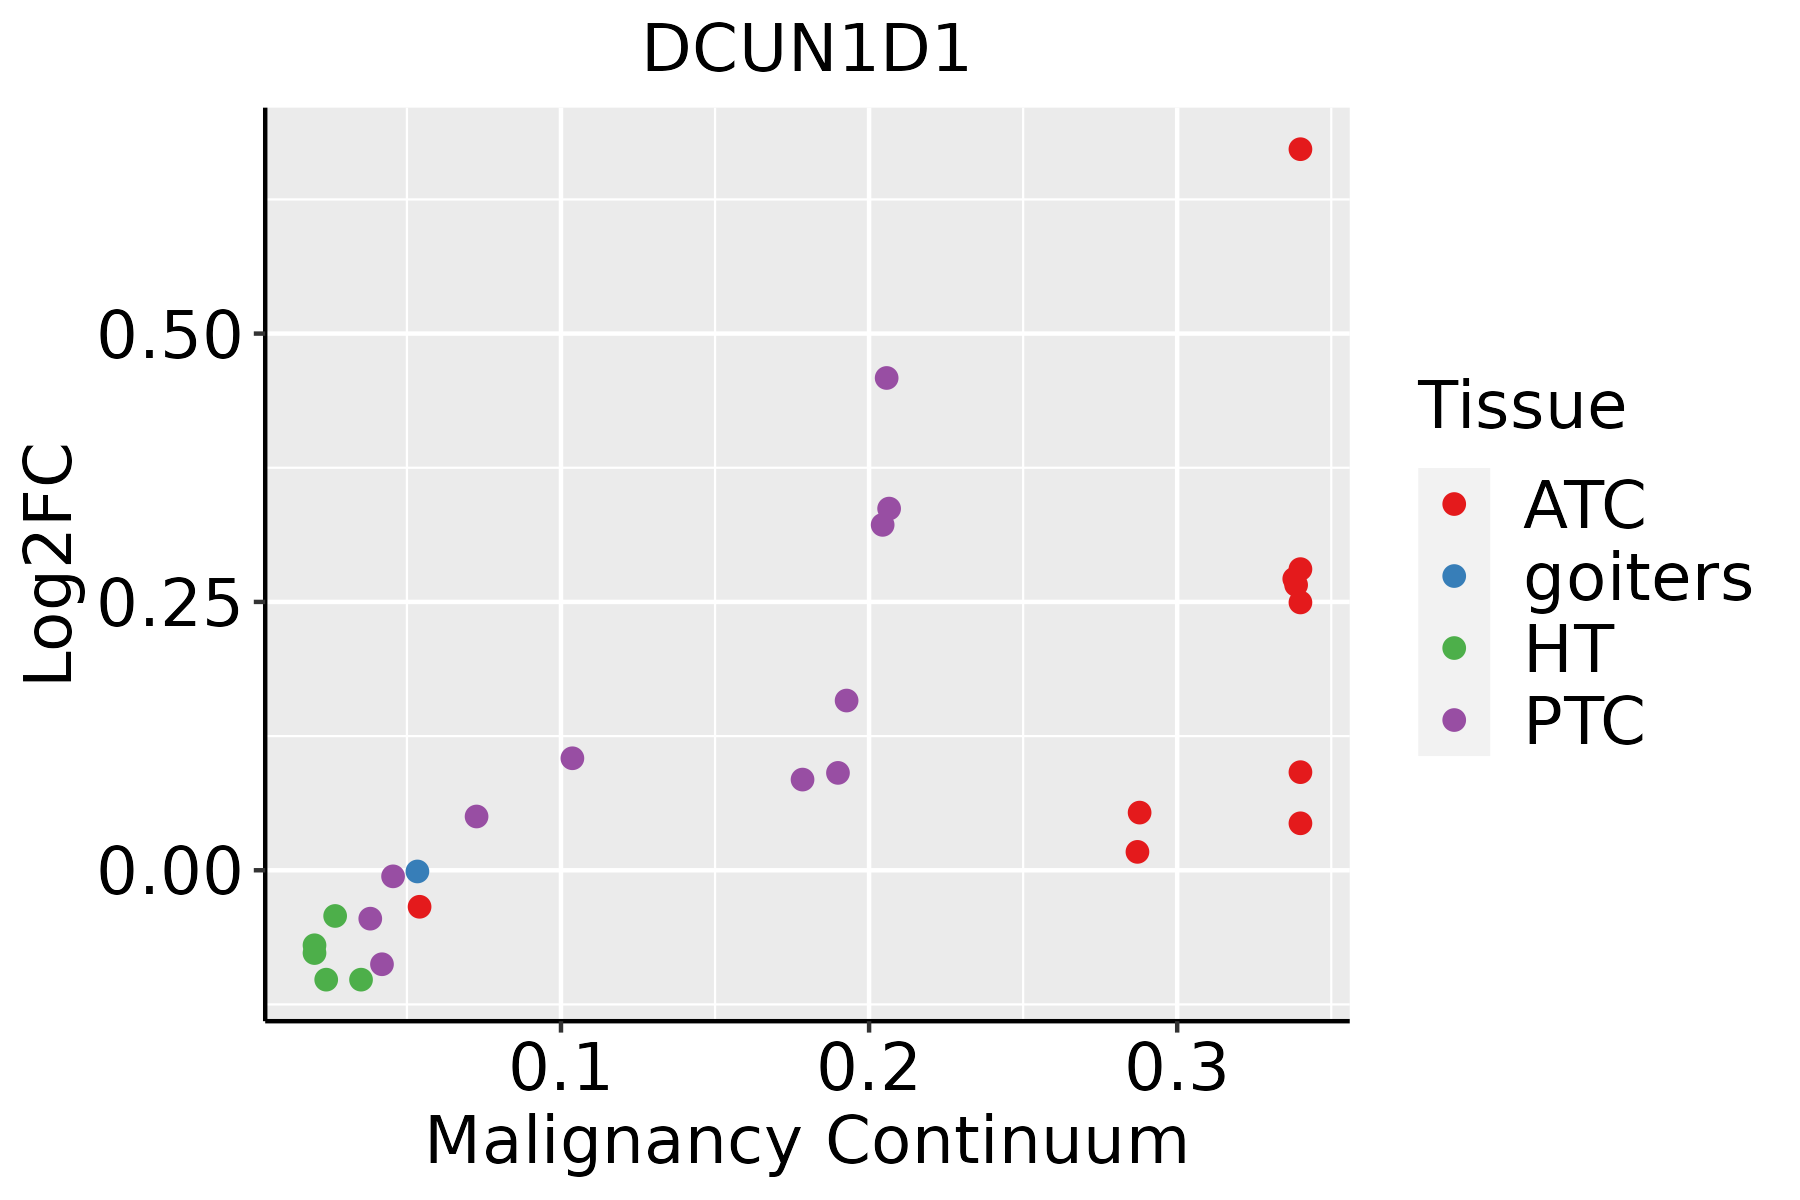 | ATC: Anaplastic thyroid cancer |
| HT: Hashimoto's thyroiditis | ||
| PTC: Papillary thyroid cancer |
| ∗log2FC in expression of this searched gene in stem-like cells from each diseased tissue sample relative to stem-like cells in normal samples in each tissue plotted against the malignancy continuum. Samples are colored based on if they are from different disease stage. |
Top |
Malignant transformation related pathway analysis |
| Find out the enriched GO biological processes and KEGG pathways involved in transition from healthy to precancer to cancer |
| Tissue | Disease Stage | Enriched GO biological Processes |
| Colorectum | AD |  |
| Colorectum | SER |  |
| Colorectum | MSS |  |
| Colorectum | MSI-H |  |
| Colorectum | FAP |  |
| ∗Top 15 enriched GO BP terms are showed in the bar plot of each disease state in each tissue. Each row represents a significant GO biological process which is colored according to the -log10(p.adjust). |
| Page: 1 2 3 4 5 6 7 8 9 |
| GO ID | Tissue | Disease Stage | Description | Gene Ratio | Bg Ratio | pvalue | p.adjust | Count |
| GO:1903320111 | Esophagus | ESCC | regulation of protein modification by small protein conjugation or removal | 181/8552 | 242/18723 | 1.80e-20 | 2.60e-18 | 181 |
| GO:0031396111 | Esophagus | ESCC | regulation of protein ubiquitination | 154/8552 | 210/18723 | 2.70e-16 | 2.04e-14 | 154 |
| GO:190332216 | Esophagus | ESCC | positive regulation of protein modification by small protein conjugation or removal | 99/8552 | 138/18723 | 4.39e-10 | 1.16e-08 | 99 |
| GO:003139816 | Esophagus | ESCC | positive regulation of protein ubiquitination | 82/8552 | 119/18723 | 2.41e-07 | 3.64e-06 | 82 |
| GO:005143819 | Esophagus | ESCC | regulation of ubiquitin-protein transferase activity | 38/8552 | 53/18723 | 1.10e-04 | 7.69e-04 | 38 |
| GO:004511614 | Esophagus | ESCC | protein neddylation | 15/8552 | 18/18723 | 1.20e-03 | 5.88e-03 | 15 |
| GO:00514433 | Esophagus | ESCC | positive regulation of ubiquitin-protein transferase activity | 21/8552 | 31/18723 | 1.10e-02 | 3.70e-02 | 21 |
| GO:190332020 | Oral cavity | OSCC | regulation of protein modification by small protein conjugation or removal | 165/7305 | 242/18723 | 2.52e-20 | 3.99e-18 | 165 |
| GO:003139620 | Oral cavity | OSCC | regulation of protein ubiquitination | 143/7305 | 210/18723 | 1.01e-17 | 9.80e-16 | 143 |
| GO:19033227 | Oral cavity | OSCC | positive regulation of protein modification by small protein conjugation or removal | 88/7305 | 138/18723 | 3.24e-09 | 7.39e-08 | 88 |
| GO:00313986 | Oral cavity | OSCC | positive regulation of protein ubiquitination | 75/7305 | 119/18723 | 9.46e-08 | 1.65e-06 | 75 |
| GO:005143810 | Oral cavity | OSCC | regulation of ubiquitin-protein transferase activity | 37/7305 | 53/18723 | 5.37e-06 | 6.04e-05 | 37 |
| GO:00451165 | Oral cavity | OSCC | protein neddylation | 13/7305 | 18/18723 | 4.45e-03 | 1.79e-02 | 13 |
| GO:1903320110 | Oral cavity | LP | regulation of protein modification by small protein conjugation or removal | 111/4623 | 242/18723 | 4.81e-13 | 4.30e-11 | 111 |
| GO:0031396110 | Oral cavity | LP | regulation of protein ubiquitination | 95/4623 | 210/18723 | 5.88e-11 | 3.61e-09 | 95 |
| GO:190332215 | Oral cavity | LP | positive regulation of protein modification by small protein conjugation or removal | 57/4623 | 138/18723 | 1.24e-05 | 2.23e-04 | 57 |
| GO:003139815 | Oral cavity | LP | positive regulation of protein ubiquitination | 47/4623 | 119/18723 | 2.46e-04 | 2.60e-03 | 47 |
| GO:005143818 | Oral cavity | LP | regulation of ubiquitin-protein transferase activity | 25/4623 | 53/18723 | 3.12e-04 | 3.17e-03 | 25 |
| GO:004511613 | Oral cavity | LP | protein neddylation | 11/4623 | 18/18723 | 1.11e-03 | 9.13e-03 | 11 |
| GO:190332028 | Skin | AK | regulation of protein modification by small protein conjugation or removal | 62/1910 | 242/18723 | 4.90e-12 | 1.04e-09 | 62 |
| Page: 1 2 3 |
| Pathway ID | Tissue | Disease Stage | Description | Gene Ratio | Bg Ratio | pvalue | p.adjust | qvalue | Count |
| Page: 1 |
Top |
Cell-cell communication analysis |
| Identification of potential cell-cell interactions between two cell types and their ligand-receptor pairs for different disease states |
| Ligand | Receptor | LRpair | Pathway | Tissue | Disease Stage |
| Page: 1 |
Top |
Single-cell gene regulatory network inference analysis |
| Find out the significant the regulons (TFs) and the target genes of each regulon across cell types for different disease states |
| TF | Cell Type | Tissue | Disease Stage | Target Gene | RSS | Regulon Activity |
| ∗The dot plots of a searched regulon are shown for all cell subpopulations in each disease state of each tissue based on the regulon specific score inferred using pySCENIC and by calculating the average expression. |
| Page: 1 |
Top |
Somatic mutation of malignant transformation related genes |
| Annotation of somatic variants for genes involved in malignant transformation |
| Hugo Symbol | Variant Class | Variant Classification | dbSNP RS | HGVSc | HGVSp | HGVSp Short | SWISSPROT | BIOTYPE | SIFT | PolyPhen | Tumor Sample Barcode | Tissue | Histology | Sex | Age | Stage | Therapy Types | Drugs | Outcome |
| DCUN1D1 | SNV | Missense_Mutation | c.576N>G | p.Phe192Leu | p.F192L | Q96GG9 | protein_coding | tolerated(0.36) | probably_damaging(0.964) | TCGA-AC-A23H-01 | Breast | breast invasive carcinoma | Female | >=65 | I/II | Unknown | Unknown | PD | |
| DCUN1D1 | SNV | Missense_Mutation | rs746842955 | c.580N>A | p.Asp194Asn | p.D194N | Q96GG9 | protein_coding | deleterious(0.03) | benign(0.013) | TCGA-AR-A256-01 | Breast | breast invasive carcinoma | Female | <65 | I/II | Chemotherapy | doxorubicin | PD |
| DCUN1D1 | SNV | Missense_Mutation | c.571N>C | p.Lys191Gln | p.K191Q | Q96GG9 | protein_coding | tolerated(0.1) | benign(0.188) | TCGA-AA-3856-01 | Colorectum | colon adenocarcinoma | Male | <65 | I/II | Unknown | Unknown | SD | |
| DCUN1D1 | SNV | Missense_Mutation | c.614N>C | p.Lys205Thr | p.K205T | Q96GG9 | protein_coding | deleterious(0.01) | probably_damaging(1) | TCGA-CA-6718-01 | Colorectum | colon adenocarcinoma | Male | <65 | I/II | Unknown | Unknown | PD | |
| DCUN1D1 | SNV | Missense_Mutation | c.67N>A | p.Glu23Lys | p.E23K | Q96GG9 | protein_coding | deleterious(0.05) | benign(0.071) | TCGA-CM-6169-01 | Colorectum | colon adenocarcinoma | Male | >=65 | I/II | Ancillary | leucovorin | SD | |
| DCUN1D1 | SNV | Missense_Mutation | c.37N>T | p.Arg13Cys | p.R13C | Q96GG9 | protein_coding | deleterious(0.04) | possibly_damaging(0.886) | TCGA-AG-A002-01 | Colorectum | rectum adenocarcinoma | Male | <65 | I/II | Unknown | Unknown | SD | |
| DCUN1D1 | SNV | Missense_Mutation | c.189N>T | p.Lys63Asn | p.K63N | Q96GG9 | protein_coding | tolerated(0.07) | possibly_damaging(0.87) | TCGA-F5-6814-01 | Colorectum | rectum adenocarcinoma | Male | <65 | I/II | Unknown | Unknown | SD | |
| DCUN1D1 | SNV | Missense_Mutation | novel | c.229N>T | p.Asp77Tyr | p.D77Y | Q96GG9 | protein_coding | tolerated(0.1) | probably_damaging(0.928) | TCGA-A5-A1OF-01 | Endometrium | uterine corpus endometrioid carcinoma | Female | <65 | I/II | Unknown | Unknown | SD |
| DCUN1D1 | SNV | Missense_Mutation | novel | c.682N>C | p.Ser228Pro | p.S228P | Q96GG9 | protein_coding | deleterious(0) | probably_damaging(0.912) | TCGA-AJ-A3EL-01 | Endometrium | uterine corpus endometrioid carcinoma | Female | <65 | I/II | Unknown | Unknown | SD |
| DCUN1D1 | SNV | Missense_Mutation | novel | c.128N>C | p.Asn43Thr | p.N43T | Q96GG9 | protein_coding | tolerated(0.36) | benign(0.014) | TCGA-AJ-A3EL-01 | Endometrium | uterine corpus endometrioid carcinoma | Female | <65 | I/II | Unknown | Unknown | SD |
| Page: 1 2 3 4 |
Top |
Related drugs of malignant transformation related genes |
| Identification of chemicals and drugs interact with genes involved in malignant transfromation |
| (DGIdb 4.0) |
| Entrez ID | Symbol | Category | Interaction Types | Drug Claim Name | Drug Name | PMIDs |
| Page: 1 |

Copyright 2023-Present -The University of Texas Health Science Center at Houston |