
|
|||||
|
 | |
| |
| |
| |
| |
| |
|
Gene: DCTPP1 |
Gene summary for DCTPP1 |
| Gene information | Species | Human | Gene symbol | DCTPP1 | Gene ID | 79077 |
| Gene name | dCTP pyrophosphatase 1 | |
| Gene Alias | CDA03 | |
| Cytomap | 16p11.2 | |
| Gene Type | protein-coding | GO ID | GO:0006139 | UniProtAcc | Q9H773 |
Top |
Malignant transformation analysis |
| Identification of the aberrant gene expression in precancerous and cancerous lesions by comparing the gene expression of stem-like cells in diseased tissues with normal stem cells |
| Entrez ID | Symbol | Replicates | Species | Organ | Tissue | Adj P-value | Log2FC | Malignancy |
| 79077 | DCTPP1 | GSM4909286 | Human | Breast | IDC | 1.02e-04 | 2.05e-01 | 0.1081 |
| 79077 | DCTPP1 | GSM4909290 | Human | Breast | IDC | 1.11e-06 | 3.50e-01 | 0.2096 |
| 79077 | DCTPP1 | GSM4909293 | Human | Breast | IDC | 2.82e-03 | 2.54e-01 | 0.1581 |
| 79077 | DCTPP1 | GSM4909296 | Human | Breast | IDC | 6.71e-09 | 3.17e-01 | 0.1524 |
| 79077 | DCTPP1 | GSM4909298 | Human | Breast | IDC | 8.68e-05 | 2.65e-01 | 0.1551 |
| 79077 | DCTPP1 | GSM4909304 | Human | Breast | IDC | 6.24e-22 | 5.19e-01 | 0.1636 |
| 79077 | DCTPP1 | GSM4909305 | Human | Breast | IDC | 9.38e-06 | 3.33e-01 | 0.0436 |
| 79077 | DCTPP1 | GSM4909306 | Human | Breast | IDC | 5.21e-16 | 4.78e-01 | 0.1564 |
| 79077 | DCTPP1 | GSM4909307 | Human | Breast | IDC | 1.19e-04 | 3.14e-01 | 0.1569 |
| 79077 | DCTPP1 | GSM4909311 | Human | Breast | IDC | 6.29e-17 | -2.20e-02 | 0.1534 |
| 79077 | DCTPP1 | GSM4909312 | Human | Breast | IDC | 9.27e-05 | 1.39e-01 | 0.1552 |
| 79077 | DCTPP1 | GSM4909317 | Human | Breast | IDC | 9.25e-14 | 4.27e-01 | 0.1355 |
| 79077 | DCTPP1 | GSM4909319 | Human | Breast | IDC | 1.19e-24 | 2.01e-01 | 0.1563 |
| 79077 | DCTPP1 | GSM4909320 | Human | Breast | IDC | 1.40e-03 | 2.30e-01 | 0.1575 |
| 79077 | DCTPP1 | GSM4909321 | Human | Breast | IDC | 4.47e-07 | 1.51e-01 | 0.1559 |
| 79077 | DCTPP1 | brca1 | Human | Breast | Precancer | 3.01e-11 | 4.44e-01 | -0.0338 |
| 79077 | DCTPP1 | brca2 | Human | Breast | Precancer | 6.37e-09 | 3.30e-01 | -0.024 |
| 79077 | DCTPP1 | brca3 | Human | Breast | Precancer | 4.10e-03 | 2.61e-01 | -0.0263 |
| 79077 | DCTPP1 | M2 | Human | Breast | IDC | 9.73e-04 | 3.53e-01 | 0.21 |
| 79077 | DCTPP1 | NCCBC14 | Human | Breast | DCIS | 4.02e-07 | 2.00e-01 | 0.2021 |
| Page: 1 2 3 4 5 6 7 8 9 |
| Tissue | Expression Dynamics | Abbreviation |
| Breast | 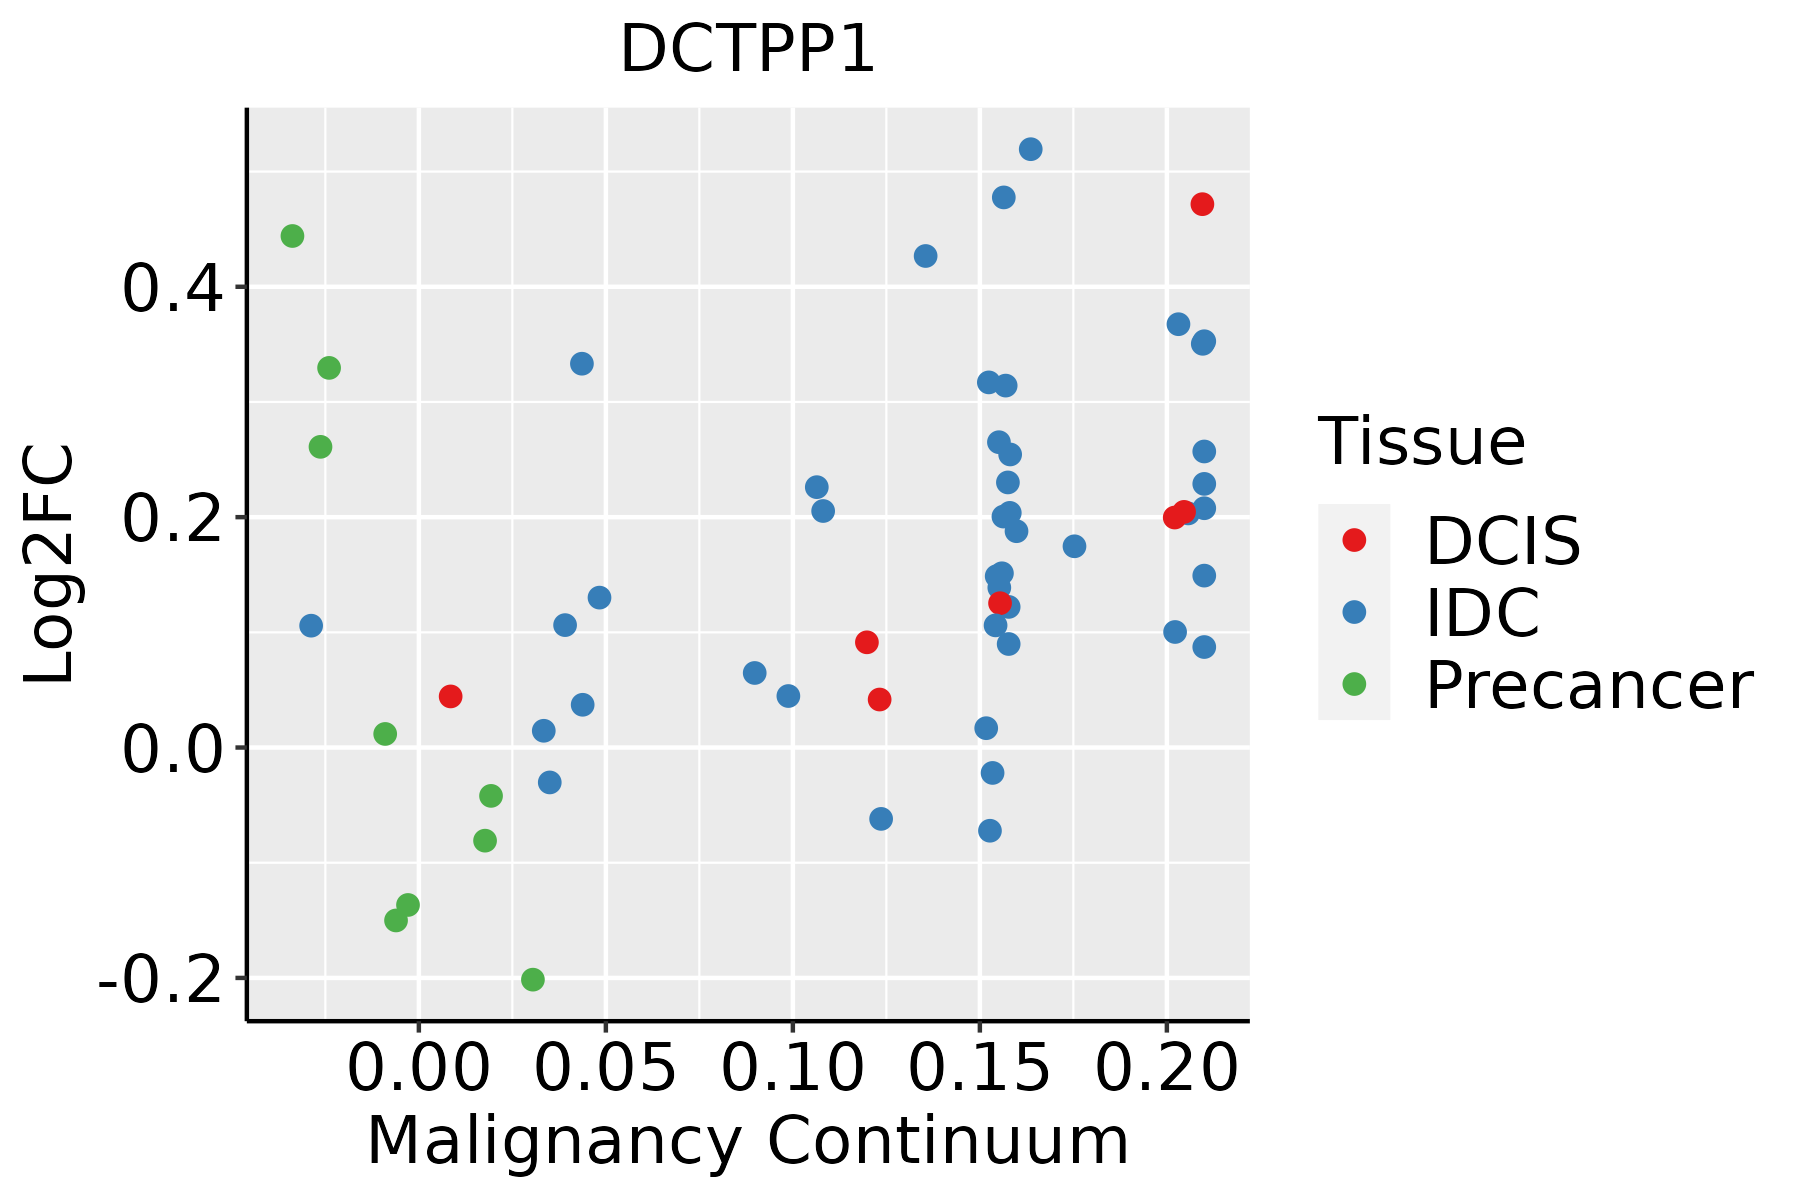 | IDC: Invasive ductal carcinoma |
| DCIS: Ductal carcinoma in situ | ||
| Precancer(BRCA1-mut): Precancerous lesion from BRCA1 mutation carriers | ||
| Colorectum (GSE201348) | 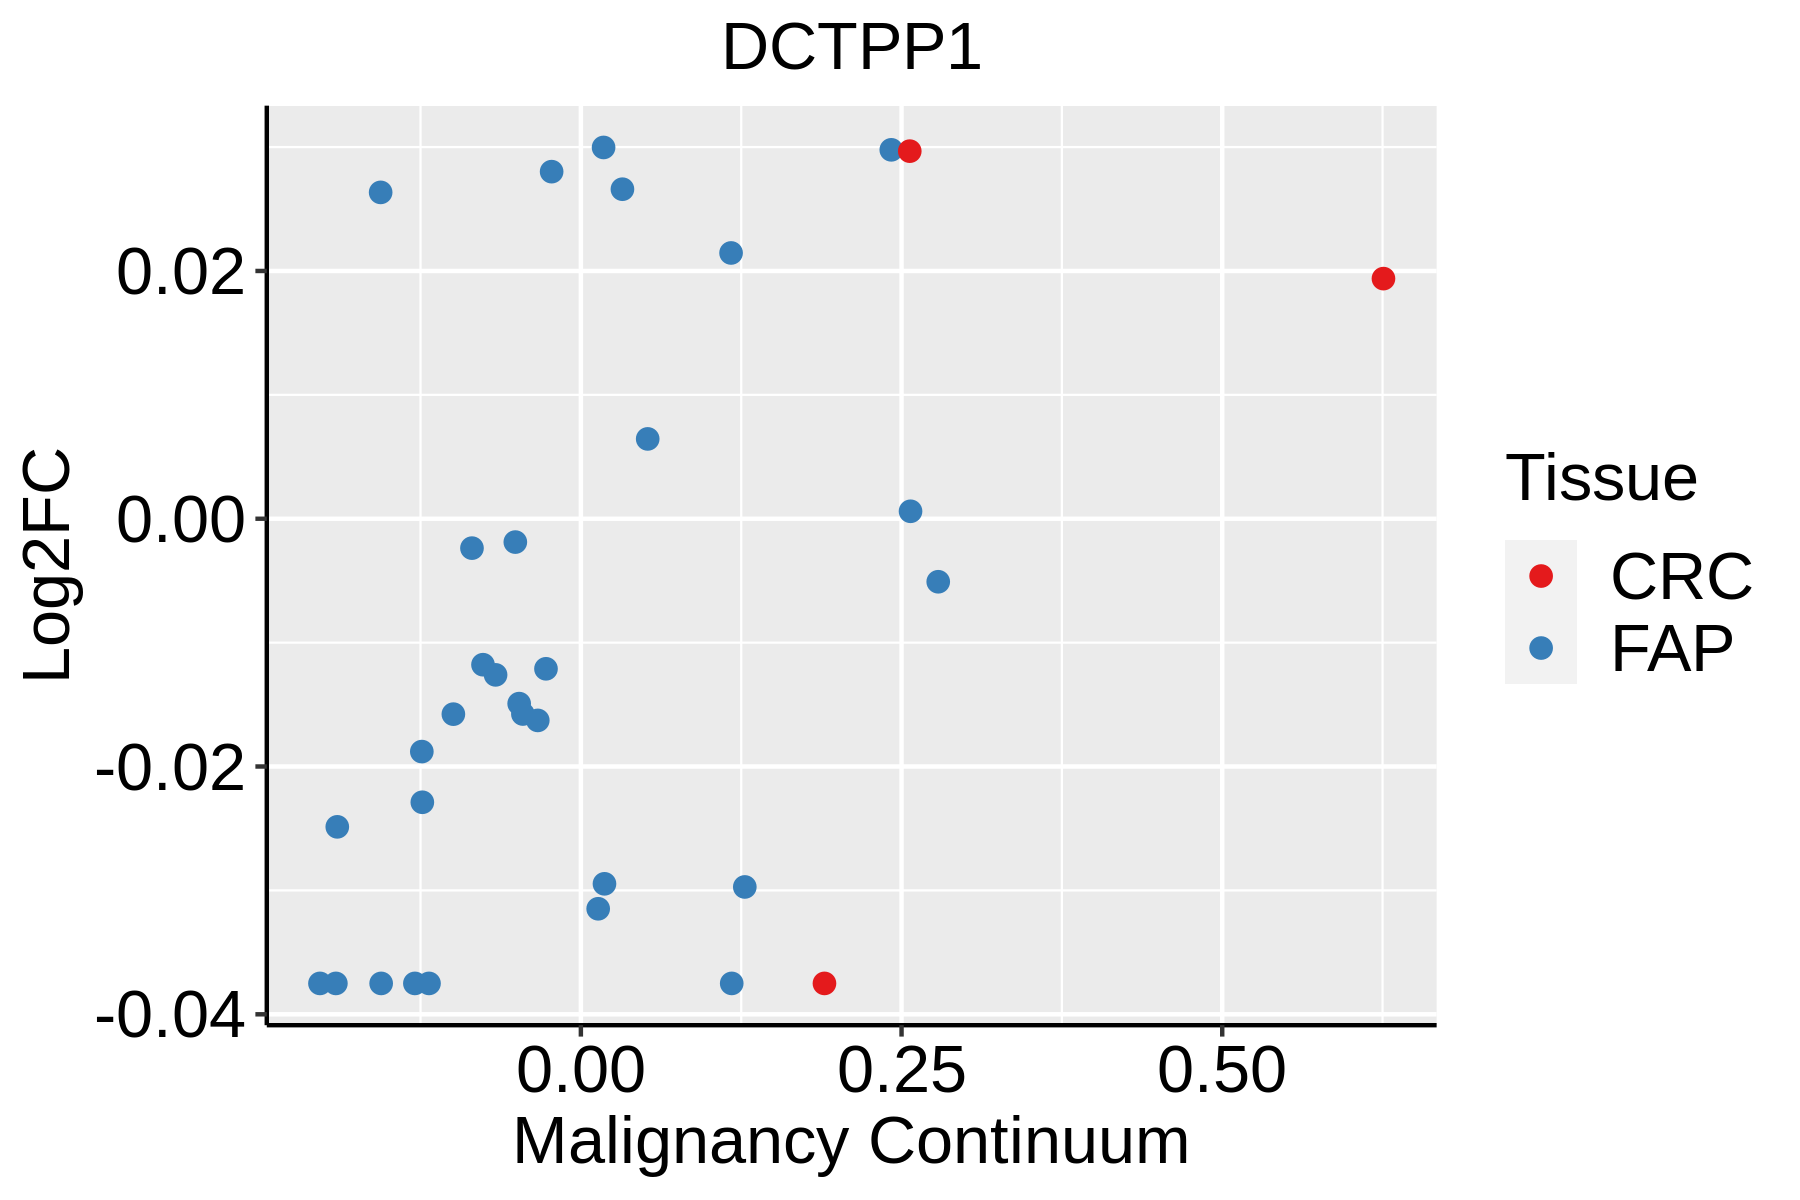 | FAP: Familial adenomatous polyposis |
| CRC: Colorectal cancer | ||
| Colorectum (HTA11) |  | AD: Adenomas |
| SER: Sessile serrated lesions | ||
| MSI-H: Microsatellite-high colorectal cancer | ||
| MSS: Microsatellite stable colorectal cancer | ||
| Esophagus | 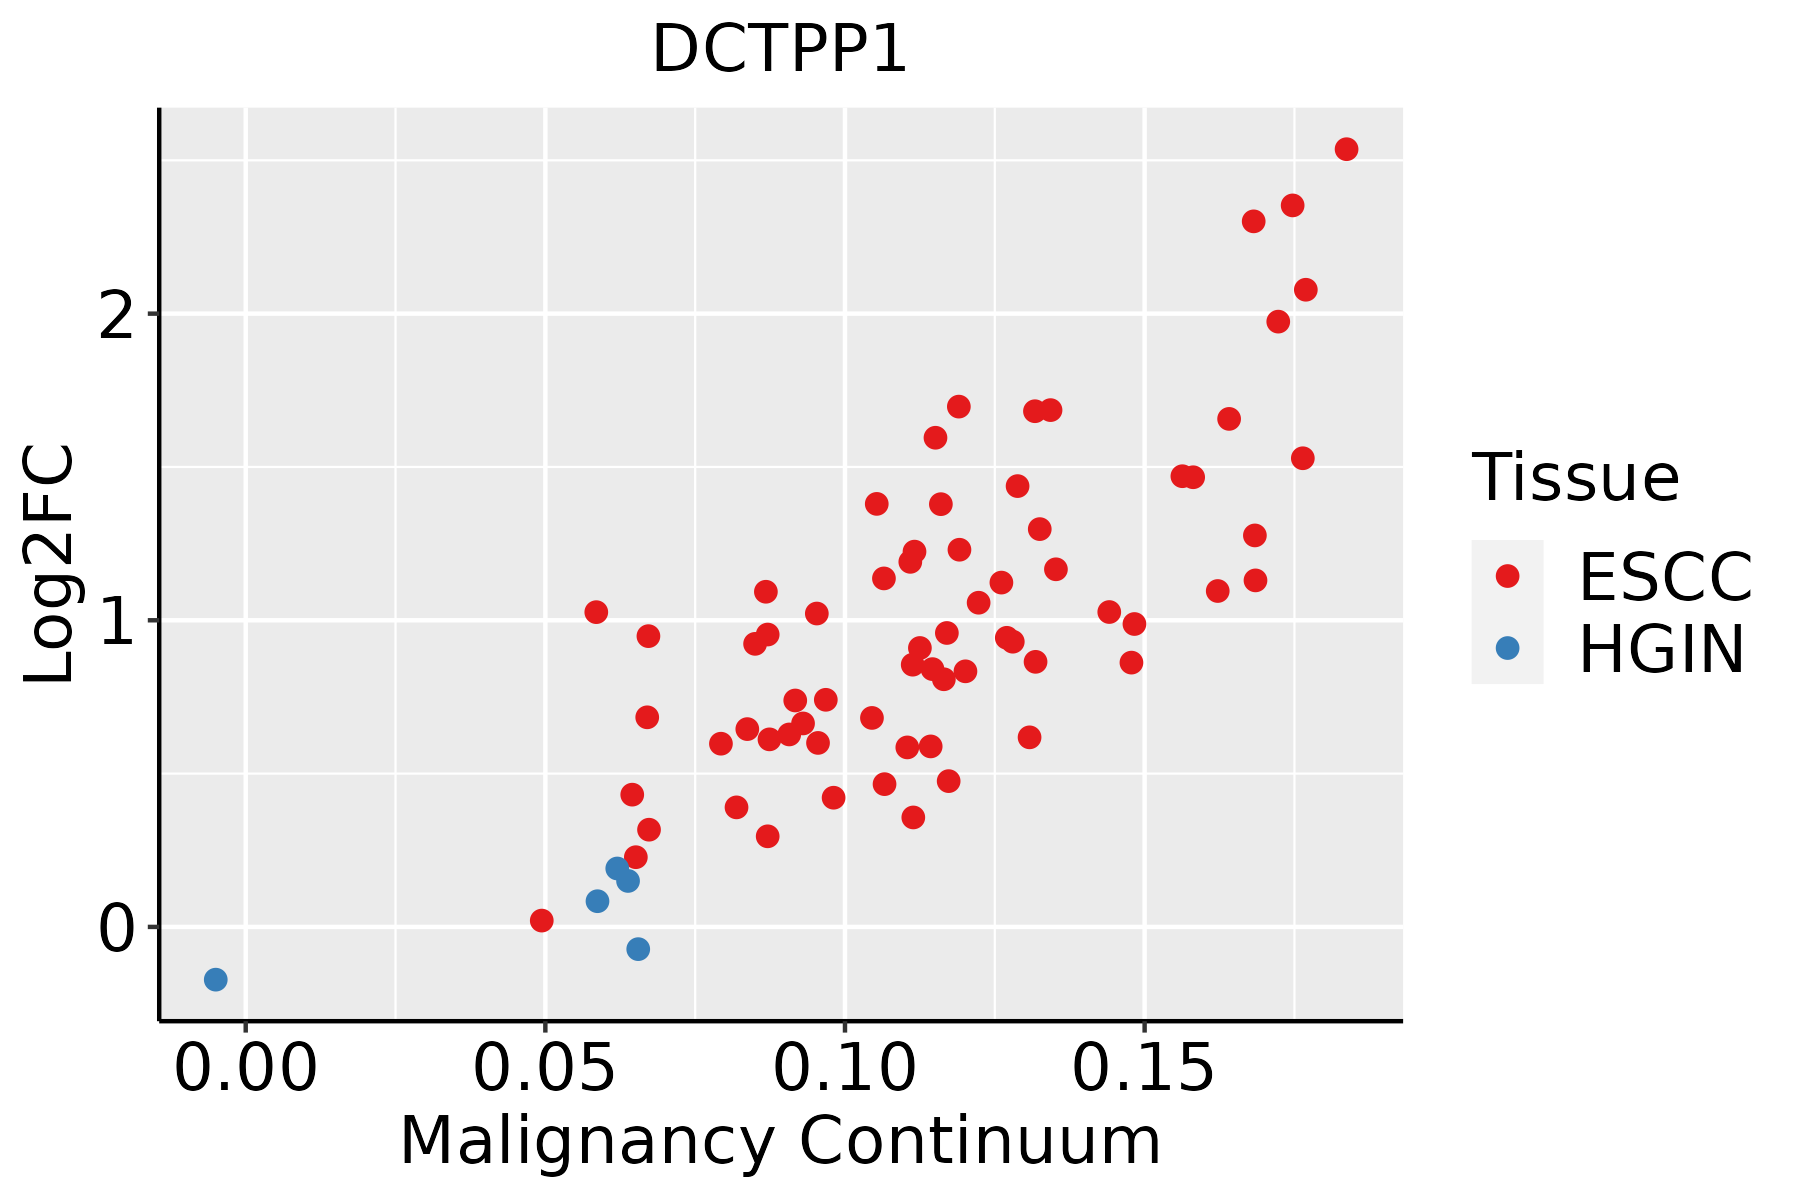 | ESCC: Esophageal squamous cell carcinoma |
| HGIN: High-grade intraepithelial neoplasias | ||
| LGIN: Low-grade intraepithelial neoplasias | ||
| Liver | 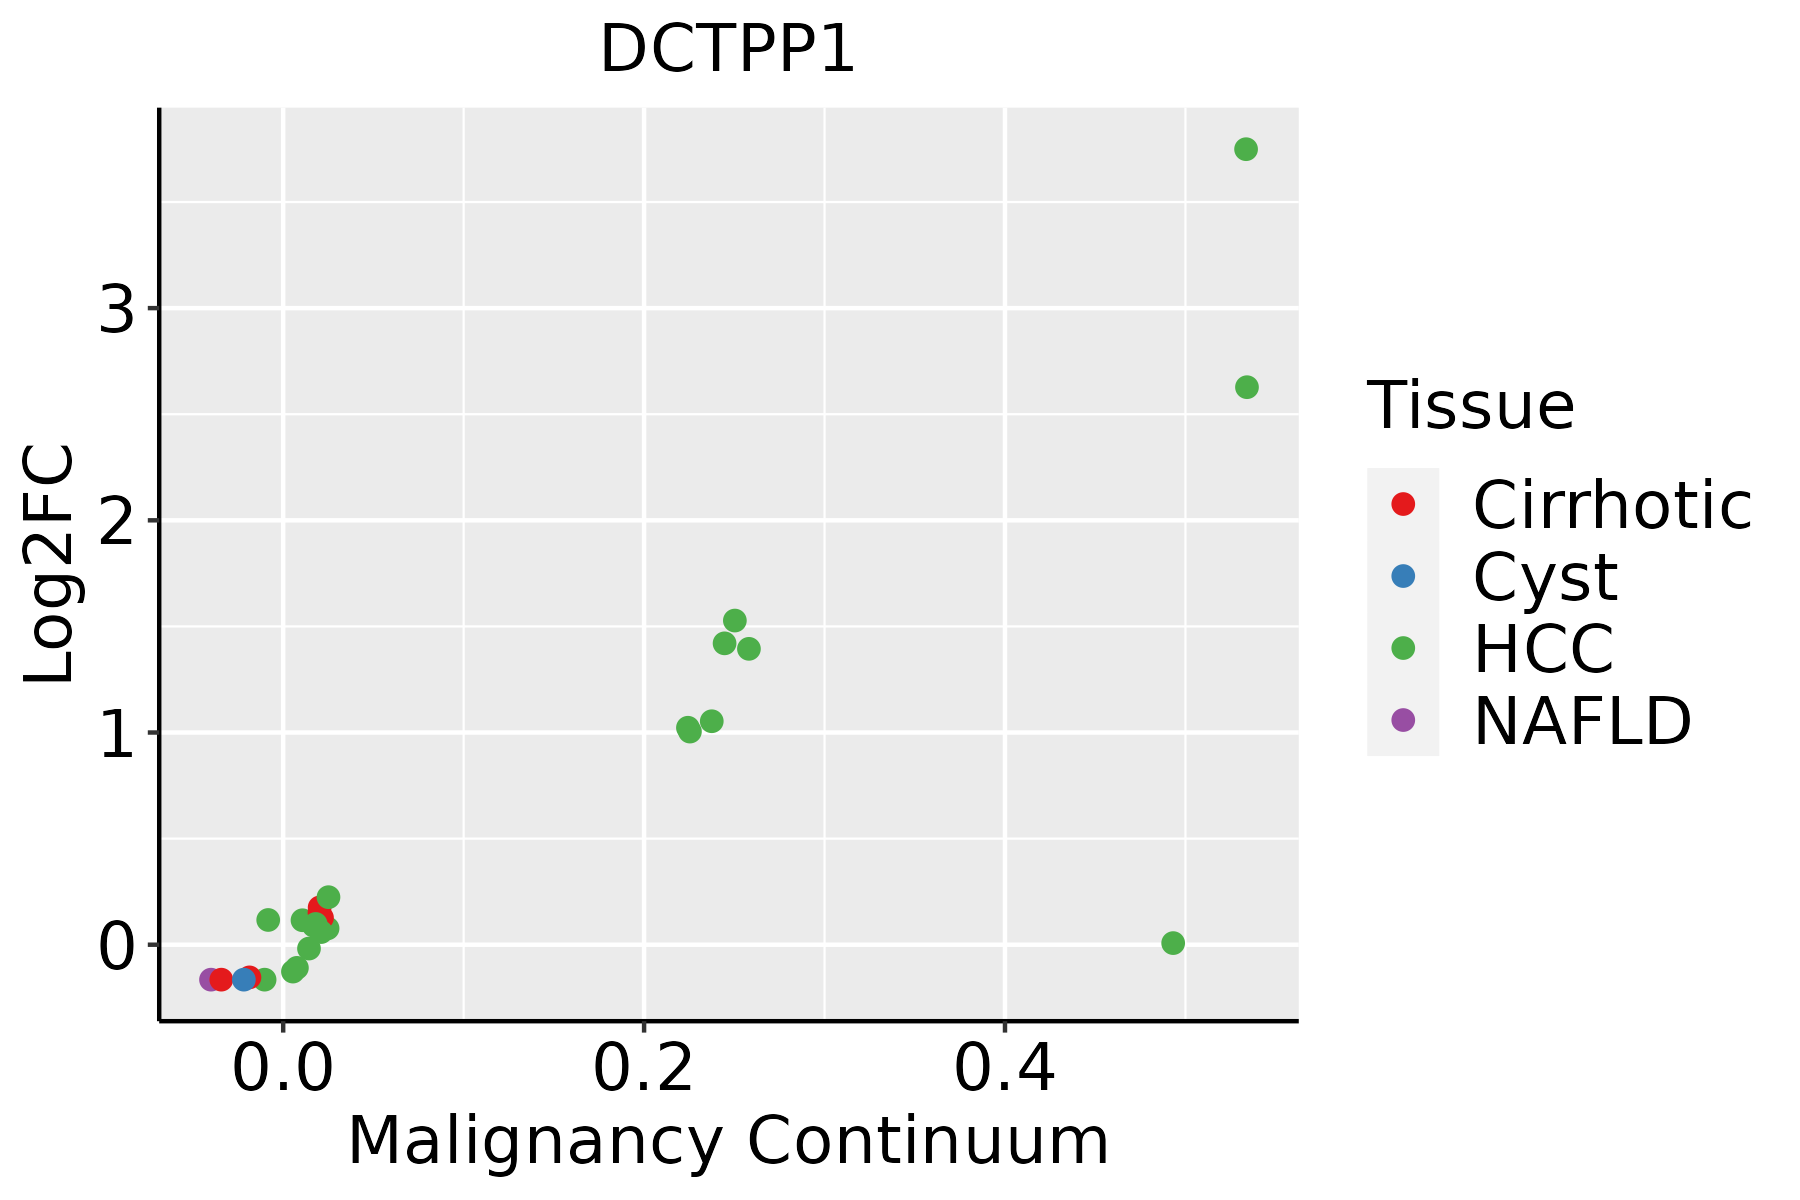 | HCC: Hepatocellular carcinoma |
| NAFLD: Non-alcoholic fatty liver disease | ||
| Oral Cavity | 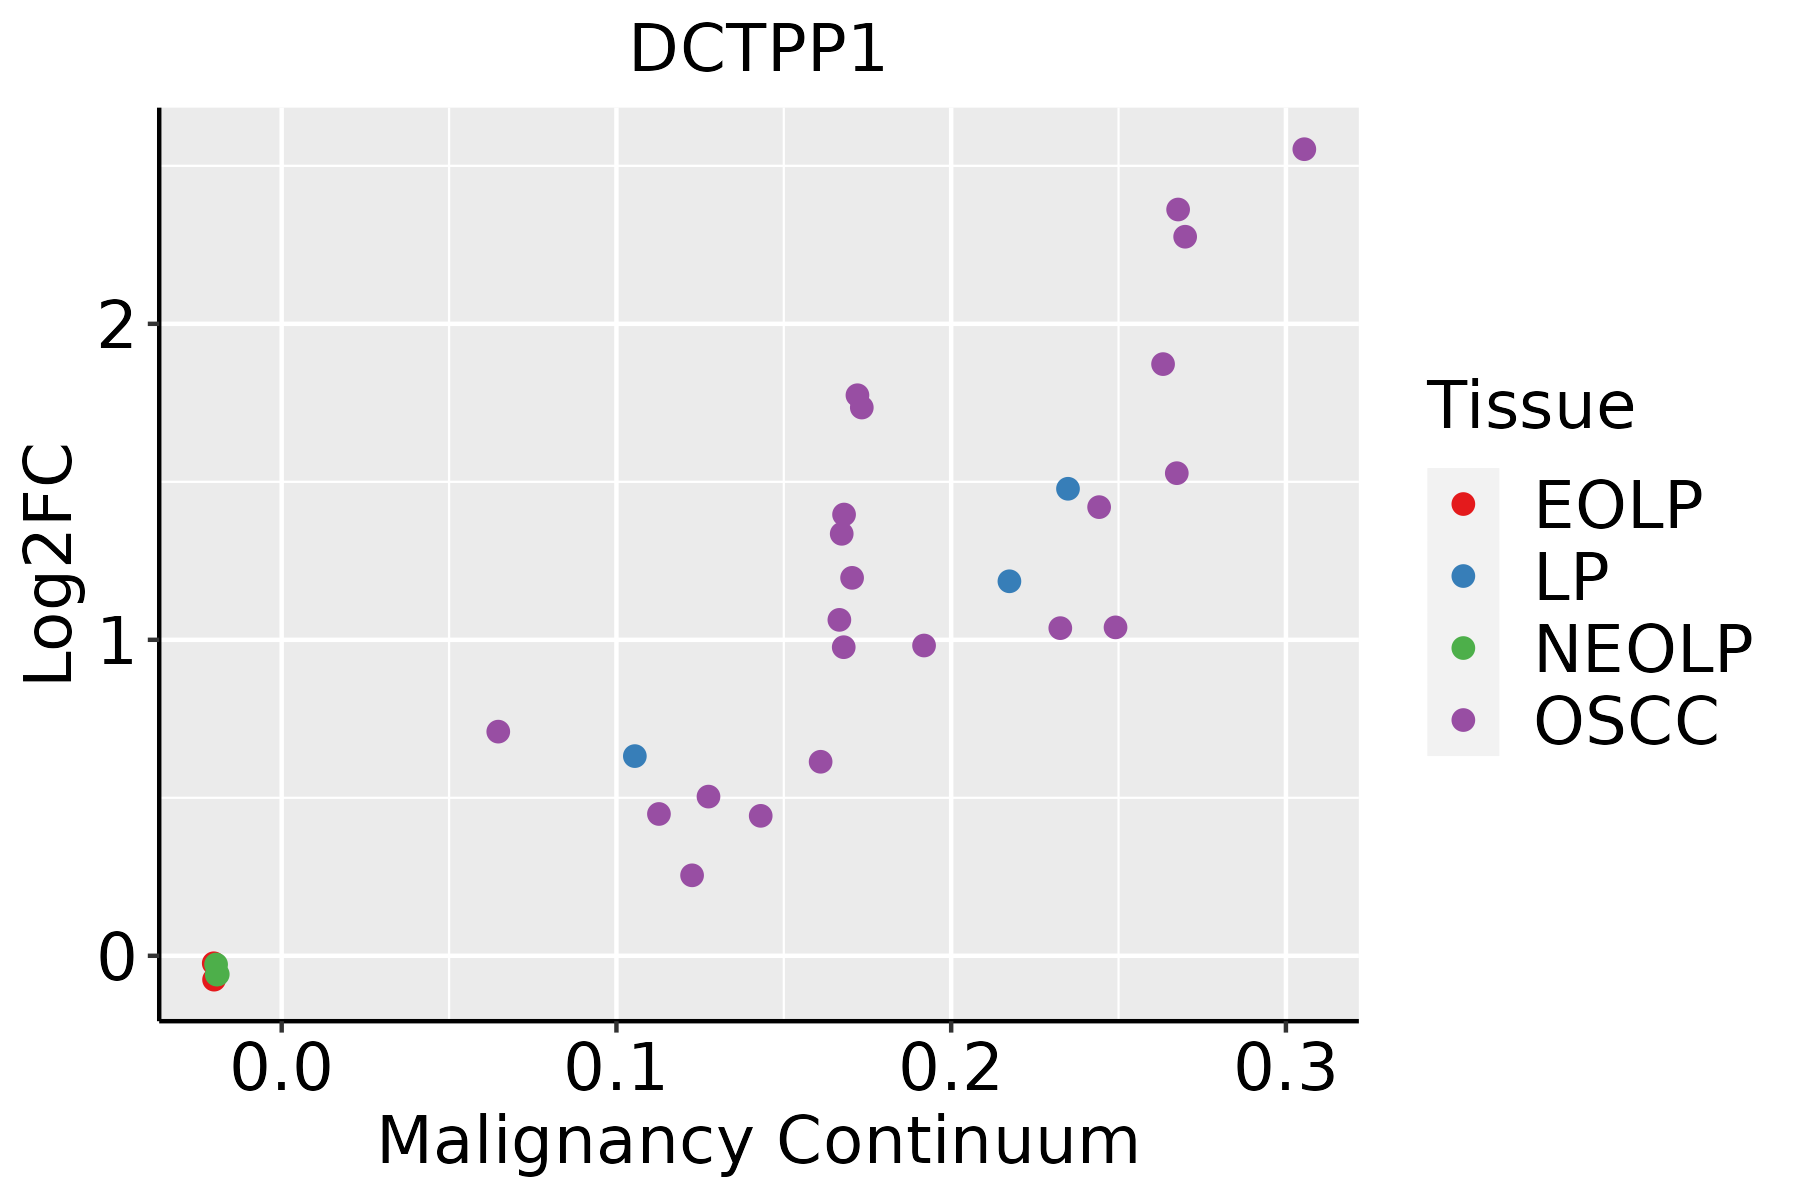 | EOLP: Erosive Oral lichen planus |
| LP: leukoplakia | ||
| NEOLP: Non-erosive oral lichen planus | ||
| OSCC: Oral squamous cell carcinoma | ||
| Skin | 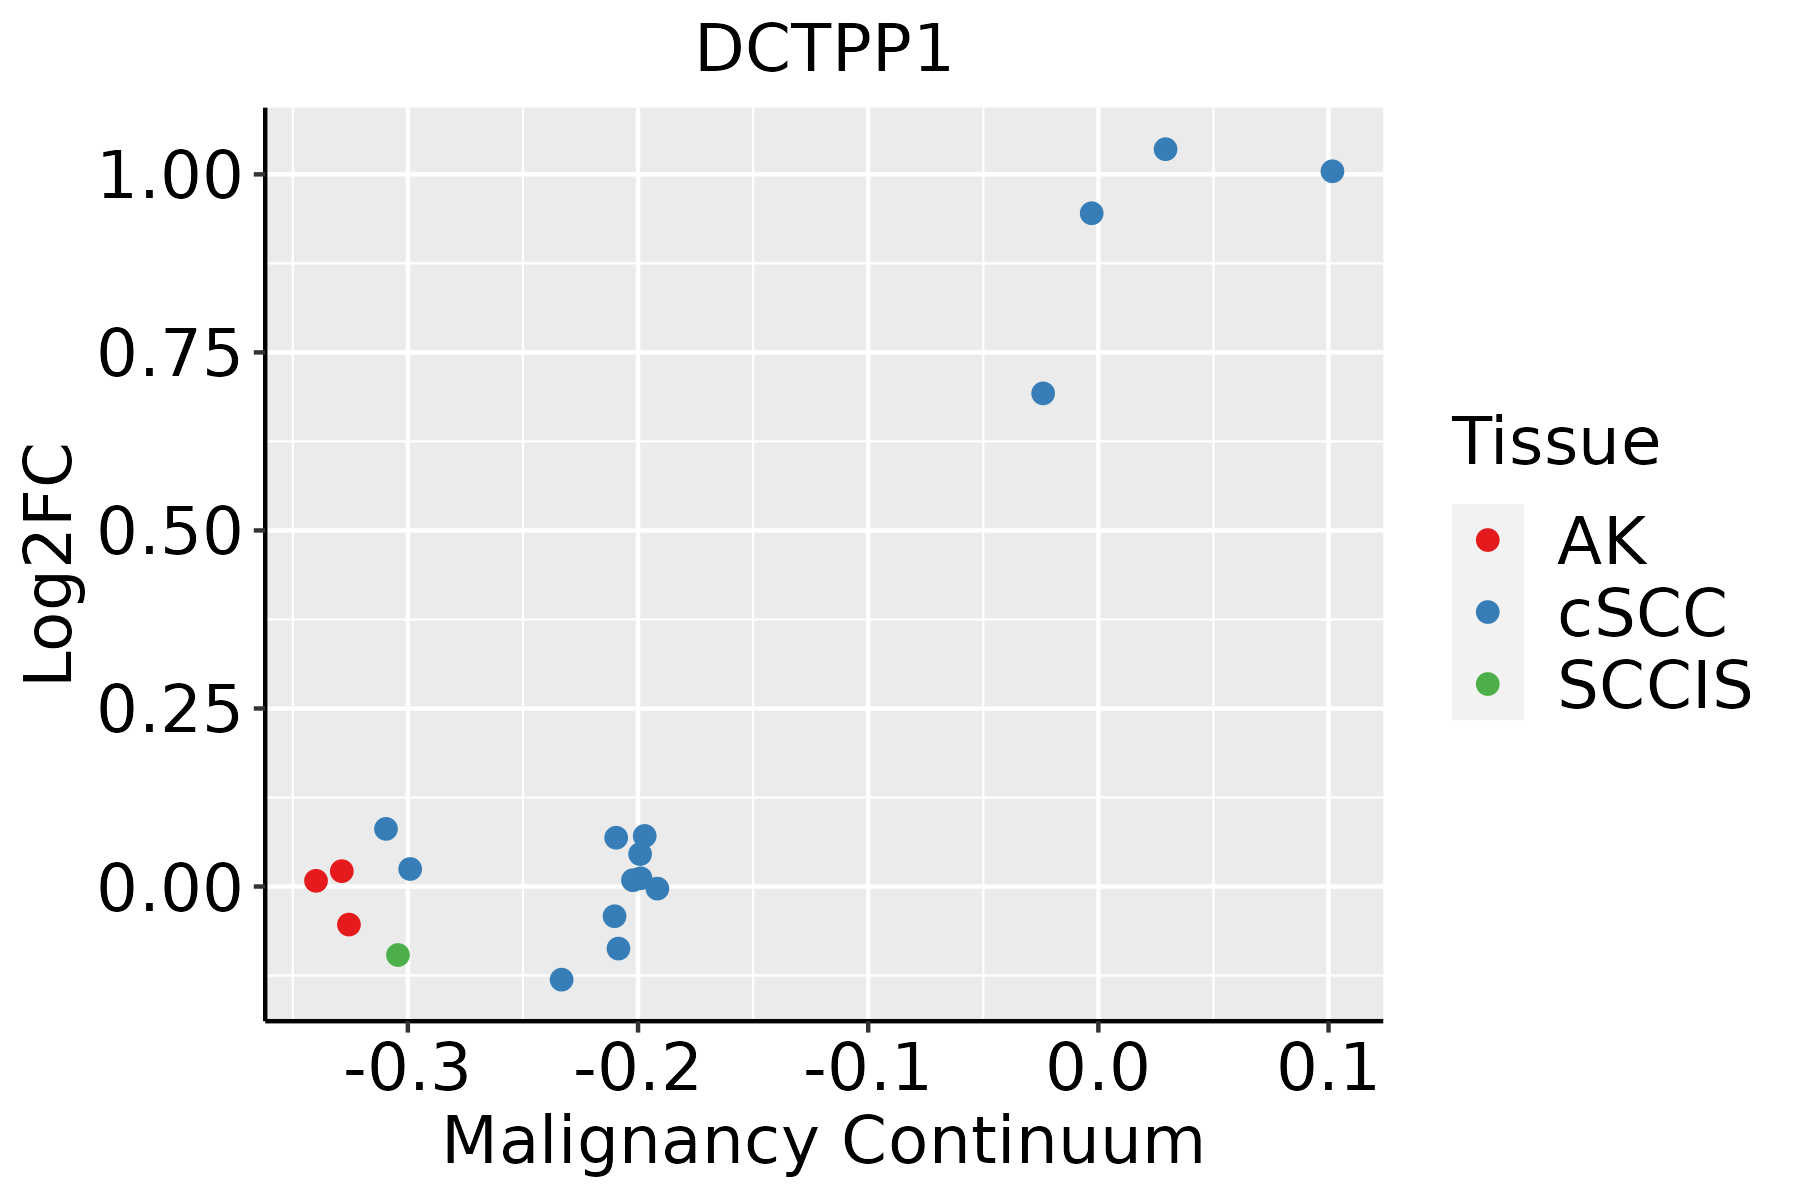 | AK: Actinic keratosis |
| cSCC: Cutaneous squamous cell carcinoma | ||
| SCCIS:squamous cell carcinoma in situ | ||
| Thyroid | 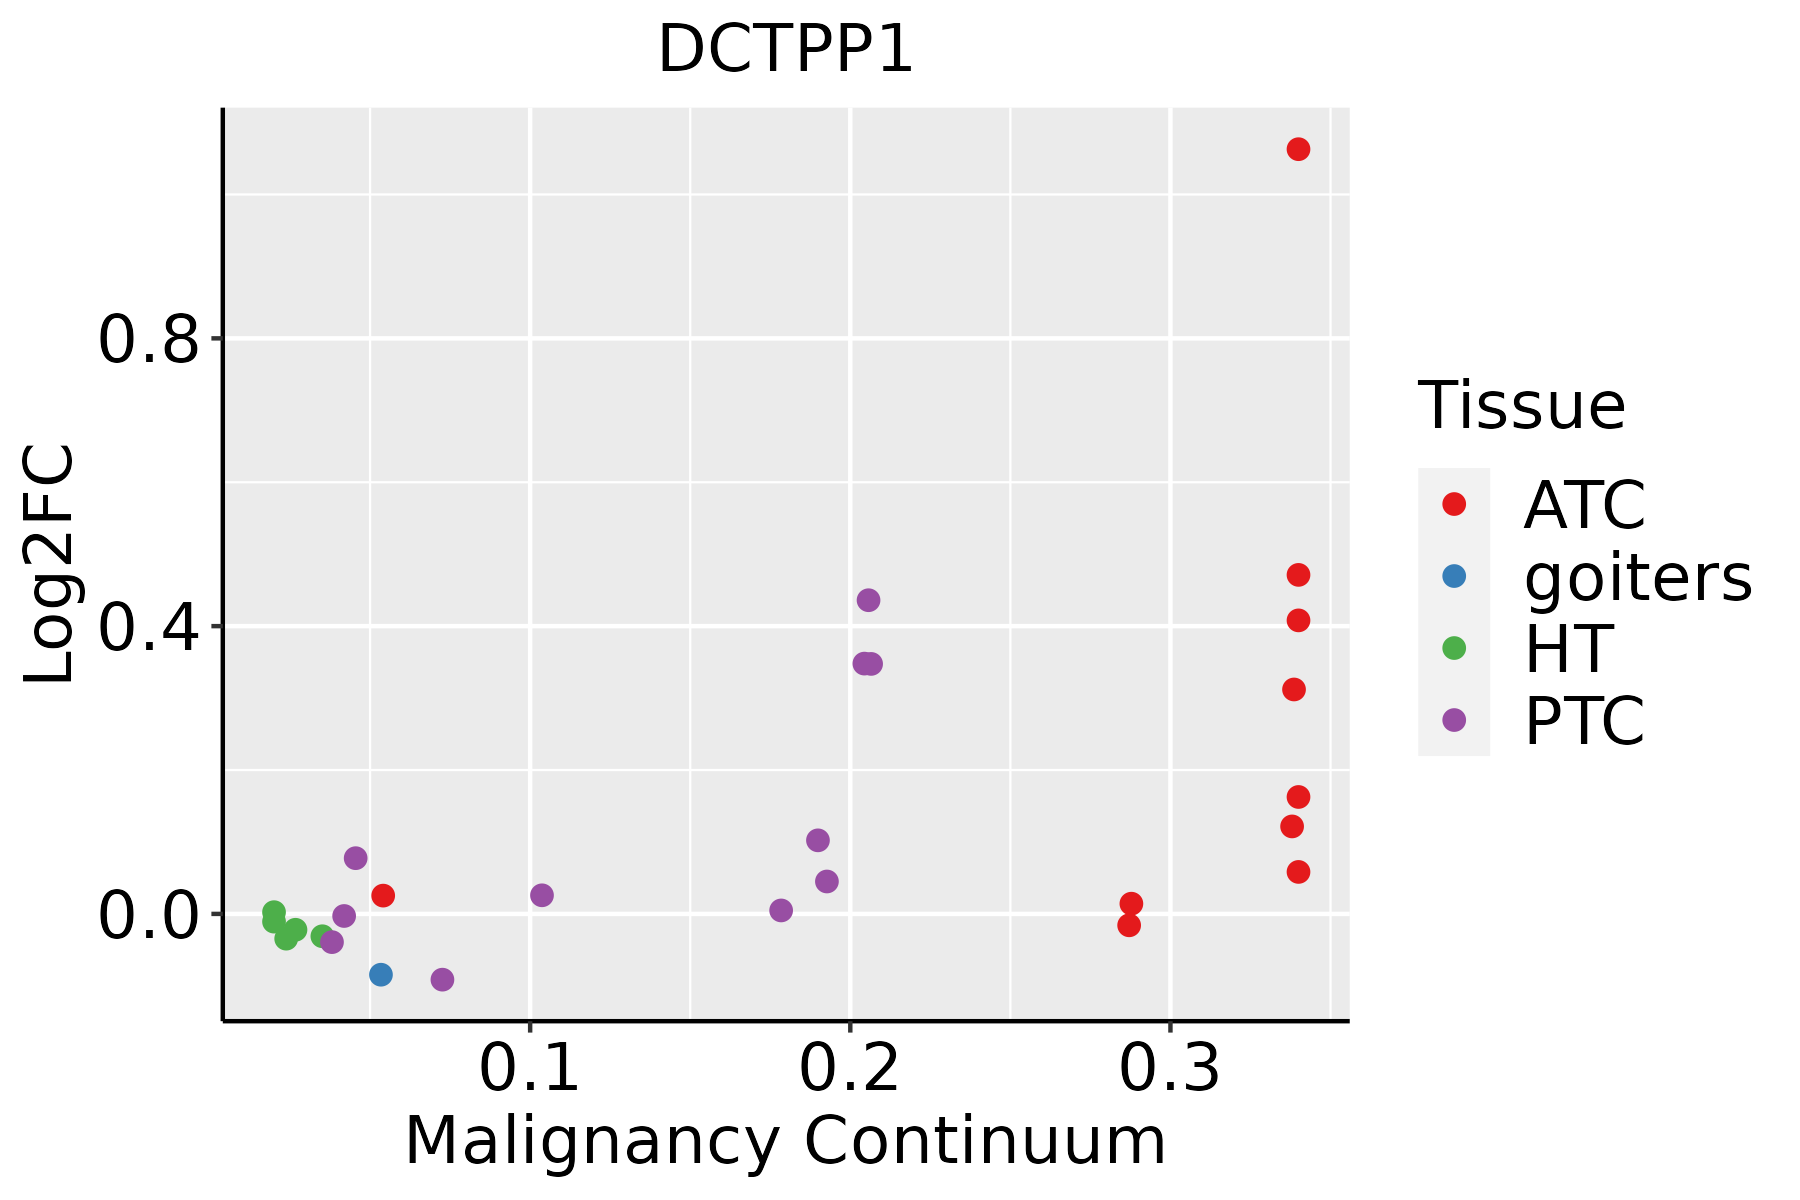 | ATC: Anaplastic thyroid cancer |
| HT: Hashimoto's thyroiditis | ||
| PTC: Papillary thyroid cancer |
| ∗log2FC in expression of this searched gene in stem-like cells from each diseased tissue sample relative to stem-like cells in normal samples in each tissue plotted against the malignancy continuum. Samples are colored based on if they are from different disease stage. |
Top |
Malignant transformation related pathway analysis |
| Find out the enriched GO biological processes and KEGG pathways involved in transition from healthy to precancer to cancer |
| Tissue | Disease Stage | Enriched GO biological Processes |
| Colorectum | AD |  |
| Colorectum | SER |  |
| Colorectum | MSS |  |
| Colorectum | MSI-H |  |
| Colorectum | FAP |  |
| ∗Top 15 enriched GO BP terms are showed in the bar plot of each disease state in each tissue. Each row represents a significant GO biological process which is colored according to the -log10(p.adjust). |
| Page: 1 2 3 4 5 6 7 8 9 |
| GO ID | Tissue | Disease Stage | Description | Gene Ratio | Bg Ratio | pvalue | p.adjust | Count |
| GO:00091418 | Breast | Precancer | nucleoside triphosphate metabolic process | 26/1080 | 112/18723 | 7.72e-10 | 6.66e-08 | 26 |
| GO:00091179 | Breast | Precancer | nucleotide metabolic process | 56/1080 | 489/18723 | 7.40e-07 | 3.00e-05 | 56 |
| GO:00067539 | Breast | Precancer | nucleoside phosphate metabolic process | 56/1080 | 497/18723 | 1.24e-06 | 4.70e-05 | 56 |
| GO:00346558 | Breast | Precancer | nucleobase-containing compound catabolic process | 42/1080 | 407/18723 | 1.91e-04 | 3.06e-03 | 42 |
| GO:00467007 | Breast | Precancer | heterocycle catabolic process | 44/1080 | 445/18723 | 3.49e-04 | 4.88e-03 | 44 |
| GO:00442708 | Breast | Precancer | cellular nitrogen compound catabolic process | 44/1080 | 451/18723 | 4.64e-04 | 6.12e-03 | 44 |
| GO:00714969 | Breast | Precancer | cellular response to external stimulus | 33/1080 | 320/18723 | 9.01e-04 | 1.03e-02 | 33 |
| GO:00194397 | Breast | Precancer | aromatic compound catabolic process | 44/1080 | 467/18723 | 9.55e-04 | 1.07e-02 | 44 |
| GO:00316688 | Breast | Precancer | cellular response to extracellular stimulus | 27/1080 | 246/18723 | 1.02e-03 | 1.13e-02 | 27 |
| GO:19013617 | Breast | Precancer | organic cyclic compound catabolic process | 45/1080 | 495/18723 | 1.73e-03 | 1.74e-02 | 45 |
| GO:000914114 | Breast | IDC | nucleoside triphosphate metabolic process | 29/1434 | 112/18723 | 3.68e-09 | 3.03e-07 | 29 |
| GO:000675313 | Breast | IDC | nucleoside phosphate metabolic process | 68/1434 | 497/18723 | 2.01e-06 | 8.23e-05 | 68 |
| GO:000911713 | Breast | IDC | nucleotide metabolic process | 67/1434 | 489/18723 | 2.28e-06 | 9.05e-05 | 67 |
| GO:007149614 | Breast | IDC | cellular response to external stimulus | 45/1434 | 320/18723 | 5.40e-05 | 1.15e-03 | 45 |
| GO:003166814 | Breast | IDC | cellular response to extracellular stimulus | 35/1434 | 246/18723 | 2.79e-04 | 4.26e-03 | 35 |
| GO:190136112 | Breast | IDC | organic cyclic compound catabolic process | 56/1434 | 495/18723 | 2.12e-03 | 1.99e-02 | 56 |
| GO:004670012 | Breast | IDC | heterocycle catabolic process | 51/1434 | 445/18723 | 2.51e-03 | 2.25e-02 | 51 |
| GO:003465513 | Breast | IDC | nucleobase-containing compound catabolic process | 47/1434 | 407/18723 | 3.12e-03 | 2.63e-02 | 47 |
| GO:004427012 | Breast | IDC | cellular nitrogen compound catabolic process | 50/1434 | 451/18723 | 5.29e-03 | 3.93e-02 | 50 |
| GO:001943912 | Breast | IDC | aromatic compound catabolic process | 51/1434 | 467/18723 | 6.54e-03 | 4.59e-02 | 51 |
| Page: 1 2 3 4 5 6 7 8 9 10 11 12 13 |
| Pathway ID | Tissue | Disease Stage | Description | Gene Ratio | Bg Ratio | pvalue | p.adjust | qvalue | Count |
| hsa012325 | Esophagus | ESCC | Nucleotide metabolism | 59/4205 | 85/8465 | 1.67e-04 | 6.58e-04 | 3.37e-04 | 59 |
| hsa002405 | Esophagus | ESCC | Pyrimidine metabolism | 41/4205 | 58/8465 | 9.14e-04 | 2.92e-03 | 1.49e-03 | 41 |
| hsa0123212 | Esophagus | ESCC | Nucleotide metabolism | 59/4205 | 85/8465 | 1.67e-04 | 6.58e-04 | 3.37e-04 | 59 |
| hsa0024012 | Esophagus | ESCC | Pyrimidine metabolism | 41/4205 | 58/8465 | 9.14e-04 | 2.92e-03 | 1.49e-03 | 41 |
| hsa01232 | Liver | Cirrhotic | Nucleotide metabolism | 39/2530 | 85/8465 | 1.27e-03 | 6.73e-03 | 4.15e-03 | 39 |
| hsa00240 | Liver | Cirrhotic | Pyrimidine metabolism | 27/2530 | 58/8465 | 5.31e-03 | 1.88e-02 | 1.16e-02 | 27 |
| hsa012321 | Liver | Cirrhotic | Nucleotide metabolism | 39/2530 | 85/8465 | 1.27e-03 | 6.73e-03 | 4.15e-03 | 39 |
| hsa002401 | Liver | Cirrhotic | Pyrimidine metabolism | 27/2530 | 58/8465 | 5.31e-03 | 1.88e-02 | 1.16e-02 | 27 |
| hsa002402 | Liver | HCC | Pyrimidine metabolism | 44/4020 | 58/8465 | 9.34e-06 | 7.11e-05 | 3.95e-05 | 44 |
| hsa012322 | Liver | HCC | Nucleotide metabolism | 59/4020 | 85/8465 | 3.30e-05 | 1.88e-04 | 1.04e-04 | 59 |
| hsa002403 | Liver | HCC | Pyrimidine metabolism | 44/4020 | 58/8465 | 9.34e-06 | 7.11e-05 | 3.95e-05 | 44 |
| hsa012323 | Liver | HCC | Nucleotide metabolism | 59/4020 | 85/8465 | 3.30e-05 | 1.88e-04 | 1.04e-04 | 59 |
| hsa012324 | Oral cavity | OSCC | Nucleotide metabolism | 54/3704 | 85/8465 | 1.78e-04 | 5.95e-04 | 3.03e-04 | 54 |
| hsa002404 | Oral cavity | OSCC | Pyrimidine metabolism | 37/3704 | 58/8465 | 1.62e-03 | 4.45e-03 | 2.26e-03 | 37 |
| hsa0123211 | Oral cavity | OSCC | Nucleotide metabolism | 54/3704 | 85/8465 | 1.78e-04 | 5.95e-04 | 3.03e-04 | 54 |
| hsa0024011 | Oral cavity | OSCC | Pyrimidine metabolism | 37/3704 | 58/8465 | 1.62e-03 | 4.45e-03 | 2.26e-03 | 37 |
| hsa0123221 | Oral cavity | LP | Nucleotide metabolism | 42/2418 | 85/8465 | 3.62e-05 | 2.36e-04 | 1.52e-04 | 42 |
| hsa0024021 | Oral cavity | LP | Pyrimidine metabolism | 28/2418 | 58/8465 | 1.12e-03 | 5.02e-03 | 3.24e-03 | 28 |
| hsa0123231 | Oral cavity | LP | Nucleotide metabolism | 42/2418 | 85/8465 | 3.62e-05 | 2.36e-04 | 1.52e-04 | 42 |
| hsa0024031 | Oral cavity | LP | Pyrimidine metabolism | 28/2418 | 58/8465 | 1.12e-03 | 5.02e-03 | 3.24e-03 | 28 |
| Page: 1 |
Top |
Cell-cell communication analysis |
| Identification of potential cell-cell interactions between two cell types and their ligand-receptor pairs for different disease states |
| Ligand | Receptor | LRpair | Pathway | Tissue | Disease Stage |
| Page: 1 |
Top |
Single-cell gene regulatory network inference analysis |
| Find out the significant the regulons (TFs) and the target genes of each regulon across cell types for different disease states |
| TF | Cell Type | Tissue | Disease Stage | Target Gene | RSS | Regulon Activity |
| ∗The dot plots of a searched regulon are shown for all cell subpopulations in each disease state of each tissue based on the regulon specific score inferred using pySCENIC and by calculating the average expression. |
| Page: 1 |
Top |
Somatic mutation of malignant transformation related genes |
| Annotation of somatic variants for genes involved in malignant transformation |
| Hugo Symbol | Variant Class | Variant Classification | dbSNP RS | HGVSc | HGVSp | HGVSp Short | SWISSPROT | BIOTYPE | SIFT | PolyPhen | Tumor Sample Barcode | Tissue | Histology | Sex | Age | Stage | Therapy Types | Drugs | Outcome |
| DCTPP1 | SNV | Missense_Mutation | novel | c.232G>A | p.Glu78Lys | p.E78K | Q9H773 | protein_coding | tolerated(0.43) | benign(0.007) | TCGA-3C-AALI-01 | Breast | breast invasive carcinoma | Female | <65 | I/II | Unspecific | Poly E | Complete Response |
| DCTPP1 | insertion | Frame_Shift_Ins | novel | c.167_168insTTCTCTGATGTGTCCCAAGTGCCCAGCGCATAGTAGGC | p.Leu57SerfsTer63 | p.L57Sfs*63 | Q9H773 | protein_coding | TCGA-BH-A0H9-01 | Breast | breast invasive carcinoma | Female | >=65 | I/II | Hormone Therapy | arimidex | SD | ||
| DCTPP1 | SNV | Missense_Mutation | c.45G>T | p.Glu15Asp | p.E15D | Q9H773 | protein_coding | tolerated(0.25) | benign(0) | TCGA-2W-A8YY-01 | Cervix | cervical & endocervical cancer | Female | <65 | I/II | Chemotherapy | cisplatin | CR | |
| DCTPP1 | SNV | Missense_Mutation | rs747527404 | c.160N>T | p.Arg54Trp | p.R54W | Q9H773 | protein_coding | deleterious(0) | probably_damaging(1) | TCGA-AA-3684-01 | Colorectum | colon adenocarcinoma | Female | >=65 | III/IV | Unknown | Unknown | SD |
| DCTPP1 | SNV | Missense_Mutation | c.45N>T | p.Glu15Asp | p.E15D | Q9H773 | protein_coding | tolerated(0.25) | benign(0) | TCGA-AA-3811-01 | Colorectum | colon adenocarcinoma | Female | >=65 | III/IV | Unknown | Unknown | PD | |
| DCTPP1 | deletion | Frame_Shift_Del | c.244delN | p.Gln82LysfsTer25 | p.Q82Kfs*25 | Q9H773 | protein_coding | TCGA-A6-5665-01 | Colorectum | colon adenocarcinoma | Female | >=65 | I/II | Unknown | Unknown | PD | |||
| DCTPP1 | SNV | Missense_Mutation | novel | c.295G>T | p.Val99Phe | p.V99F | Q9H773 | protein_coding | deleterious(0) | probably_damaging(0.986) | TCGA-A5-A2K5-01 | Endometrium | uterine corpus endometrioid carcinoma | Female | >=65 | I/II | Unknown | Unknown | SD |
| DCTPP1 | SNV | Missense_Mutation | c.396N>G | p.His132Gln | p.H132Q | Q9H773 | protein_coding | tolerated(0.29) | benign(0.081) | TCGA-B5-A0JY-01 | Endometrium | uterine corpus endometrioid carcinoma | Female | <65 | III/IV | Chemotherapy | doxorubicin | SD | |
| DCTPP1 | SNV | Missense_Mutation | rs368588932 | c.295N>A | p.Val99Ile | p.V99I | Q9H773 | protein_coding | tolerated(0.06) | benign(0.088) | TCGA-B5-A3FC-01 | Endometrium | uterine corpus endometrioid carcinoma | Female | <65 | I/II | Unknown | Unknown | SD |
| DCTPP1 | SNV | Missense_Mutation | rs143083714 | c.331C>T | p.Arg111Cys | p.R111C | Q9H773 | protein_coding | tolerated(0.11) | possibly_damaging(0.849) | TCGA-BG-A220-01 | Endometrium | uterine corpus endometrioid carcinoma | Female | >=65 | I/II | Unknown | Unknown | SD |
| Page: 1 2 |
Top |
Related drugs of malignant transformation related genes |
| Identification of chemicals and drugs interact with genes involved in malignant transfromation |
| (DGIdb 4.0) |
| Entrez ID | Symbol | Category | Interaction Types | Drug Claim Name | Drug Name | PMIDs |
| Page: 1 |

Copyright 2023-Present -The University of Texas Health Science Center at Houston |