| Tissue | Expression Dynamics | Abbreviation |
| Esophagus | 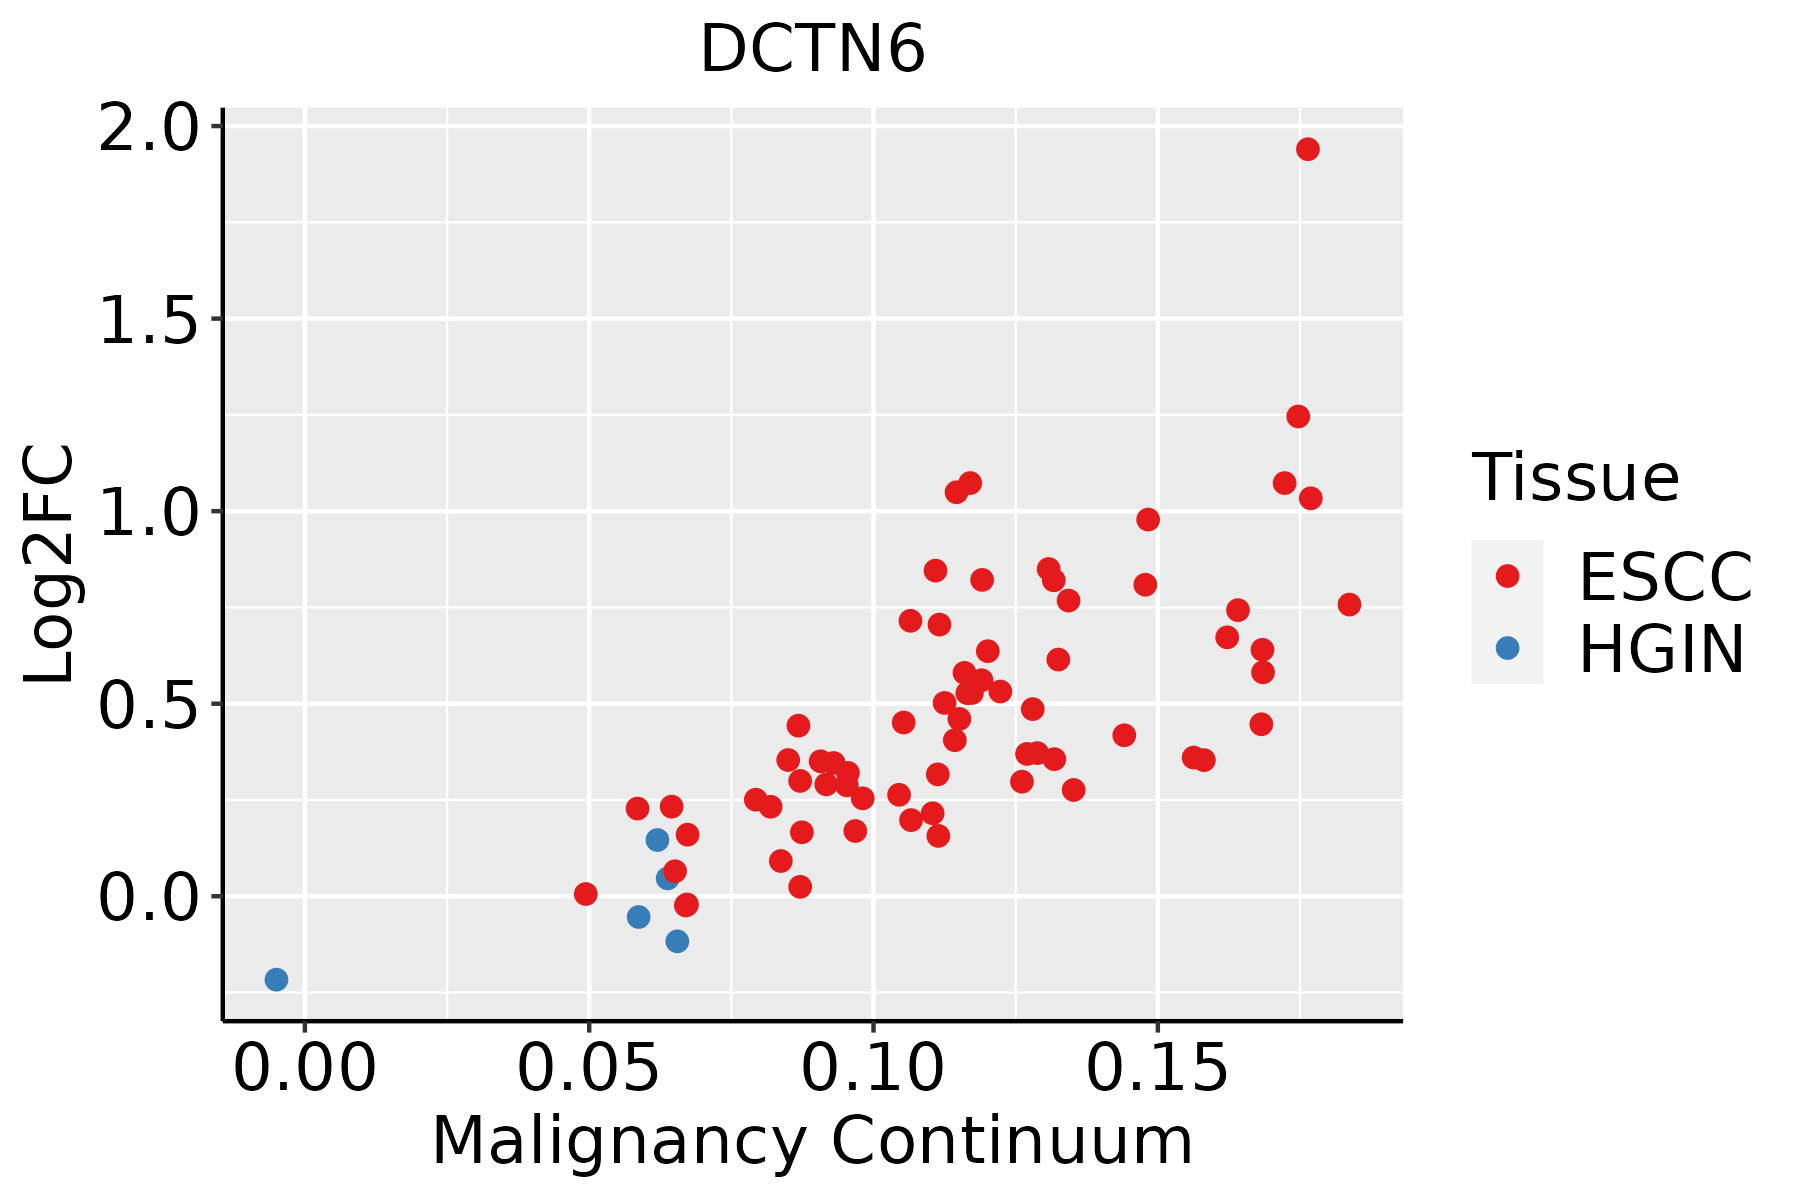 | ESCC: Esophageal squamous cell carcinoma |
| HGIN: High-grade intraepithelial neoplasias |
| LGIN: Low-grade intraepithelial neoplasias |
| Oral Cavity | 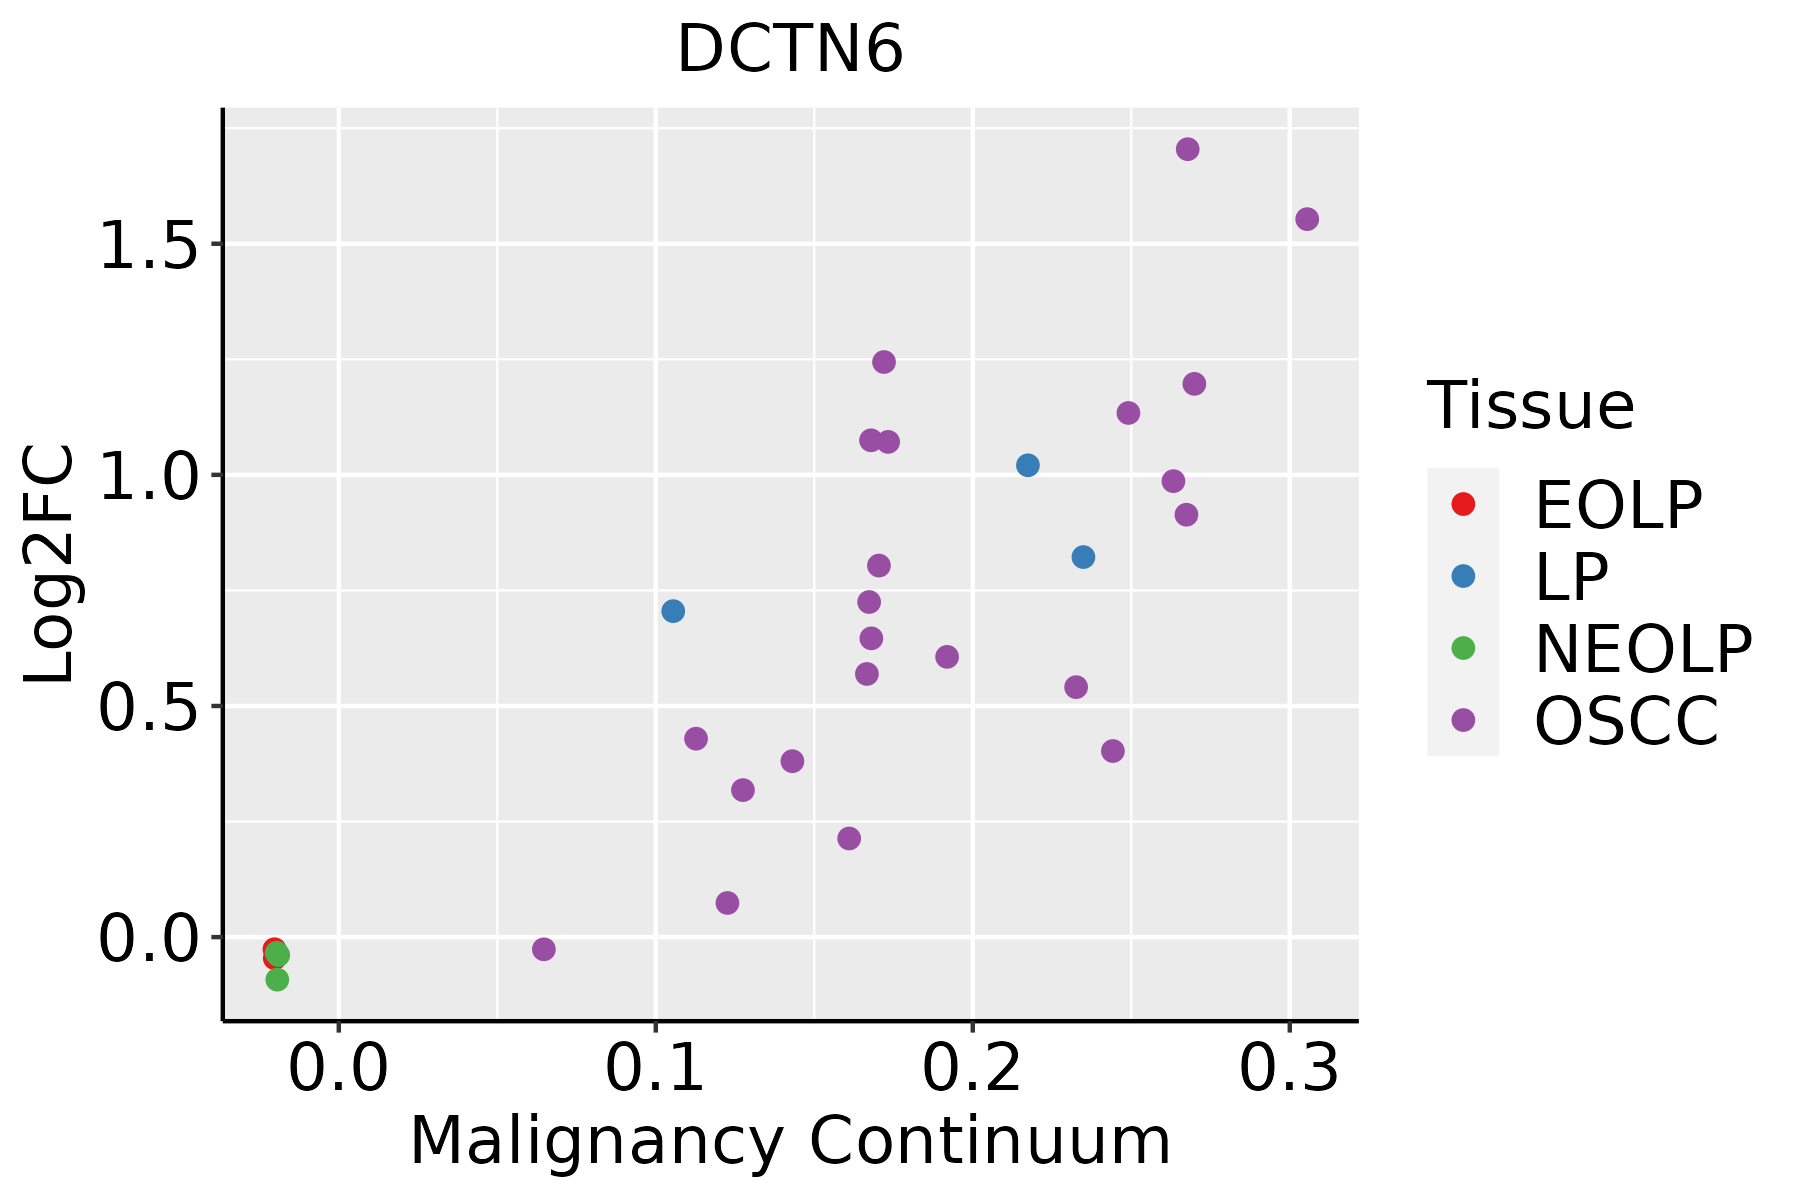 | EOLP: Erosive Oral lichen planus |
| LP: leukoplakia |
| NEOLP: Non-erosive oral lichen planus |
| OSCC: Oral squamous cell carcinoma |
| Skin | 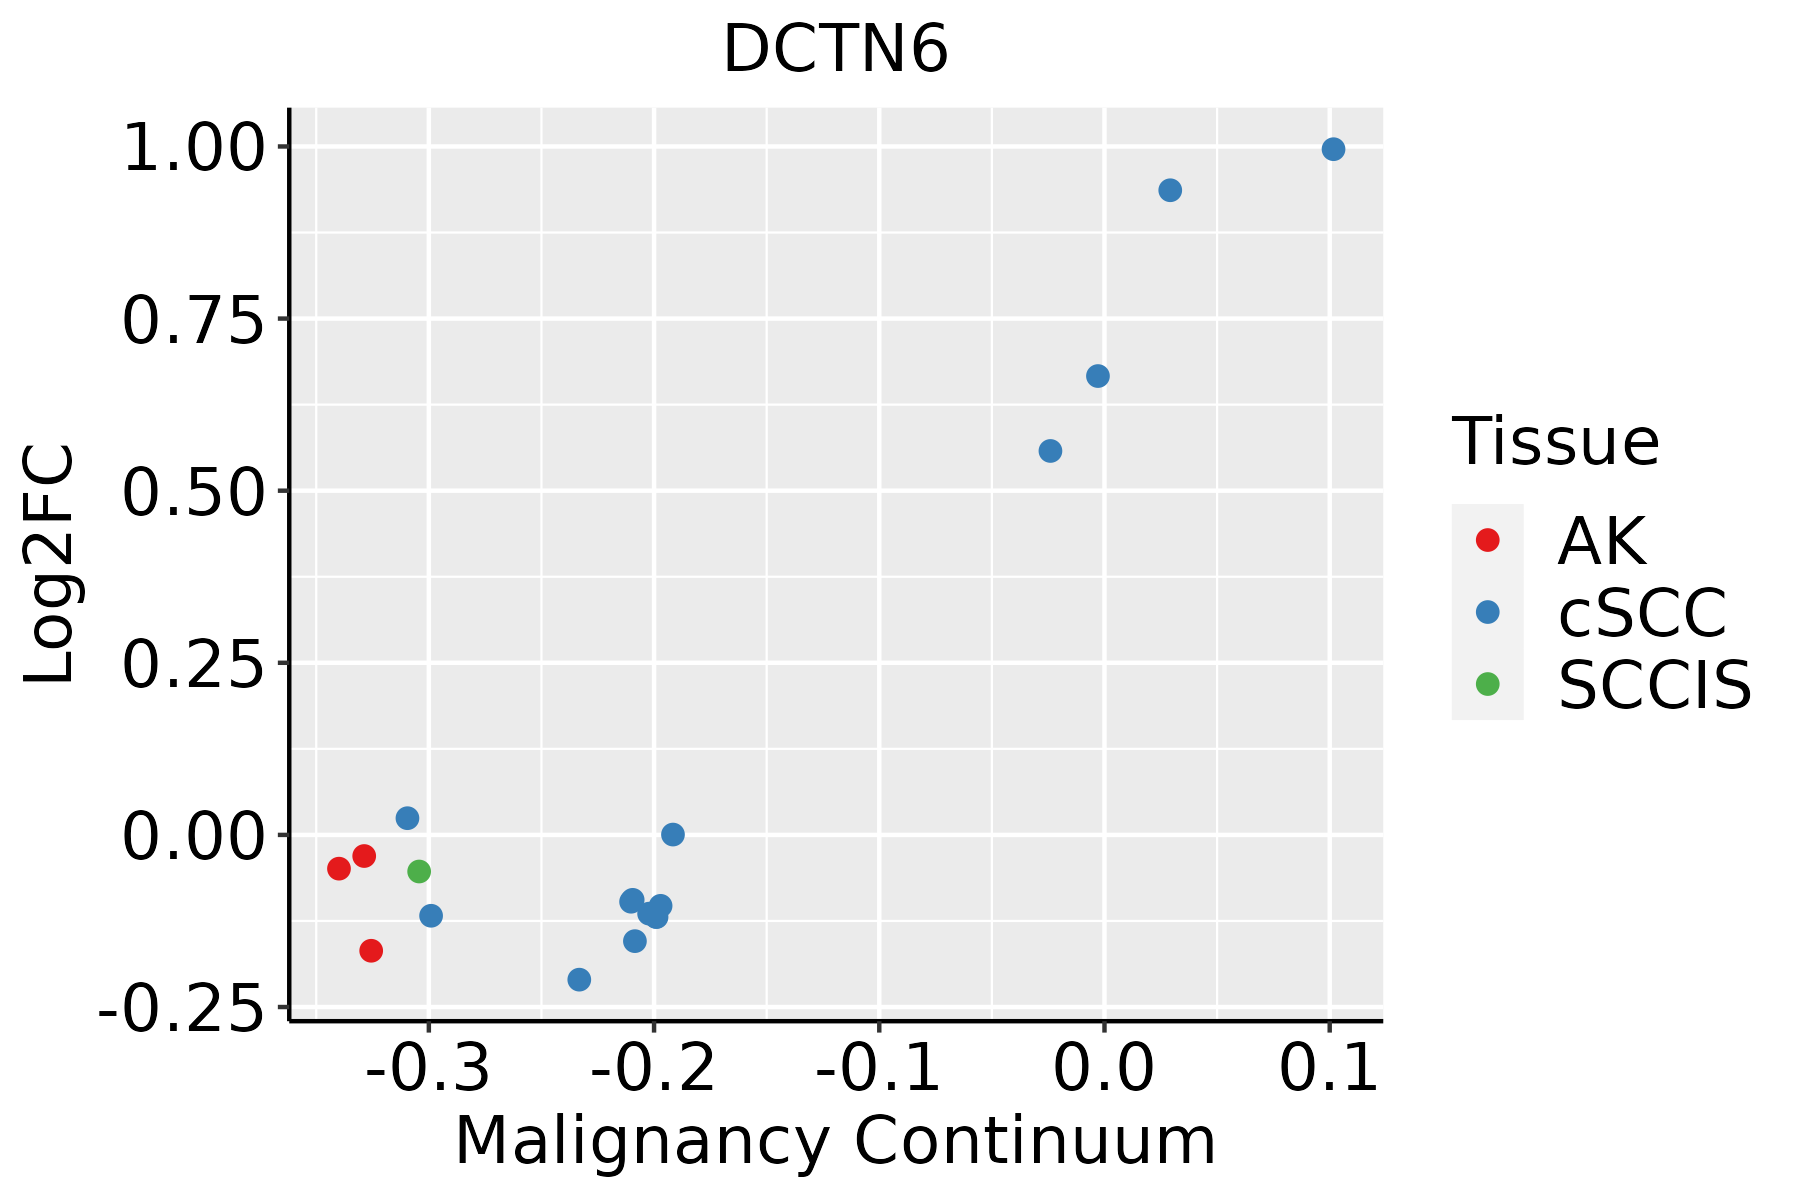 | AK: Actinic keratosis |
| cSCC: Cutaneous squamous cell carcinoma |
| SCCIS:squamous cell carcinoma in situ |
| Thyroid |  | ATC: Anaplastic thyroid cancer |
| HT: Hashimoto's thyroiditis |
| PTC: Papillary thyroid cancer |
| GO ID | Tissue | Disease Stage | Description | Gene Ratio | Bg Ratio | pvalue | p.adjust | Count |
| GO:190285015 | Esophagus | ESCC | microtubule cytoskeleton organization involved in mitosis | 116/8552 | 147/18723 | 1.25e-16 | 9.91e-15 | 116 |
| GO:000705214 | Esophagus | ESCC | mitotic spindle organization | 97/8552 | 120/18723 | 2.17e-15 | 1.33e-13 | 97 |
| GO:000705114 | Esophagus | ESCC | spindle organization | 134/8552 | 184/18723 | 5.70e-14 | 2.87e-12 | 134 |
| GO:00070526 | Oral cavity | OSCC | mitotic spindle organization | 85/7305 | 120/18723 | 1.44e-12 | 6.23e-11 | 85 |
| GO:19028506 | Oral cavity | OSCC | microtubule cytoskeleton organization involved in mitosis | 99/7305 | 147/18723 | 2.94e-12 | 1.18e-10 | 99 |
| GO:00070517 | Oral cavity | OSCC | spindle organization | 117/7305 | 184/18723 | 1.16e-11 | 4.17e-10 | 117 |
| GO:190285014 | Oral cavity | LP | microtubule cytoskeleton organization involved in mitosis | 63/4623 | 147/18723 | 9.97e-07 | 2.50e-05 | 63 |
| GO:000705213 | Oral cavity | LP | mitotic spindle organization | 53/4623 | 120/18723 | 2.36e-06 | 5.22e-05 | 53 |
| GO:000705113 | Oral cavity | LP | spindle organization | 72/4623 | 184/18723 | 9.67e-06 | 1.78e-04 | 72 |
| GO:190285016 | Skin | cSCC | microtubule cytoskeleton organization involved in mitosis | 85/4864 | 147/18723 | 2.66e-16 | 2.39e-14 | 85 |
| GO:000705215 | Skin | cSCC | mitotic spindle organization | 73/4864 | 120/18723 | 7.81e-16 | 6.80e-14 | 73 |
| GO:000705115 | Skin | cSCC | spindle organization | 96/4864 | 184/18723 | 2.59e-14 | 1.77e-12 | 96 |
| GO:000705116 | Thyroid | PTC | spindle organization | 92/5968 | 184/18723 | 2.21e-07 | 3.92e-06 | 92 |
| GO:19028509 | Thyroid | PTC | microtubule cytoskeleton organization involved in mitosis | 76/5968 | 147/18723 | 4.49e-07 | 7.38e-06 | 76 |
| GO:000705216 | Thyroid | PTC | mitotic spindle organization | 64/5968 | 120/18723 | 8.69e-07 | 1.32e-05 | 64 |
| GO:190285017 | Thyroid | ATC | microtubule cytoskeleton organization involved in mitosis | 95/6293 | 147/18723 | 1.29e-14 | 7.62e-13 | 95 |
| GO:000705222 | Thyroid | ATC | mitotic spindle organization | 80/6293 | 120/18723 | 1.27e-13 | 6.46e-12 | 80 |
| GO:000705122 | Thyroid | ATC | spindle organization | 109/6293 | 184/18723 | 7.99e-13 | 3.46e-11 | 109 |
| Pathway ID | Tissue | Disease Stage | Description | Gene Ratio | Bg Ratio | pvalue | p.adjust | qvalue | Count |
| hsa05014210 | Esophagus | ESCC | Amyotrophic lateral sclerosis | 266/4205 | 364/8465 | 1.31e-20 | 2.20e-18 | 1.13e-18 | 266 |
| hsa05132211 | Esophagus | ESCC | Salmonella infection | 191/4205 | 249/8465 | 6.51e-19 | 5.45e-17 | 2.79e-17 | 191 |
| hsa05016210 | Esophagus | ESCC | Huntington disease | 226/4205 | 306/8465 | 1.38e-18 | 8.72e-17 | 4.46e-17 | 226 |
| hsa05022210 | Esophagus | ESCC | Pathways of neurodegeneration - multiple diseases | 318/4205 | 476/8465 | 6.10e-15 | 2.04e-13 | 1.05e-13 | 318 |
| hsa0496223 | Esophagus | ESCC | Vasopressin-regulated water reabsorption | 33/4205 | 44/8465 | 5.27e-04 | 1.78e-03 | 9.13e-04 | 33 |
| hsa0501438 | Esophagus | ESCC | Amyotrophic lateral sclerosis | 266/4205 | 364/8465 | 1.31e-20 | 2.20e-18 | 1.13e-18 | 266 |
| hsa05132310 | Esophagus | ESCC | Salmonella infection | 191/4205 | 249/8465 | 6.51e-19 | 5.45e-17 | 2.79e-17 | 191 |
| hsa0501638 | Esophagus | ESCC | Huntington disease | 226/4205 | 306/8465 | 1.38e-18 | 8.72e-17 | 4.46e-17 | 226 |
| hsa0502238 | Esophagus | ESCC | Pathways of neurodegeneration - multiple diseases | 318/4205 | 476/8465 | 6.10e-15 | 2.04e-13 | 1.05e-13 | 318 |
| hsa0496233 | Esophagus | ESCC | Vasopressin-regulated water reabsorption | 33/4205 | 44/8465 | 5.27e-04 | 1.78e-03 | 9.13e-04 | 33 |
| hsa0501428 | Oral cavity | OSCC | Amyotrophic lateral sclerosis | 246/3704 | 364/8465 | 6.65e-21 | 1.11e-18 | 5.67e-19 | 246 |
| hsa0513230 | Oral cavity | OSCC | Salmonella infection | 174/3704 | 249/8465 | 2.67e-17 | 1.49e-15 | 7.58e-16 | 174 |
| hsa0501628 | Oral cavity | OSCC | Huntington disease | 204/3704 | 306/8465 | 1.70e-16 | 7.13e-15 | 3.63e-15 | 204 |
| hsa0502228 | Oral cavity | OSCC | Pathways of neurodegeneration - multiple diseases | 292/3704 | 476/8465 | 1.60e-15 | 4.47e-14 | 2.28e-14 | 292 |
| hsa049626 | Oral cavity | OSCC | Vasopressin-regulated water reabsorption | 29/3704 | 44/8465 | 2.47e-03 | 6.52e-03 | 3.32e-03 | 29 |
| hsa05014112 | Oral cavity | OSCC | Amyotrophic lateral sclerosis | 246/3704 | 364/8465 | 6.65e-21 | 1.11e-18 | 5.67e-19 | 246 |
| hsa05132114 | Oral cavity | OSCC | Salmonella infection | 174/3704 | 249/8465 | 2.67e-17 | 1.49e-15 | 7.58e-16 | 174 |
| hsa05016112 | Oral cavity | OSCC | Huntington disease | 204/3704 | 306/8465 | 1.70e-16 | 7.13e-15 | 3.63e-15 | 204 |
| hsa05022112 | Oral cavity | OSCC | Pathways of neurodegeneration - multiple diseases | 292/3704 | 476/8465 | 1.60e-15 | 4.47e-14 | 2.28e-14 | 292 |
| hsa0496213 | Oral cavity | OSCC | Vasopressin-regulated water reabsorption | 29/3704 | 44/8465 | 2.47e-03 | 6.52e-03 | 3.32e-03 | 29 |
| Hugo Symbol | Variant Class | Variant Classification | dbSNP RS | HGVSc | HGVSp | HGVSp Short | SWISSPROT | BIOTYPE | SIFT | PolyPhen | Tumor Sample Barcode | Tissue | Histology | Sex | Age | Stage | Therapy Types | Drugs | Outcome |
| DCTN6 | SNV | Missense_Mutation | novel | c.122N>C | p.Ile41Thr | p.I41T | O00399 | protein_coding | deleterious(0) | probably_damaging(0.956) | TCGA-AN-A046-01 | Breast | breast invasive carcinoma | Female | >=65 | I/II | Unknown | Unknown | SD |
| DCTN6 | SNV | Missense_Mutation | rs372379363 | c.374T>C | p.Ile125Thr | p.I125T | O00399 | protein_coding | deleterious(0.04) | possibly_damaging(0.886) | TCGA-HN-A2NL-01 | Breast | breast invasive carcinoma | Female | <65 | I/II | Chemotherapy | cyclophosphamide | SD |
| DCTN6 | SNV | Missense_Mutation | | c.398N>T | p.Thr133Ile | p.T133I | O00399 | protein_coding | deleterious(0.04) | benign(0.424) | TCGA-FU-A3HZ-01 | Cervix | cervical & endocervical cancer | Female | <65 | I/II | Chemotherapy | cisplatin | CR |
| DCTN6 | SNV | Missense_Mutation | rs758874465 | c.403N>A | p.Glu135Lys | p.E135K | O00399 | protein_coding | deleterious(0.03) | probably_damaging(0.992) | TCGA-VS-A9UJ-01 | Cervix | cervical & endocervical cancer | Female | <65 | I/II | Unknown | Unknown | PD |
| DCTN6 | SNV | Missense_Mutation | novel | c.76N>T | p.Asp26Tyr | p.D26Y | O00399 | protein_coding | deleterious(0) | probably_damaging(0.975) | TCGA-AG-A002-01 | Colorectum | rectum adenocarcinoma | Male | <65 | I/II | Unknown | Unknown | SD |
| DCTN6 | SNV | Missense_Mutation | novel | c.292N>A | p.Ala98Thr | p.A98T | O00399 | protein_coding | deleterious(0.05) | benign(0.305) | TCGA-A5-A0G1-01 | Endometrium | uterine corpus endometrioid carcinoma | Female | >=65 | I/II | Unknown | Unknown | SD |
| DCTN6 | SNV | Missense_Mutation | novel | c.298A>G | p.Lys100Glu | p.K100E | O00399 | protein_coding | tolerated(0.22) | benign(0.091) | TCGA-A5-A0G2-01 | Endometrium | uterine corpus endometrioid carcinoma | Female | <65 | III/IV | Unknown | Unknown | SD |
| DCTN6 | SNV | Missense_Mutation | novel | c.226G>T | p.Asp76Tyr | p.D76Y | O00399 | protein_coding | deleterious(0.04) | benign(0.235) | TCGA-AP-A1DV-01 | Endometrium | uterine corpus endometrioid carcinoma | Female | <65 | I/II | Unknown | Unknown | SD |
| DCTN6 | SNV | Missense_Mutation | novel | c.59N>G | p.Glu20Gly | p.E20G | O00399 | protein_coding | deleterious(0) | probably_damaging(0.951) | TCGA-AX-A06F-01 | Endometrium | uterine corpus endometrioid carcinoma | Female | <65 | III/IV | Chemotherapy | carboplatin | SD |
| DCTN6 | SNV | Missense_Mutation | novel | c.317N>C | p.Val106Ala | p.V106A | O00399 | protein_coding | deleterious(0.04) | probably_damaging(0.913) | TCGA-AX-A06F-01 | Endometrium | uterine corpus endometrioid carcinoma | Female | <65 | III/IV | Chemotherapy | carboplatin | SD |


