
|
|||||
|
 | |
| |
| |
| |
| |
| |
|
Gene: DCTN5 |
Gene summary for DCTN5 |
| Gene information | Species | Human | Gene symbol | DCTN5 | Gene ID | 84516 |
| Gene name | dynactin subunit 5 | |
| Gene Alias | DCTN5 | |
| Cytomap | 16p12.2 | |
| Gene Type | protein-coding | GO ID | GO:0001568 | UniProtAcc | Q9BTE1 |
Top |
Malignant transformation analysis |
| Identification of the aberrant gene expression in precancerous and cancerous lesions by comparing the gene expression of stem-like cells in diseased tissues with normal stem cells |
| Entrez ID | Symbol | Replicates | Species | Organ | Tissue | Adj P-value | Log2FC | Malignancy |
| 84516 | DCTN5 | LZE4T | Human | Esophagus | ESCC | 3.29e-10 | 2.74e-01 | 0.0811 |
| 84516 | DCTN5 | LZE7T | Human | Esophagus | ESCC | 5.73e-07 | 3.28e-01 | 0.0667 |
| 84516 | DCTN5 | LZE8T | Human | Esophagus | ESCC | 4.37e-05 | 1.84e-01 | 0.067 |
| 84516 | DCTN5 | LZE20T | Human | Esophagus | ESCC | 5.61e-05 | 1.59e-01 | 0.0662 |
| 84516 | DCTN5 | LZE22T | Human | Esophagus | ESCC | 3.12e-05 | 3.95e-01 | 0.068 |
| 84516 | DCTN5 | LZE24T | Human | Esophagus | ESCC | 5.78e-06 | 2.21e-01 | 0.0596 |
| 84516 | DCTN5 | LZE21T | Human | Esophagus | ESCC | 1.00e-02 | 2.73e-01 | 0.0655 |
| 84516 | DCTN5 | P1T-E | Human | Esophagus | ESCC | 1.79e-08 | 5.14e-01 | 0.0875 |
| 84516 | DCTN5 | P2T-E | Human | Esophagus | ESCC | 2.85e-42 | 6.53e-01 | 0.1177 |
| 84516 | DCTN5 | P4T-E | Human | Esophagus | ESCC | 2.35e-15 | 3.94e-01 | 0.1323 |
| 84516 | DCTN5 | P5T-E | Human | Esophagus | ESCC | 3.80e-30 | 4.79e-01 | 0.1327 |
| 84516 | DCTN5 | P8T-E | Human | Esophagus | ESCC | 5.82e-25 | 4.44e-01 | 0.0889 |
| 84516 | DCTN5 | P9T-E | Human | Esophagus | ESCC | 1.07e-05 | 8.49e-02 | 0.1131 |
| 84516 | DCTN5 | P10T-E | Human | Esophagus | ESCC | 8.63e-18 | 2.46e-01 | 0.116 |
| 84516 | DCTN5 | P11T-E | Human | Esophagus | ESCC | 6.21e-16 | 6.56e-01 | 0.1426 |
| 84516 | DCTN5 | P12T-E | Human | Esophagus | ESCC | 3.27e-31 | 5.63e-01 | 0.1122 |
| 84516 | DCTN5 | P15T-E | Human | Esophagus | ESCC | 4.85e-18 | 3.15e-01 | 0.1149 |
| 84516 | DCTN5 | P16T-E | Human | Esophagus | ESCC | 6.68e-21 | 3.68e-01 | 0.1153 |
| 84516 | DCTN5 | P17T-E | Human | Esophagus | ESCC | 1.54e-04 | 3.30e-01 | 0.1278 |
| 84516 | DCTN5 | P19T-E | Human | Esophagus | ESCC | 5.53e-08 | 6.27e-01 | 0.1662 |
| Page: 1 2 3 4 5 |
| Tissue | Expression Dynamics | Abbreviation |
| Esophagus |  | ESCC: Esophageal squamous cell carcinoma |
| HGIN: High-grade intraepithelial neoplasias | ||
| LGIN: Low-grade intraepithelial neoplasias | ||
| Liver |  | HCC: Hepatocellular carcinoma |
| NAFLD: Non-alcoholic fatty liver disease | ||
| Oral Cavity | 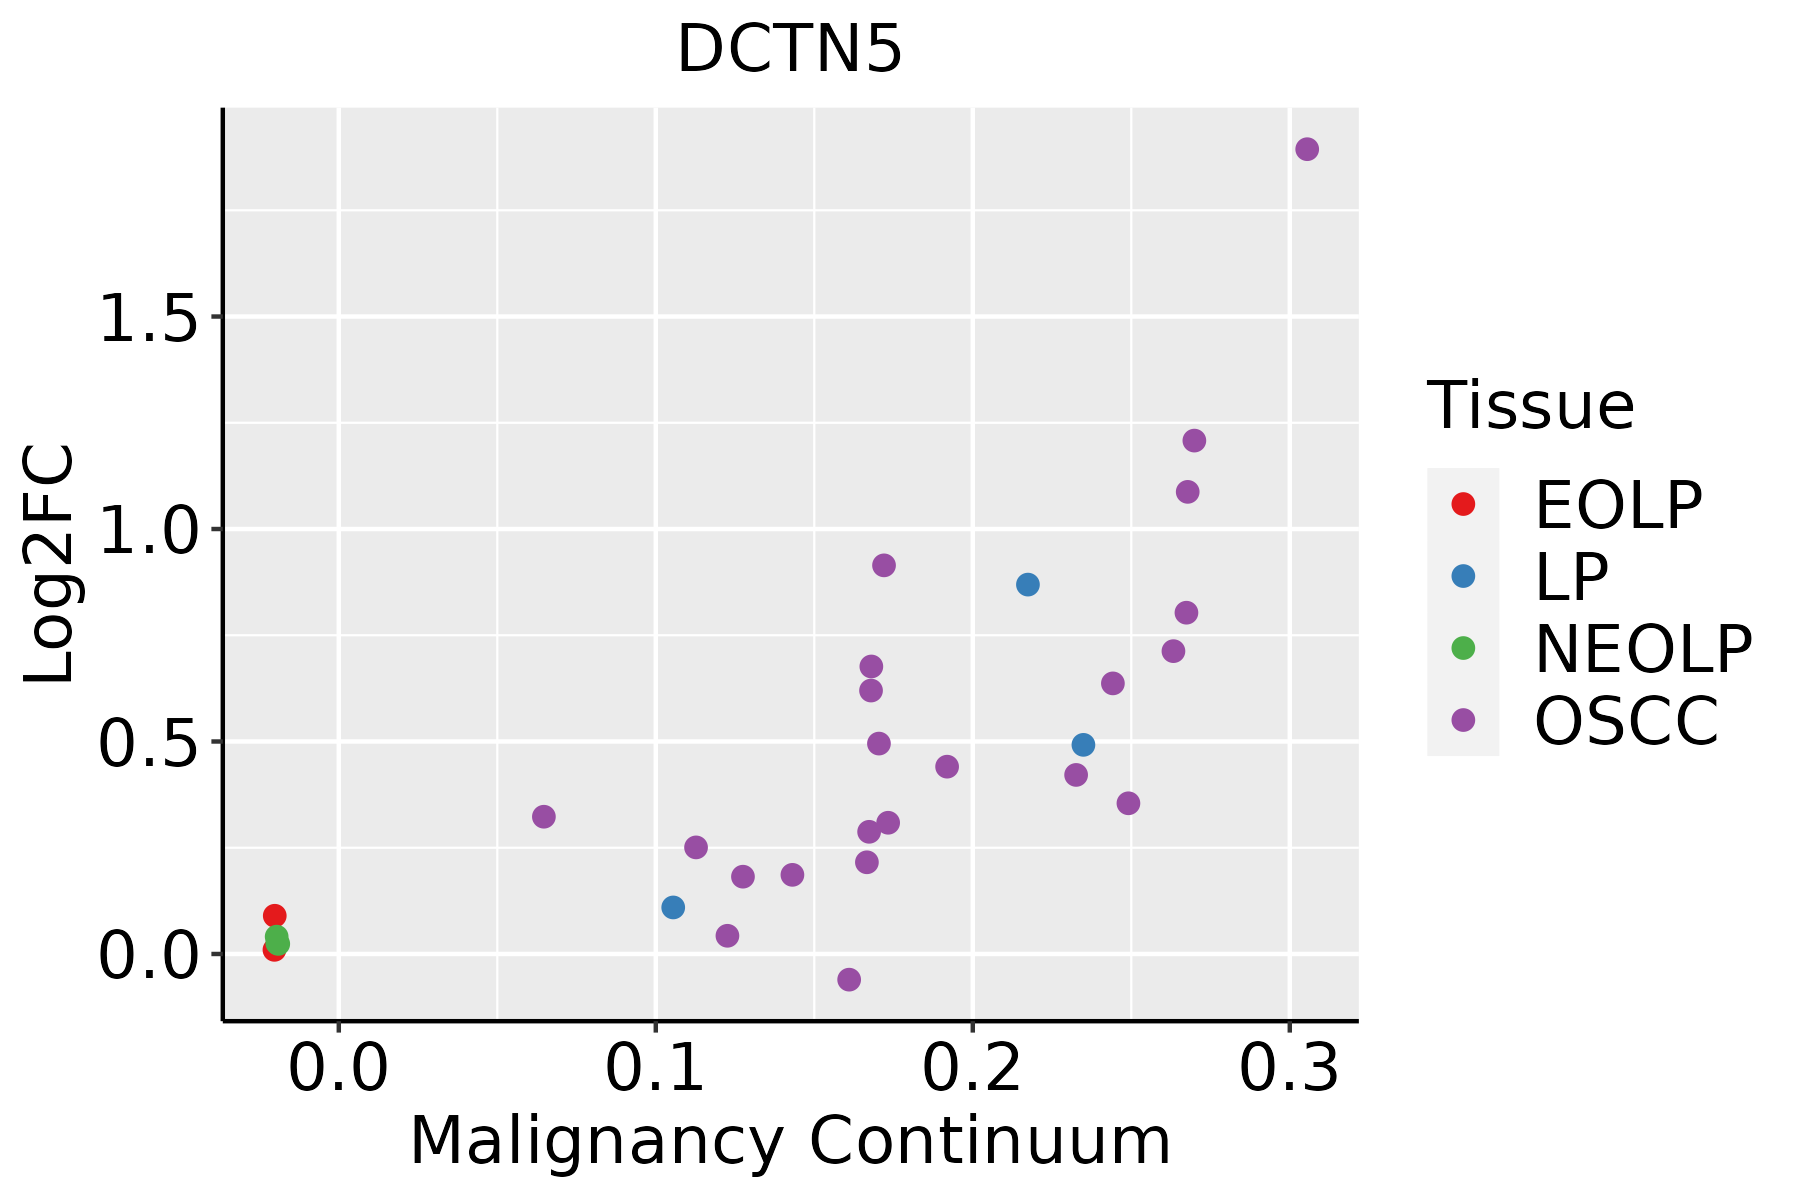 | EOLP: Erosive Oral lichen planus |
| LP: leukoplakia | ||
| NEOLP: Non-erosive oral lichen planus | ||
| OSCC: Oral squamous cell carcinoma | ||
| Skin |  | AK: Actinic keratosis |
| cSCC: Cutaneous squamous cell carcinoma | ||
| SCCIS:squamous cell carcinoma in situ |
| ∗log2FC in expression of this searched gene in stem-like cells from each diseased tissue sample relative to stem-like cells in normal samples in each tissue plotted against the malignancy continuum. Samples are colored based on if they are from different disease stage. |
Top |
Malignant transformation related pathway analysis |
| Find out the enriched GO biological processes and KEGG pathways involved in transition from healthy to precancer to cancer |
| Tissue | Disease Stage | Enriched GO biological Processes |
| Colorectum | AD |  |
| Colorectum | SER |  |
| Colorectum | MSS |  |
| Colorectum | MSI-H |  |
| Colorectum | FAP |  |
| ∗Top 15 enriched GO BP terms are showed in the bar plot of each disease state in each tissue. Each row represents a significant GO biological process which is colored according to the -log10(p.adjust). |
| Page: 1 2 3 4 5 6 7 8 9 |
| GO ID | Tissue | Disease Stage | Description | Gene Ratio | Bg Ratio | pvalue | p.adjust | Count |
| Page: 1 |
| Pathway ID | Tissue | Disease Stage | Description | Gene Ratio | Bg Ratio | pvalue | p.adjust | qvalue | Count |
| hsa05014210 | Esophagus | ESCC | Amyotrophic lateral sclerosis | 266/4205 | 364/8465 | 1.31e-20 | 2.20e-18 | 1.13e-18 | 266 |
| hsa05132211 | Esophagus | ESCC | Salmonella infection | 191/4205 | 249/8465 | 6.51e-19 | 5.45e-17 | 2.79e-17 | 191 |
| hsa05016210 | Esophagus | ESCC | Huntington disease | 226/4205 | 306/8465 | 1.38e-18 | 8.72e-17 | 4.46e-17 | 226 |
| hsa05022210 | Esophagus | ESCC | Pathways of neurodegeneration - multiple diseases | 318/4205 | 476/8465 | 6.10e-15 | 2.04e-13 | 1.05e-13 | 318 |
| hsa0496223 | Esophagus | ESCC | Vasopressin-regulated water reabsorption | 33/4205 | 44/8465 | 5.27e-04 | 1.78e-03 | 9.13e-04 | 33 |
| hsa0501438 | Esophagus | ESCC | Amyotrophic lateral sclerosis | 266/4205 | 364/8465 | 1.31e-20 | 2.20e-18 | 1.13e-18 | 266 |
| hsa05132310 | Esophagus | ESCC | Salmonella infection | 191/4205 | 249/8465 | 6.51e-19 | 5.45e-17 | 2.79e-17 | 191 |
| hsa0501638 | Esophagus | ESCC | Huntington disease | 226/4205 | 306/8465 | 1.38e-18 | 8.72e-17 | 4.46e-17 | 226 |
| hsa0502238 | Esophagus | ESCC | Pathways of neurodegeneration - multiple diseases | 318/4205 | 476/8465 | 6.10e-15 | 2.04e-13 | 1.05e-13 | 318 |
| hsa0496233 | Esophagus | ESCC | Vasopressin-regulated water reabsorption | 33/4205 | 44/8465 | 5.27e-04 | 1.78e-03 | 9.13e-04 | 33 |
| hsa0501622 | Liver | HCC | Huntington disease | 219/4020 | 306/8465 | 3.06e-18 | 3.42e-16 | 1.90e-16 | 219 |
| hsa0501422 | Liver | HCC | Amyotrophic lateral sclerosis | 252/4020 | 364/8465 | 8.85e-18 | 7.41e-16 | 4.12e-16 | 252 |
| hsa0513242 | Liver | HCC | Salmonella infection | 178/4020 | 249/8465 | 5.90e-15 | 1.98e-13 | 1.10e-13 | 178 |
| hsa0502222 | Liver | HCC | Pathways of neurodegeneration - multiple diseases | 298/4020 | 476/8465 | 6.59e-12 | 1.30e-10 | 7.22e-11 | 298 |
| hsa049624 | Liver | HCC | Vasopressin-regulated water reabsorption | 30/4020 | 44/8465 | 4.41e-03 | 1.32e-02 | 7.34e-03 | 30 |
| hsa0501632 | Liver | HCC | Huntington disease | 219/4020 | 306/8465 | 3.06e-18 | 3.42e-16 | 1.90e-16 | 219 |
| hsa0501432 | Liver | HCC | Amyotrophic lateral sclerosis | 252/4020 | 364/8465 | 8.85e-18 | 7.41e-16 | 4.12e-16 | 252 |
| hsa0513252 | Liver | HCC | Salmonella infection | 178/4020 | 249/8465 | 5.90e-15 | 1.98e-13 | 1.10e-13 | 178 |
| hsa0502232 | Liver | HCC | Pathways of neurodegeneration - multiple diseases | 298/4020 | 476/8465 | 6.59e-12 | 1.30e-10 | 7.22e-11 | 298 |
| hsa0496211 | Liver | HCC | Vasopressin-regulated water reabsorption | 30/4020 | 44/8465 | 4.41e-03 | 1.32e-02 | 7.34e-03 | 30 |
| Page: 1 2 |
Top |
Cell-cell communication analysis |
| Identification of potential cell-cell interactions between two cell types and their ligand-receptor pairs for different disease states |
| Ligand | Receptor | LRpair | Pathway | Tissue | Disease Stage |
| Page: 1 |
Top |
Single-cell gene regulatory network inference analysis |
| Find out the significant the regulons (TFs) and the target genes of each regulon across cell types for different disease states |
| TF | Cell Type | Tissue | Disease Stage | Target Gene | RSS | Regulon Activity |
| ∗The dot plots of a searched regulon are shown for all cell subpopulations in each disease state of each tissue based on the regulon specific score inferred using pySCENIC and by calculating the average expression. |
| Page: 1 |
Top |
Somatic mutation of malignant transformation related genes |
| Annotation of somatic variants for genes involved in malignant transformation |
| Hugo Symbol | Variant Class | Variant Classification | dbSNP RS | HGVSc | HGVSp | HGVSp Short | SWISSPROT | BIOTYPE | SIFT | PolyPhen | Tumor Sample Barcode | Tissue | Histology | Sex | Age | Stage | Therapy Types | Drugs | Outcome |
| DCTN5 | SNV | Missense_Mutation | c.176G>A | p.Arg59His | p.R59H | Q9BTE1 | protein_coding | deleterious(0) | benign(0.092) | TCGA-A6-3809-01 | Colorectum | colon adenocarcinoma | Female | >=65 | I/II | Unknown | Unknown | SD | |
| DCTN5 | SNV | Missense_Mutation | rs764481027 | c.353N>A | p.Arg118His | p.R118H | Q9BTE1 | protein_coding | deleterious(0) | probably_damaging(0.93) | TCGA-AA-3713-01 | Colorectum | colon adenocarcinoma | Male | >=65 | III/IV | Chemotherapy | 5-fluorouracil | PR |
| DCTN5 | SNV | Missense_Mutation | novel | c.323N>C | p.Val108Ala | p.V108A | Q9BTE1 | protein_coding | deleterious(0) | possibly_damaging(0.796) | TCGA-EI-6917-01 | Colorectum | rectum adenocarcinoma | Male | <65 | III/IV | Chemotherapy | 5fluorouracil+oxaciplatina+l-folinian | SD |
| DCTN5 | SNV | Missense_Mutation | rs373307086 | c.352N>T | p.Arg118Cys | p.R118C | Q9BTE1 | protein_coding | deleterious(0) | benign(0.08) | TCGA-EI-6917-01 | Colorectum | rectum adenocarcinoma | Male | <65 | III/IV | Chemotherapy | 5fluorouracil+oxaciplatina+l-folinian | SD |
| DCTN5 | SNV | Missense_Mutation | c.103N>A | p.Val35Ile | p.V35I | Q9BTE1 | protein_coding | tolerated(0.94) | benign(0.013) | TCGA-A5-A0G1-01 | Endometrium | uterine corpus endometrioid carcinoma | Female | >=65 | I/II | Unknown | Unknown | SD | |
| DCTN5 | SNV | Missense_Mutation | c.196N>T | p.Arg66Cys | p.R66C | Q9BTE1 | protein_coding | deleterious(0.02) | benign(0.007) | TCGA-AX-A063-01 | Endometrium | uterine corpus endometrioid carcinoma | Female | <65 | I/II | Unknown | Unknown | SD | |
| DCTN5 | SNV | Missense_Mutation | c.134A>G | p.Asp45Gly | p.D45G | Q9BTE1 | protein_coding | tolerated(0.9) | benign(0.003) | TCGA-B5-A0K6-01 | Endometrium | uterine corpus endometrioid carcinoma | Female | <65 | I/II | Unknown | Unknown | SD | |
| DCTN5 | SNV | Missense_Mutation | rs373307086 | c.352N>T | p.Arg118Cys | p.R118C | Q9BTE1 | protein_coding | deleterious(0) | benign(0.08) | TCGA-B5-A3FC-01 | Endometrium | uterine corpus endometrioid carcinoma | Female | <65 | I/II | Unknown | Unknown | SD |
| DCTN5 | SNV | Missense_Mutation | novel | c.525G>T | p.Lys175Asn | p.K175N | Q9BTE1 | protein_coding | tolerated(1) | benign(0) | TCGA-BS-A0UF-01 | Endometrium | uterine corpus endometrioid carcinoma | Female | >=65 | I/II | Unknown | Unknown | SD |
| DCTN5 | SNV | Missense_Mutation | novel | c.400N>G | p.Leu134Val | p.L134V | Q9BTE1 | protein_coding | tolerated(0.92) | benign(0.065) | TCGA-D1-A1NZ-01 | Endometrium | uterine corpus endometrioid carcinoma | Female | <65 | I/II | Unknown | Unknown | SD |
| Page: 1 2 |
Top |
Related drugs of malignant transformation related genes |
| Identification of chemicals and drugs interact with genes involved in malignant transfromation |
| (DGIdb 4.0) |
| Entrez ID | Symbol | Category | Interaction Types | Drug Claim Name | Drug Name | PMIDs |
| Page: 1 |

Copyright 2023-Present -The University of Texas Health Science Center at Houston |