
|
|||||
|
 | |
| |
| |
| |
| |
| |
|
Gene: DCTN4 |
Gene summary for DCTN4 |
| Gene information | Species | Human | Gene symbol | DCTN4 | Gene ID | 51164 |
| Gene name | dynactin subunit 4 | |
| Gene Alias | DYN4 | |
| Cytomap | 5q33.1 | |
| Gene Type | protein-coding | GO ID | GO:0000775 | UniProtAcc | Q9NSJ5 |
Top |
Malignant transformation analysis |
| Identification of the aberrant gene expression in precancerous and cancerous lesions by comparing the gene expression of stem-like cells in diseased tissues with normal stem cells |
| Entrez ID | Symbol | Replicates | Species | Organ | Tissue | Adj P-value | Log2FC | Malignancy |
| 51164 | DCTN4 | LZE2D | Human | Esophagus | HGIN | 4.47e-02 | 2.66e-01 | 0.0642 |
| 51164 | DCTN4 | LZE3D | Human | Esophagus | HGIN | 2.35e-03 | 6.81e-01 | 0.0668 |
| 51164 | DCTN4 | LZE4T | Human | Esophagus | ESCC | 2.97e-13 | 3.23e-01 | 0.0811 |
| 51164 | DCTN4 | LZE8T | Human | Esophagus | ESCC | 3.14e-10 | 3.13e-01 | 0.067 |
| 51164 | DCTN4 | LZE20T | Human | Esophagus | ESCC | 1.43e-02 | -2.64e-03 | 0.0662 |
| 51164 | DCTN4 | LZE24T | Human | Esophagus | ESCC | 9.71e-19 | 5.84e-01 | 0.0596 |
| 51164 | DCTN4 | LZE6T | Human | Esophagus | ESCC | 9.42e-07 | 1.29e-01 | 0.0845 |
| 51164 | DCTN4 | P1T-E | Human | Esophagus | ESCC | 4.73e-06 | 1.98e-01 | 0.0875 |
| 51164 | DCTN4 | P2T-E | Human | Esophagus | ESCC | 1.16e-26 | 5.48e-01 | 0.1177 |
| 51164 | DCTN4 | P4T-E | Human | Esophagus | ESCC | 1.40e-19 | 3.41e-01 | 0.1323 |
| 51164 | DCTN4 | P5T-E | Human | Esophagus | ESCC | 6.03e-23 | 2.92e-01 | 0.1327 |
| 51164 | DCTN4 | P8T-E | Human | Esophagus | ESCC | 1.31e-16 | 1.81e-01 | 0.0889 |
| 51164 | DCTN4 | P9T-E | Human | Esophagus | ESCC | 9.41e-11 | 1.47e-01 | 0.1131 |
| 51164 | DCTN4 | P10T-E | Human | Esophagus | ESCC | 2.03e-14 | 2.78e-01 | 0.116 |
| 51164 | DCTN4 | P11T-E | Human | Esophagus | ESCC | 4.32e-19 | 8.16e-01 | 0.1426 |
| 51164 | DCTN4 | P12T-E | Human | Esophagus | ESCC | 8.07e-30 | 4.57e-01 | 0.1122 |
| 51164 | DCTN4 | P15T-E | Human | Esophagus | ESCC | 1.20e-21 | 4.37e-01 | 0.1149 |
| 51164 | DCTN4 | P16T-E | Human | Esophagus | ESCC | 2.41e-25 | 4.07e-01 | 0.1153 |
| 51164 | DCTN4 | P17T-E | Human | Esophagus | ESCC | 1.29e-11 | 3.93e-01 | 0.1278 |
| 51164 | DCTN4 | P19T-E | Human | Esophagus | ESCC | 3.99e-06 | 5.54e-01 | 0.1662 |
| Page: 1 2 3 4 5 |
| Tissue | Expression Dynamics | Abbreviation |
| Esophagus |  | ESCC: Esophageal squamous cell carcinoma |
| HGIN: High-grade intraepithelial neoplasias | ||
| LGIN: Low-grade intraepithelial neoplasias | ||
| Liver | 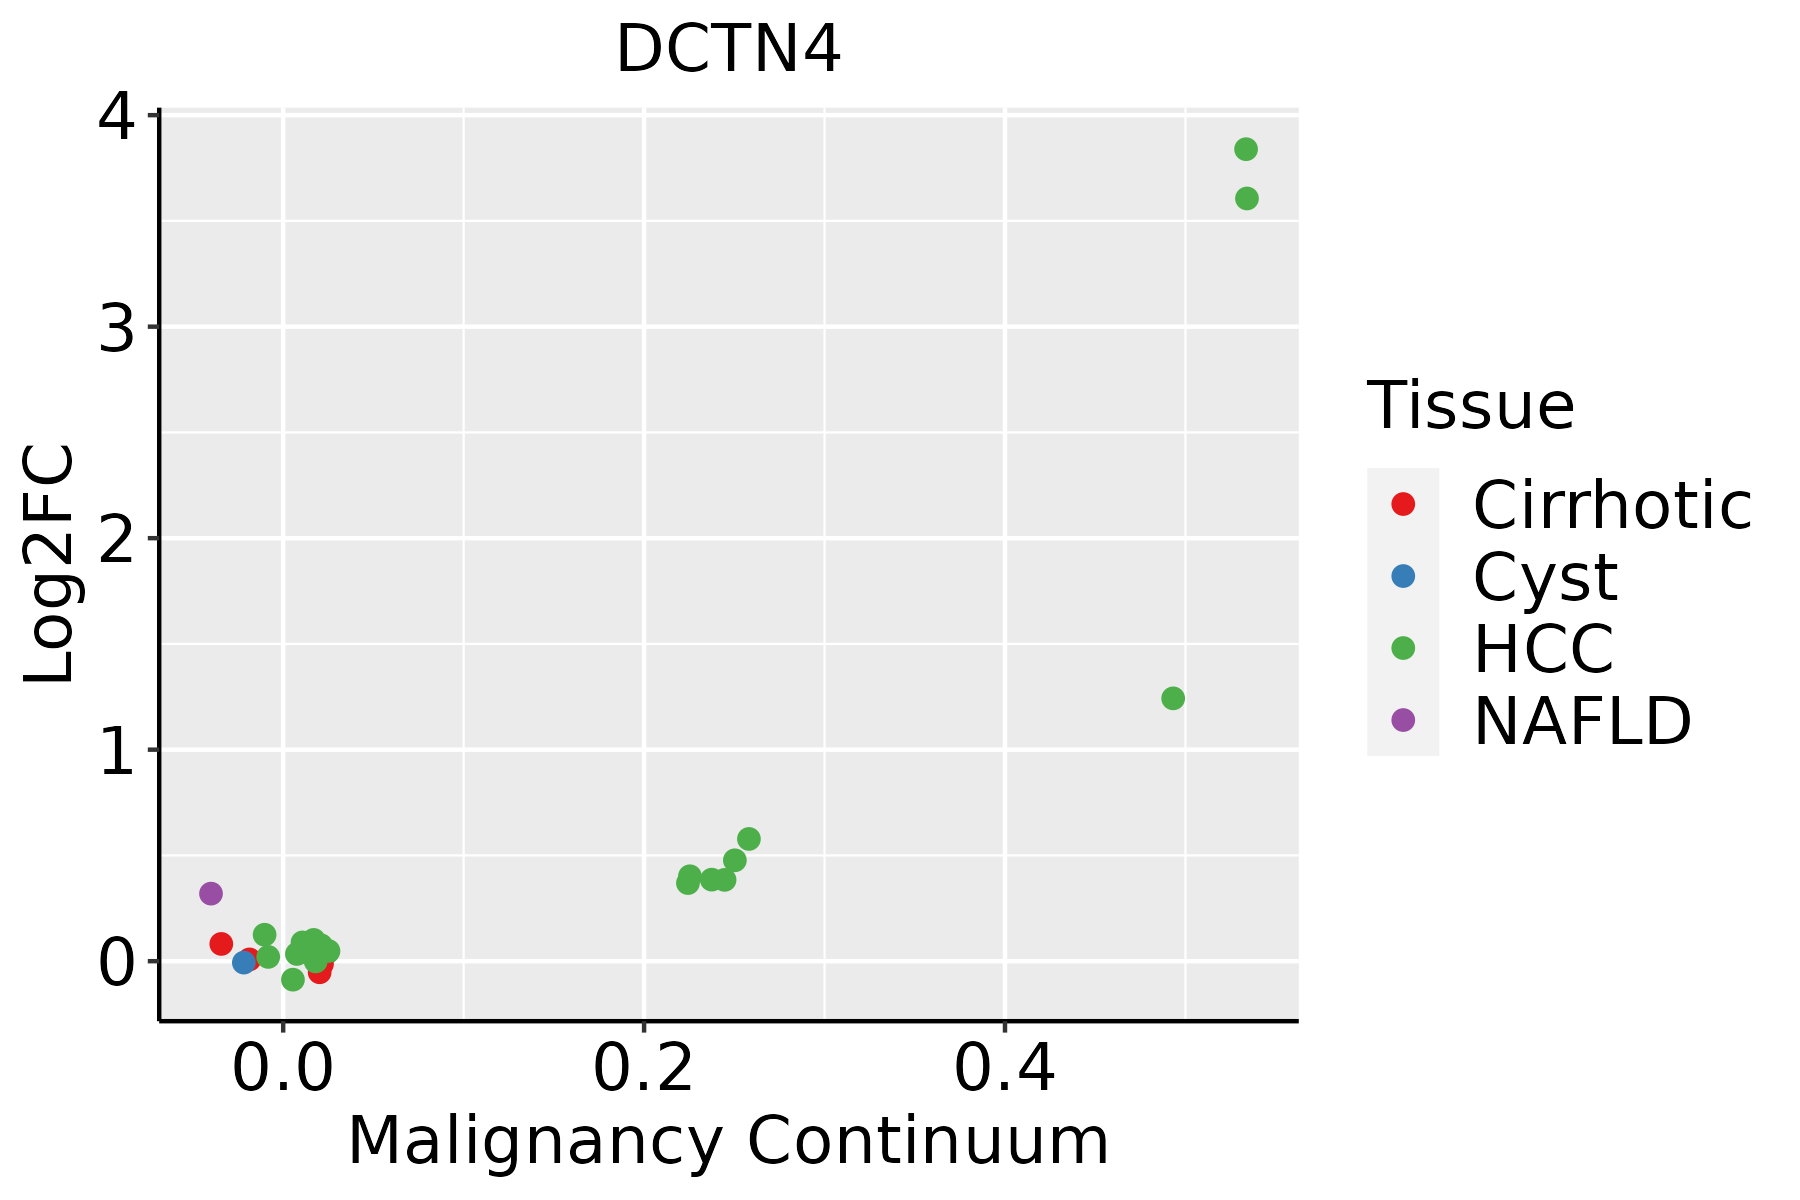 | HCC: Hepatocellular carcinoma |
| NAFLD: Non-alcoholic fatty liver disease | ||
| Oral Cavity | 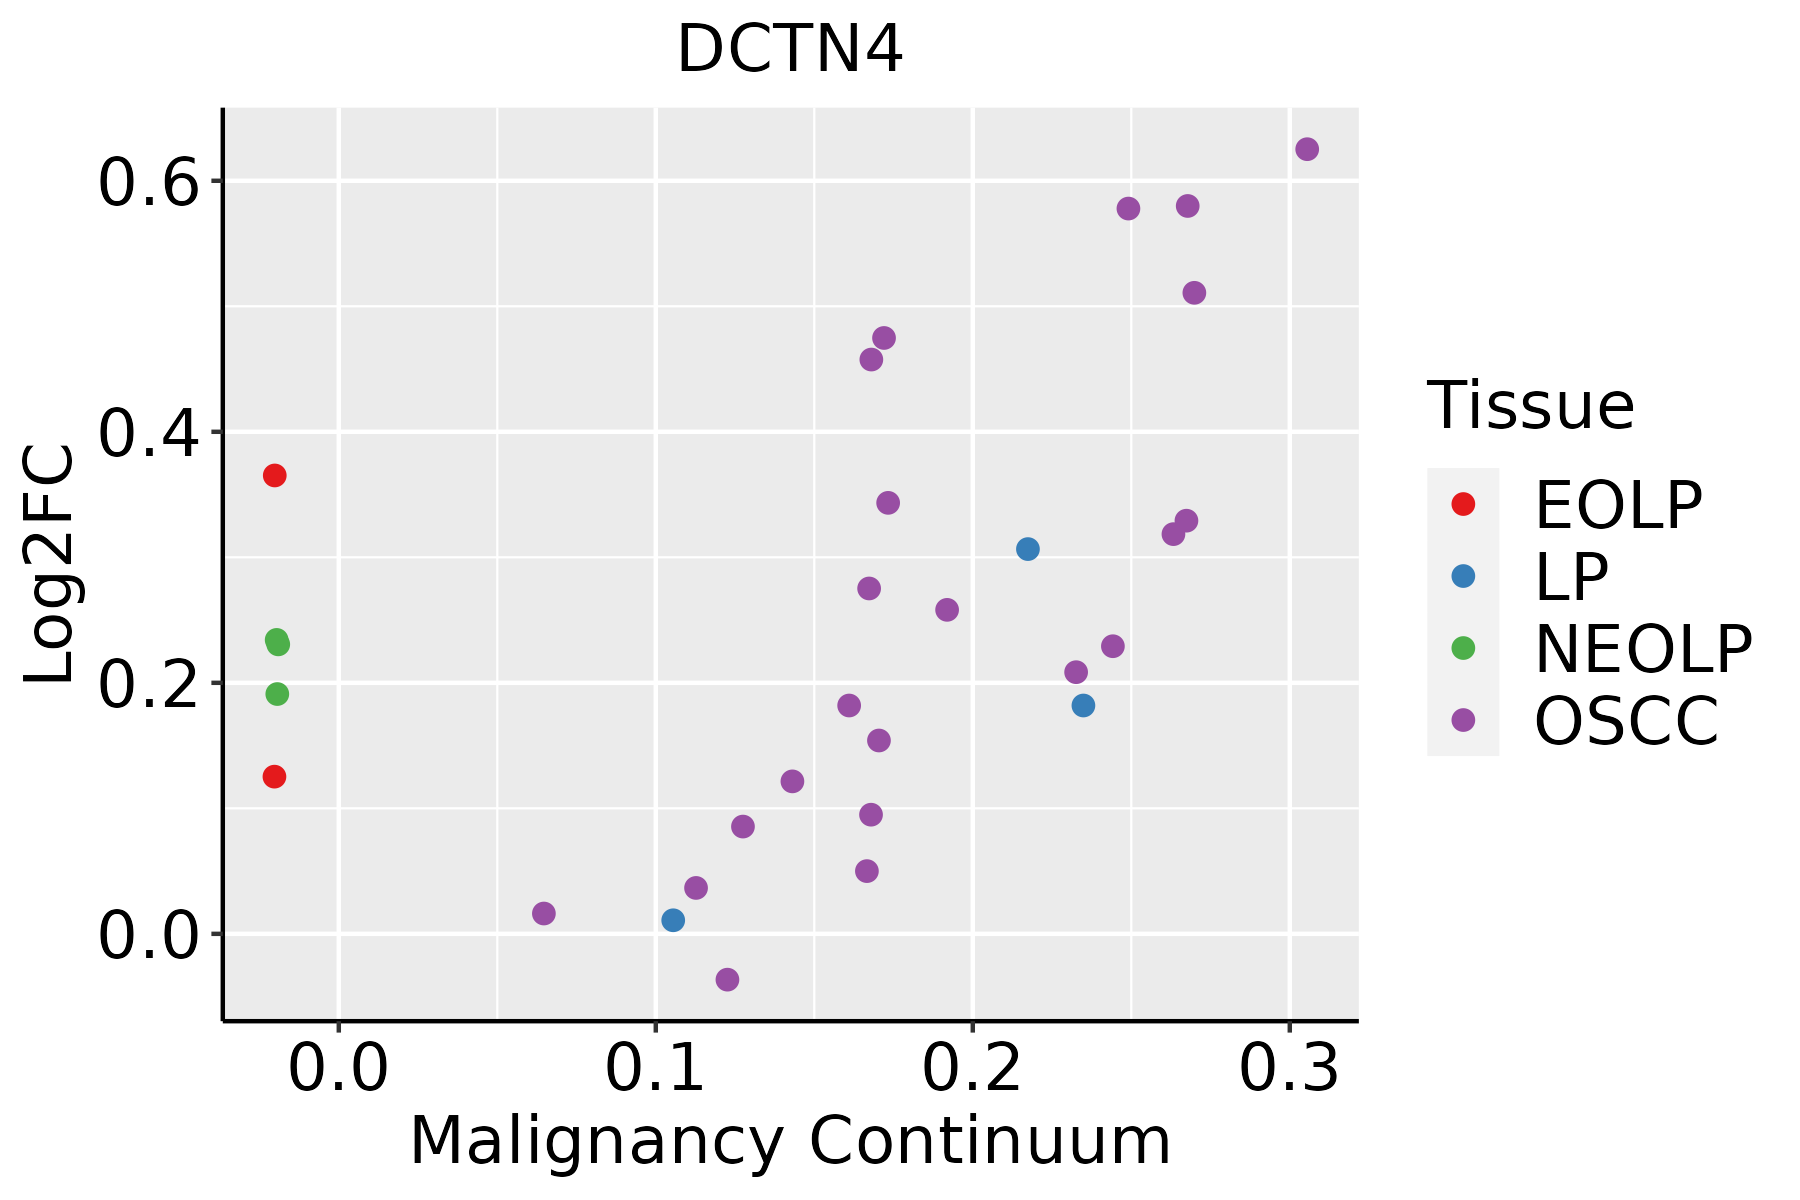 | EOLP: Erosive Oral lichen planus |
| LP: leukoplakia | ||
| NEOLP: Non-erosive oral lichen planus | ||
| OSCC: Oral squamous cell carcinoma | ||
| Thyroid | 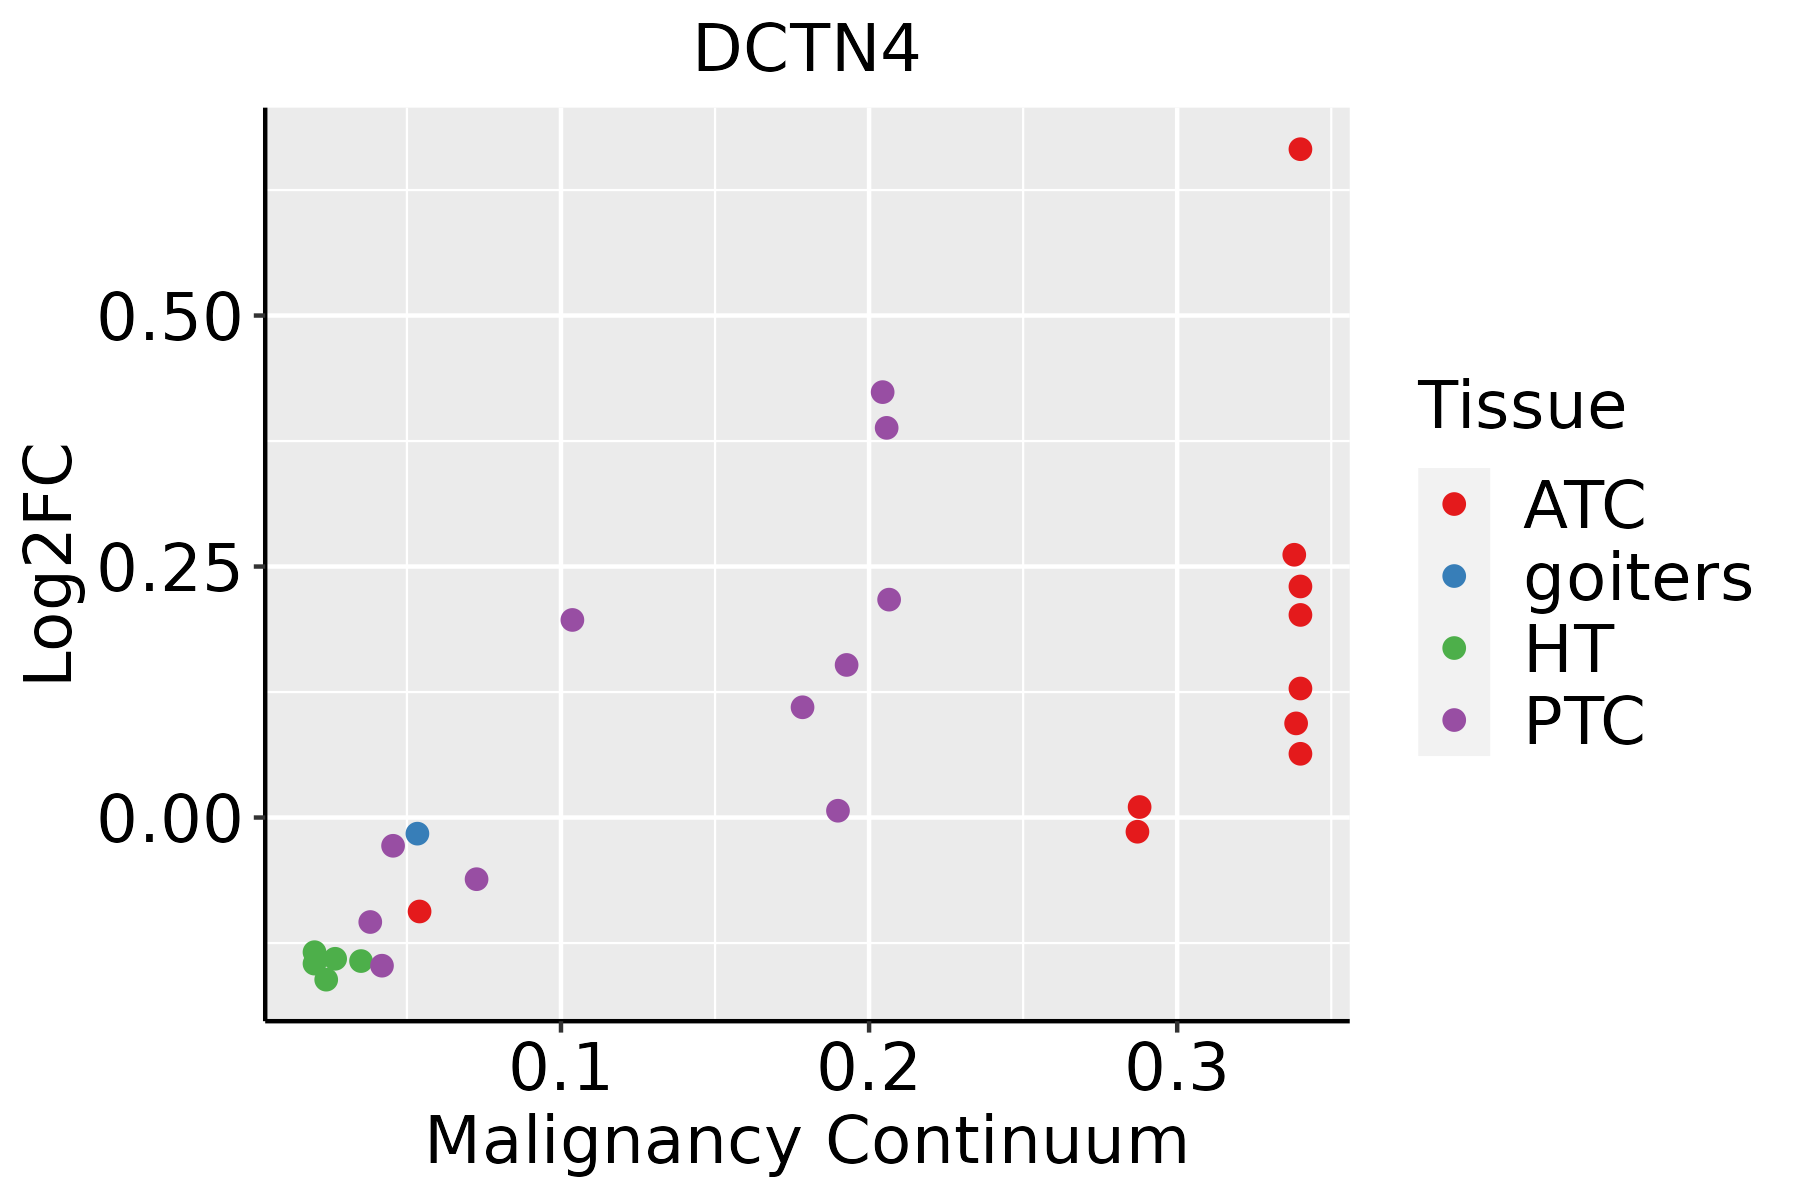 | ATC: Anaplastic thyroid cancer |
| HT: Hashimoto's thyroiditis | ||
| PTC: Papillary thyroid cancer |
| ∗log2FC in expression of this searched gene in stem-like cells from each diseased tissue sample relative to stem-like cells in normal samples in each tissue plotted against the malignancy continuum. Samples are colored based on if they are from different disease stage. |
Top |
Malignant transformation related pathway analysis |
| Find out the enriched GO biological processes and KEGG pathways involved in transition from healthy to precancer to cancer |
| Tissue | Disease Stage | Enriched GO biological Processes |
| Colorectum | AD |  |
| Colorectum | SER |  |
| Colorectum | MSS |  |
| Colorectum | MSI-H |  |
| Colorectum | FAP |  |
| ∗Top 15 enriched GO BP terms are showed in the bar plot of each disease state in each tissue. Each row represents a significant GO biological process which is colored according to the -log10(p.adjust). |
| Page: 1 2 3 4 5 6 7 8 9 |
| GO ID | Tissue | Disease Stage | Description | Gene Ratio | Bg Ratio | pvalue | p.adjust | Count |
| Page: 1 |
| Pathway ID | Tissue | Disease Stage | Description | Gene Ratio | Bg Ratio | pvalue | p.adjust | qvalue | Count |
| hsa0501630 | Esophagus | HGIN | Huntington disease | 129/1383 | 306/8465 | 6.81e-28 | 7.41e-26 | 5.88e-26 | 129 |
| hsa0501430 | Esophagus | HGIN | Amyotrophic lateral sclerosis | 140/1383 | 364/8465 | 2.13e-25 | 1.16e-23 | 9.19e-24 | 140 |
| hsa0502230 | Esophagus | HGIN | Pathways of neurodegeneration - multiple diseases | 153/1383 | 476/8465 | 1.22e-18 | 4.41e-17 | 3.50e-17 | 153 |
| hsa0513239 | Esophagus | HGIN | Salmonella infection | 69/1383 | 249/8465 | 3.02e-06 | 4.47e-05 | 3.55e-05 | 69 |
| hsa049627 | Esophagus | HGIN | Vasopressin-regulated water reabsorption | 14/1383 | 44/8465 | 8.21e-03 | 4.71e-02 | 3.74e-02 | 14 |
| hsa05016113 | Esophagus | HGIN | Huntington disease | 129/1383 | 306/8465 | 6.81e-28 | 7.41e-26 | 5.88e-26 | 129 |
| hsa05014113 | Esophagus | HGIN | Amyotrophic lateral sclerosis | 140/1383 | 364/8465 | 2.13e-25 | 1.16e-23 | 9.19e-24 | 140 |
| hsa05022113 | Esophagus | HGIN | Pathways of neurodegeneration - multiple diseases | 153/1383 | 476/8465 | 1.22e-18 | 4.41e-17 | 3.50e-17 | 153 |
| hsa05132115 | Esophagus | HGIN | Salmonella infection | 69/1383 | 249/8465 | 3.02e-06 | 4.47e-05 | 3.55e-05 | 69 |
| hsa0496214 | Esophagus | HGIN | Vasopressin-regulated water reabsorption | 14/1383 | 44/8465 | 8.21e-03 | 4.71e-02 | 3.74e-02 | 14 |
| hsa05014210 | Esophagus | ESCC | Amyotrophic lateral sclerosis | 266/4205 | 364/8465 | 1.31e-20 | 2.20e-18 | 1.13e-18 | 266 |
| hsa05132211 | Esophagus | ESCC | Salmonella infection | 191/4205 | 249/8465 | 6.51e-19 | 5.45e-17 | 2.79e-17 | 191 |
| hsa05016210 | Esophagus | ESCC | Huntington disease | 226/4205 | 306/8465 | 1.38e-18 | 8.72e-17 | 4.46e-17 | 226 |
| hsa05022210 | Esophagus | ESCC | Pathways of neurodegeneration - multiple diseases | 318/4205 | 476/8465 | 6.10e-15 | 2.04e-13 | 1.05e-13 | 318 |
| hsa0496223 | Esophagus | ESCC | Vasopressin-regulated water reabsorption | 33/4205 | 44/8465 | 5.27e-04 | 1.78e-03 | 9.13e-04 | 33 |
| hsa0501438 | Esophagus | ESCC | Amyotrophic lateral sclerosis | 266/4205 | 364/8465 | 1.31e-20 | 2.20e-18 | 1.13e-18 | 266 |
| hsa05132310 | Esophagus | ESCC | Salmonella infection | 191/4205 | 249/8465 | 6.51e-19 | 5.45e-17 | 2.79e-17 | 191 |
| hsa0501638 | Esophagus | ESCC | Huntington disease | 226/4205 | 306/8465 | 1.38e-18 | 8.72e-17 | 4.46e-17 | 226 |
| hsa0502238 | Esophagus | ESCC | Pathways of neurodegeneration - multiple diseases | 318/4205 | 476/8465 | 6.10e-15 | 2.04e-13 | 1.05e-13 | 318 |
| hsa0496233 | Esophagus | ESCC | Vasopressin-regulated water reabsorption | 33/4205 | 44/8465 | 5.27e-04 | 1.78e-03 | 9.13e-04 | 33 |
| Page: 1 2 3 |
Top |
Cell-cell communication analysis |
| Identification of potential cell-cell interactions between two cell types and their ligand-receptor pairs for different disease states |
| Ligand | Receptor | LRpair | Pathway | Tissue | Disease Stage |
| Page: 1 |
Top |
Single-cell gene regulatory network inference analysis |
| Find out the significant the regulons (TFs) and the target genes of each regulon across cell types for different disease states |
| TF | Cell Type | Tissue | Disease Stage | Target Gene | RSS | Regulon Activity |
| ∗The dot plots of a searched regulon are shown for all cell subpopulations in each disease state of each tissue based on the regulon specific score inferred using pySCENIC and by calculating the average expression. |
| Page: 1 |
Top |
Somatic mutation of malignant transformation related genes |
| Annotation of somatic variants for genes involved in malignant transformation |
| Hugo Symbol | Variant Class | Variant Classification | dbSNP RS | HGVSc | HGVSp | HGVSp Short | SWISSPROT | BIOTYPE | SIFT | PolyPhen | Tumor Sample Barcode | Tissue | Histology | Sex | Age | Stage | Therapy Types | Drugs | Outcome |
| DCTN4 | SNV | Missense_Mutation | c.665N>C | p.Lys222Thr | p.K222T | Q9UJW0 | protein_coding | tolerated(0.39) | benign(0.003) | TCGA-AO-A0JD-01 | Breast | breast invasive carcinoma | Female | <65 | III/IV | Chemotherapy | cyclophosphamide | SD | |
| DCTN4 | SNV | Missense_Mutation | c.201G>C | p.Lys67Asn | p.K67N | Q9UJW0 | protein_coding | deleterious(0) | benign(0.31) | TCGA-AR-A0TX-01 | Breast | breast invasive carcinoma | Female | <65 | I/II | Unknown | Unknown | SD | |
| DCTN4 | SNV | Missense_Mutation | c.262N>T | p.Thr88Ser | p.T88S | Q9UJW0 | protein_coding | tolerated(0.18) | possibly_damaging(0.71) | TCGA-BH-A202-01 | Breast | breast invasive carcinoma | Female | <65 | I/II | Chemotherapy | carboplatin | CR | |
| DCTN4 | SNV | Missense_Mutation | c.1189N>C | p.Asp397His | p.D397H | Q9UJW0 | protein_coding | tolerated(0.06) | possibly_damaging(0.838) | TCGA-D8-A1JA-01 | Breast | breast invasive carcinoma | Female | <65 | III/IV | Chemotherapy | adriamycin | PD | |
| DCTN4 | SNV | Missense_Mutation | novel | c.1285N>G | p.Lys429Glu | p.K429E | Q9UJW0 | protein_coding | tolerated(0.11) | benign(0.117) | TCGA-D8-A27V-01 | Breast | breast invasive carcinoma | Female | <65 | I/II | Hormone Therapy | tamoxiphen | SD |
| DCTN4 | SNV | Missense_Mutation | c.847C>T | p.Arg283Cys | p.R283C | Q9UJW0 | protein_coding | deleterious(0) | probably_damaging(0.998) | TCGA-2W-A8YY-01 | Cervix | cervical & endocervical cancer | Female | <65 | I/II | Chemotherapy | cisplatin | CR | |
| DCTN4 | SNV | Missense_Mutation | novel | c.491N>A | p.Arg164His | p.R164H | Q9UJW0 | protein_coding | tolerated(0.12) | benign(0.165) | TCGA-DS-A7WF-01 | Cervix | cervical & endocervical cancer | Female | <65 | I/II | Chemotherapy | cisplatin | PD |
| DCTN4 | SNV | Missense_Mutation | c.847N>T | p.Arg283Cys | p.R283C | Q9UJW0 | protein_coding | deleterious(0) | probably_damaging(0.998) | TCGA-AA-3811-01 | Colorectum | colon adenocarcinoma | Female | >=65 | III/IV | Unknown | Unknown | PD | |
| DCTN4 | SNV | Missense_Mutation | c.35A>T | p.Tyr12Phe | p.Y12F | Q9UJW0 | protein_coding | deleterious(0.04) | possibly_damaging(0.647) | TCGA-CK-4951-01 | Colorectum | colon adenocarcinoma | Female | >=65 | I/II | Unknown | Unknown | PD | |
| DCTN4 | SNV | Missense_Mutation | novel | c.973N>T | p.Arg325Cys | p.R325C | Q9UJW0 | protein_coding | tolerated(0.12) | possibly_damaging(0.764) | TCGA-A5-A0G2-01 | Endometrium | uterine corpus endometrioid carcinoma | Female | <65 | III/IV | Unknown | Unknown | SD |
| Page: 1 2 3 4 |
Top |
Related drugs of malignant transformation related genes |
| Identification of chemicals and drugs interact with genes involved in malignant transfromation |
| (DGIdb 4.0) |
| Entrez ID | Symbol | Category | Interaction Types | Drug Claim Name | Drug Name | PMIDs |
| Page: 1 |

Copyright 2023-Present -The University of Texas Health Science Center at Houston |