
|
|||||
|
 | |
| |
| |
| |
| |
| |
|
Gene: DCTN3 |
Gene summary for DCTN3 |
| Gene information | Species | Human | Gene symbol | DCTN3 | Gene ID | 11258 |
| Gene name | dynactin subunit 3 | |
| Gene Alias | DCTN-22 | |
| Cytomap | 9p13.3 | |
| Gene Type | protein-coding | GO ID | GO:0000278 | UniProtAcc | O75935 |
Top |
Malignant transformation analysis |
| Identification of the aberrant gene expression in precancerous and cancerous lesions by comparing the gene expression of stem-like cells in diseased tissues with normal stem cells |
| Entrez ID | Symbol | Replicates | Species | Organ | Tissue | Adj P-value | Log2FC | Malignancy |
| 11258 | DCTN3 | CA_HPV_1 | Human | Cervix | CC | 8.76e-09 | -2.65e-01 | 0.0264 |
| 11258 | DCTN3 | CA_HPV_3 | Human | Cervix | CC | 4.86e-03 | 1.48e-01 | 0.0414 |
| 11258 | DCTN3 | CCI_1 | Human | Cervix | CC | 3.78e-04 | -4.77e-01 | 0.528 |
| 11258 | DCTN3 | CCI_3 | Human | Cervix | CC | 1.37e-10 | -5.17e-01 | 0.516 |
| 11258 | DCTN3 | CCII_1 | Human | Cervix | CC | 5.99e-15 | -5.17e-01 | 0.3249 |
| 11258 | DCTN3 | H2 | Human | Cervix | HSIL_HPV | 1.07e-02 | -2.76e-01 | 0.0632 |
| 11258 | DCTN3 | HTA11_2487_2000001011 | Human | Colorectum | SER | 1.21e-03 | 2.87e-01 | -0.1808 |
| 11258 | DCTN3 | HTA11_1938_2000001011 | Human | Colorectum | AD | 8.38e-06 | 2.96e-01 | -0.0811 |
| 11258 | DCTN3 | HTA11_347_2000001011 | Human | Colorectum | AD | 3.17e-05 | 2.23e-01 | -0.1954 |
| 11258 | DCTN3 | HTA11_3361_2000001011 | Human | Colorectum | AD | 8.19e-05 | 2.97e-01 | -0.1207 |
| 11258 | DCTN3 | HTA11_83_2000001011 | Human | Colorectum | SER | 3.88e-02 | 2.46e-01 | -0.1526 |
| 11258 | DCTN3 | HTA11_696_2000001011 | Human | Colorectum | AD | 7.49e-07 | 2.31e-01 | -0.1464 |
| 11258 | DCTN3 | HTA11_866_2000001011 | Human | Colorectum | AD | 1.22e-04 | 1.15e-01 | -0.1001 |
| 11258 | DCTN3 | HTA11_1391_2000001011 | Human | Colorectum | AD | 2.82e-09 | 3.76e-01 | -0.059 |
| 11258 | DCTN3 | HTA11_546_2000001011 | Human | Colorectum | AD | 7.67e-03 | 2.63e-01 | -0.0842 |
| 11258 | DCTN3 | HTA11_866_3004761011 | Human | Colorectum | AD | 1.19e-09 | 3.17e-01 | 0.096 |
| 11258 | DCTN3 | HTA11_10711_2000001011 | Human | Colorectum | AD | 1.06e-02 | 2.27e-01 | 0.0338 |
| 11258 | DCTN3 | HTA11_7696_3000711011 | Human | Colorectum | AD | 3.03e-14 | 3.52e-01 | 0.0674 |
| 11258 | DCTN3 | HTA11_6818_2000001021 | Human | Colorectum | AD | 1.00e-03 | 2.76e-01 | 0.0588 |
| 11258 | DCTN3 | HTA11_99999970781_79442 | Human | Colorectum | MSS | 4.69e-06 | 2.10e-01 | 0.294 |
| Page: 1 2 3 4 5 6 7 8 9 |
| Tissue | Expression Dynamics | Abbreviation |
| Cervix |  | CC: Cervix cancer |
| HSIL_HPV: HPV-infected high-grade squamous intraepithelial lesions | ||
| N_HPV: HPV-infected normal cervix | ||
| Colorectum (GSE201348) |  | FAP: Familial adenomatous polyposis |
| CRC: Colorectal cancer | ||
| Colorectum (HTA11) |  | AD: Adenomas |
| SER: Sessile serrated lesions | ||
| MSI-H: Microsatellite-high colorectal cancer | ||
| MSS: Microsatellite stable colorectal cancer | ||
| Endometrium | 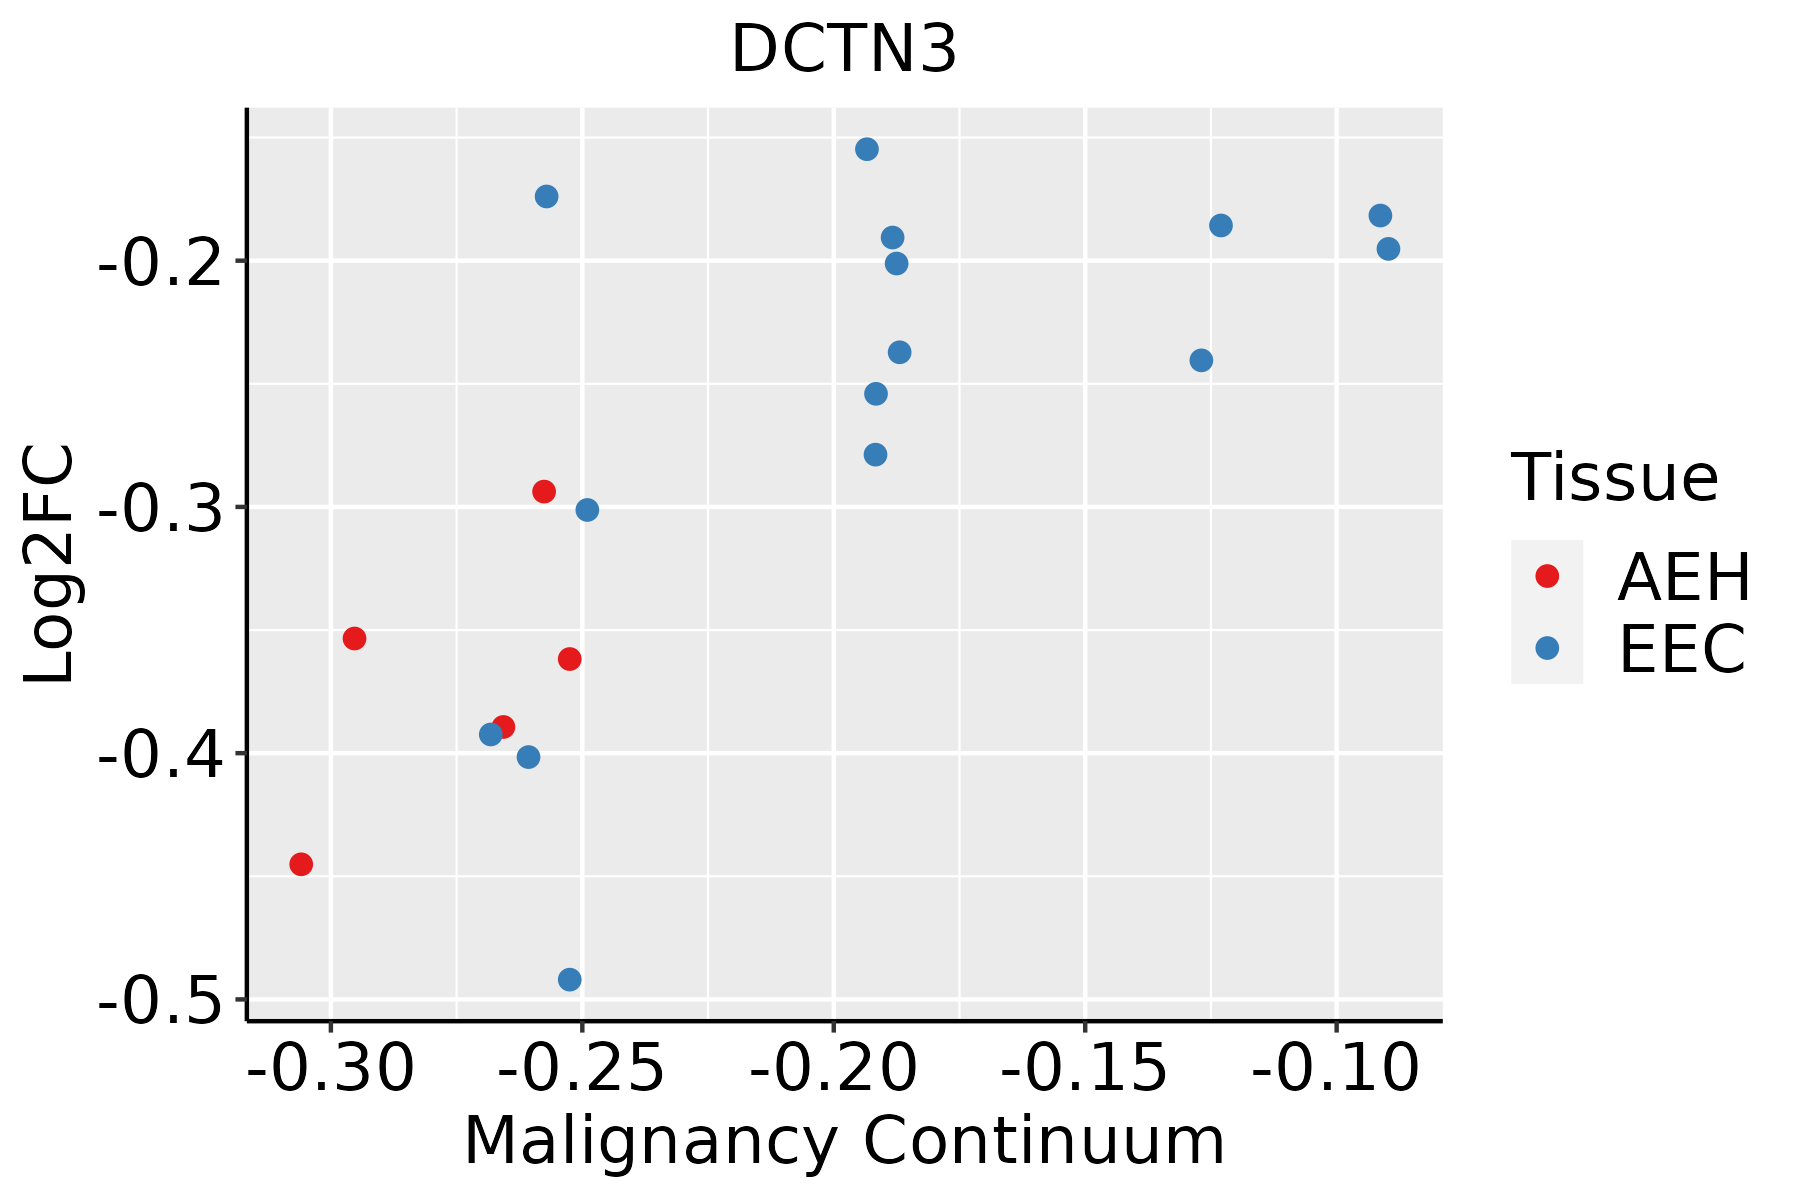 | AEH: Atypical endometrial hyperplasia |
| EEC: Endometrioid Cancer | ||
| Esophagus |  | ESCC: Esophageal squamous cell carcinoma |
| HGIN: High-grade intraepithelial neoplasias | ||
| LGIN: Low-grade intraepithelial neoplasias | ||
| Liver | 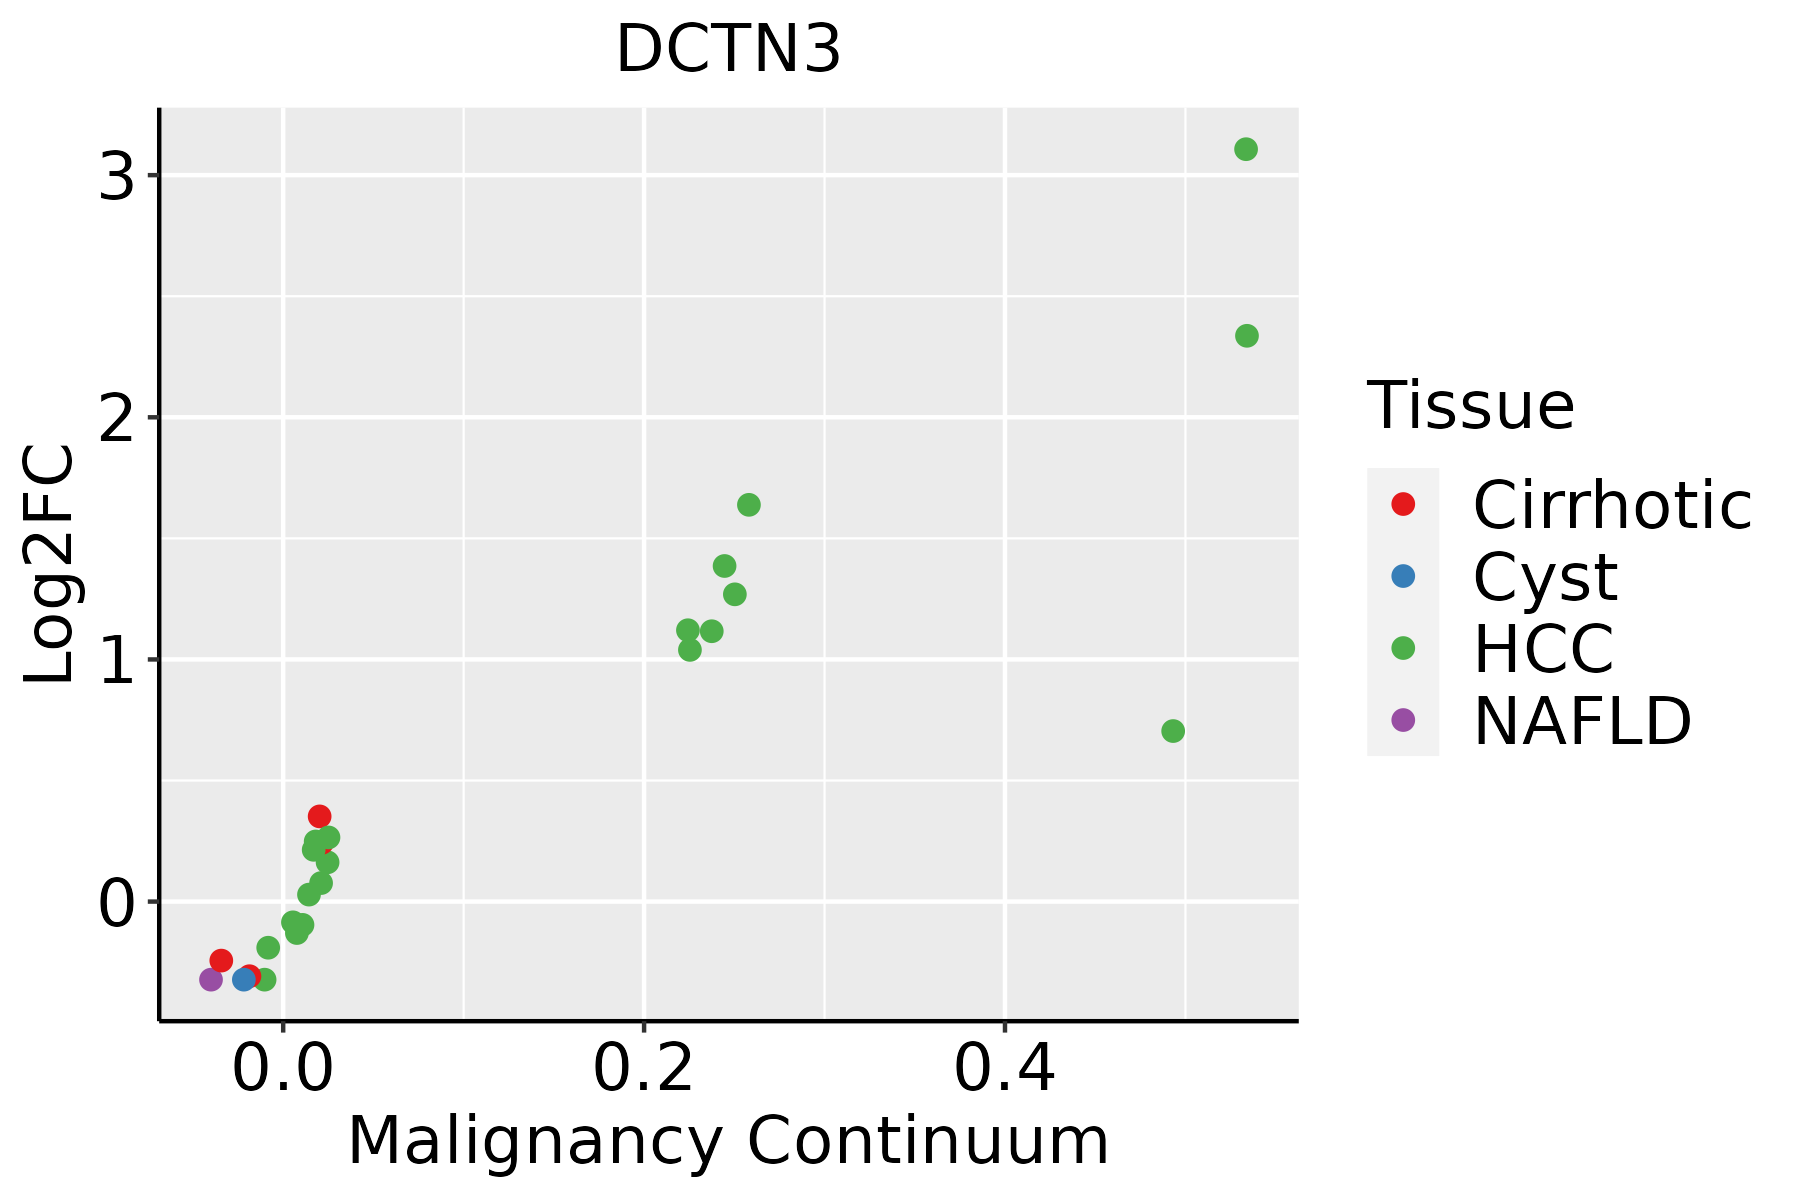 | HCC: Hepatocellular carcinoma |
| NAFLD: Non-alcoholic fatty liver disease | ||
| Oral Cavity | 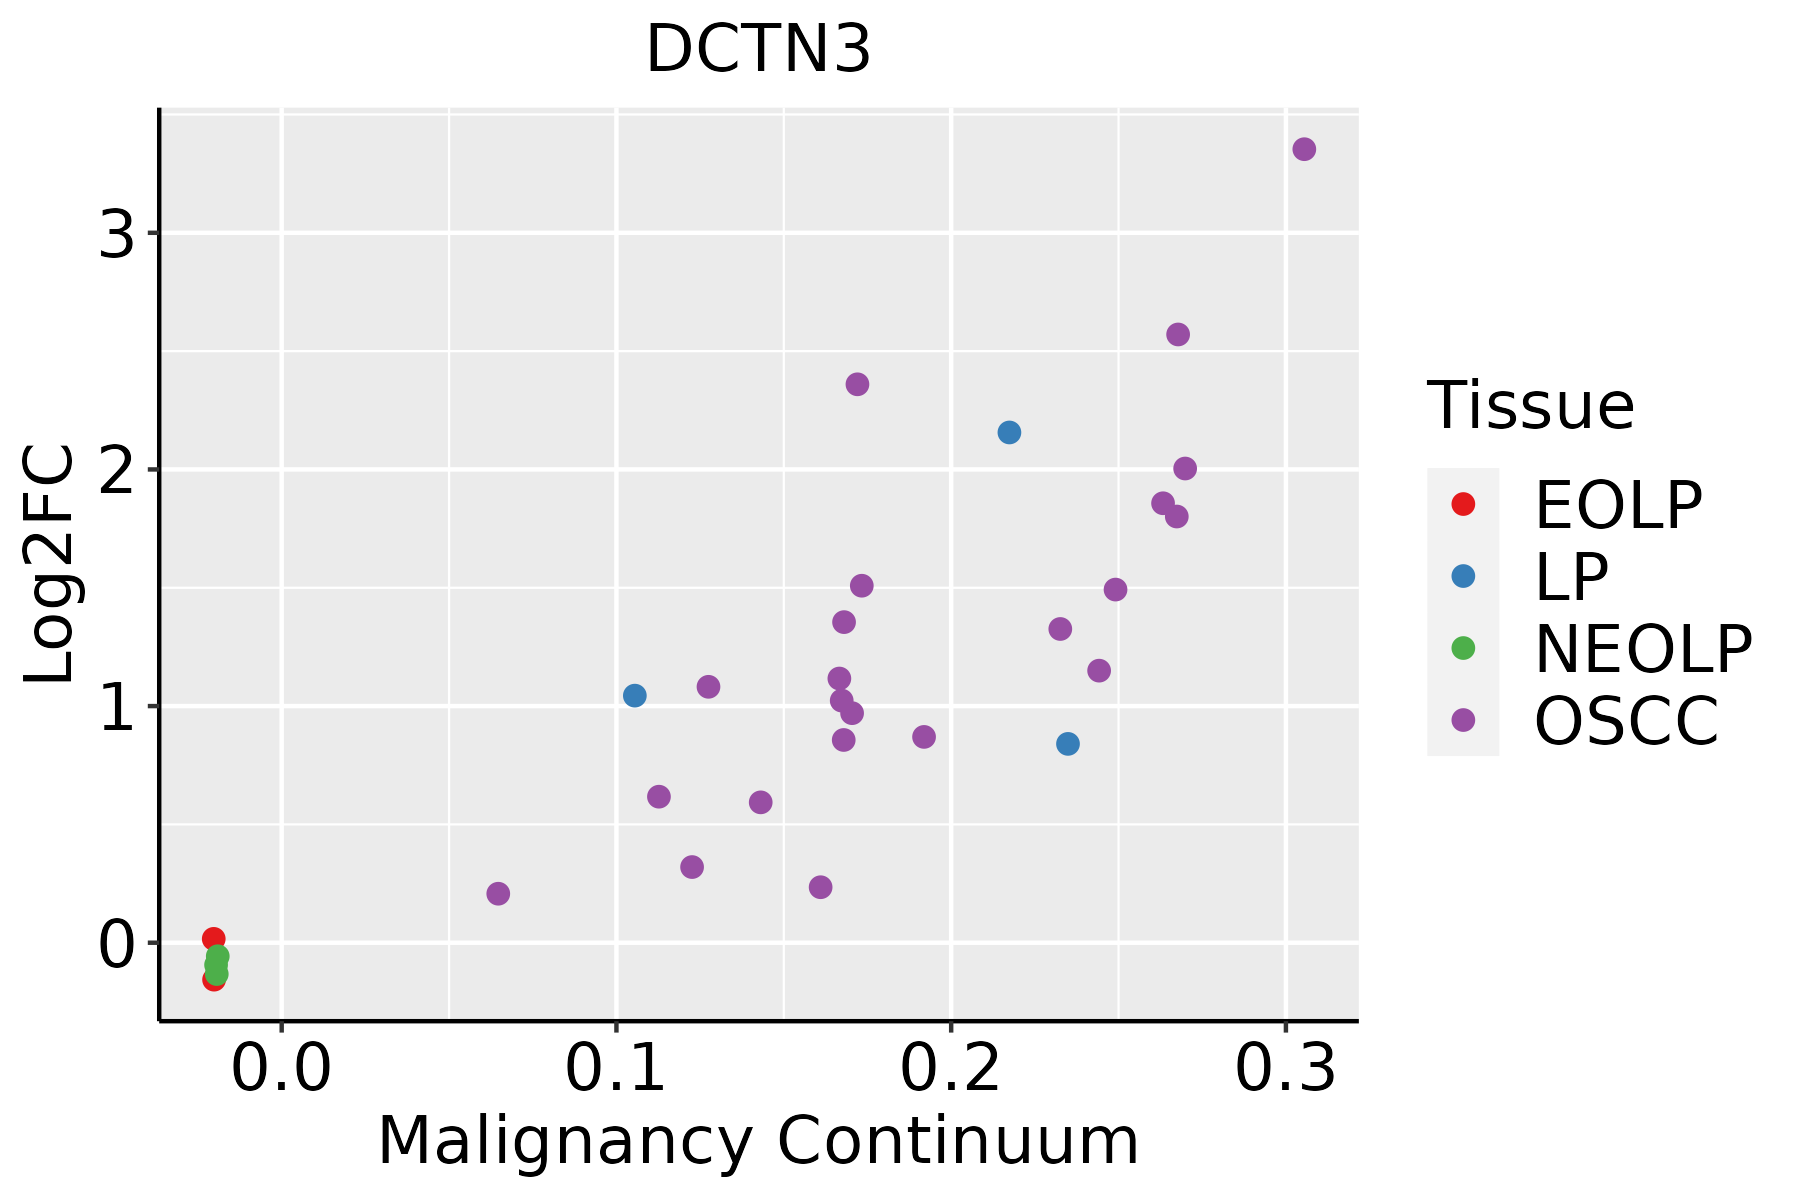 | EOLP: Erosive Oral lichen planus |
| LP: leukoplakia | ||
| NEOLP: Non-erosive oral lichen planus | ||
| OSCC: Oral squamous cell carcinoma | ||
| Prostate |  | BPH: Benign Prostatic Hyperplasia |
| Skin | 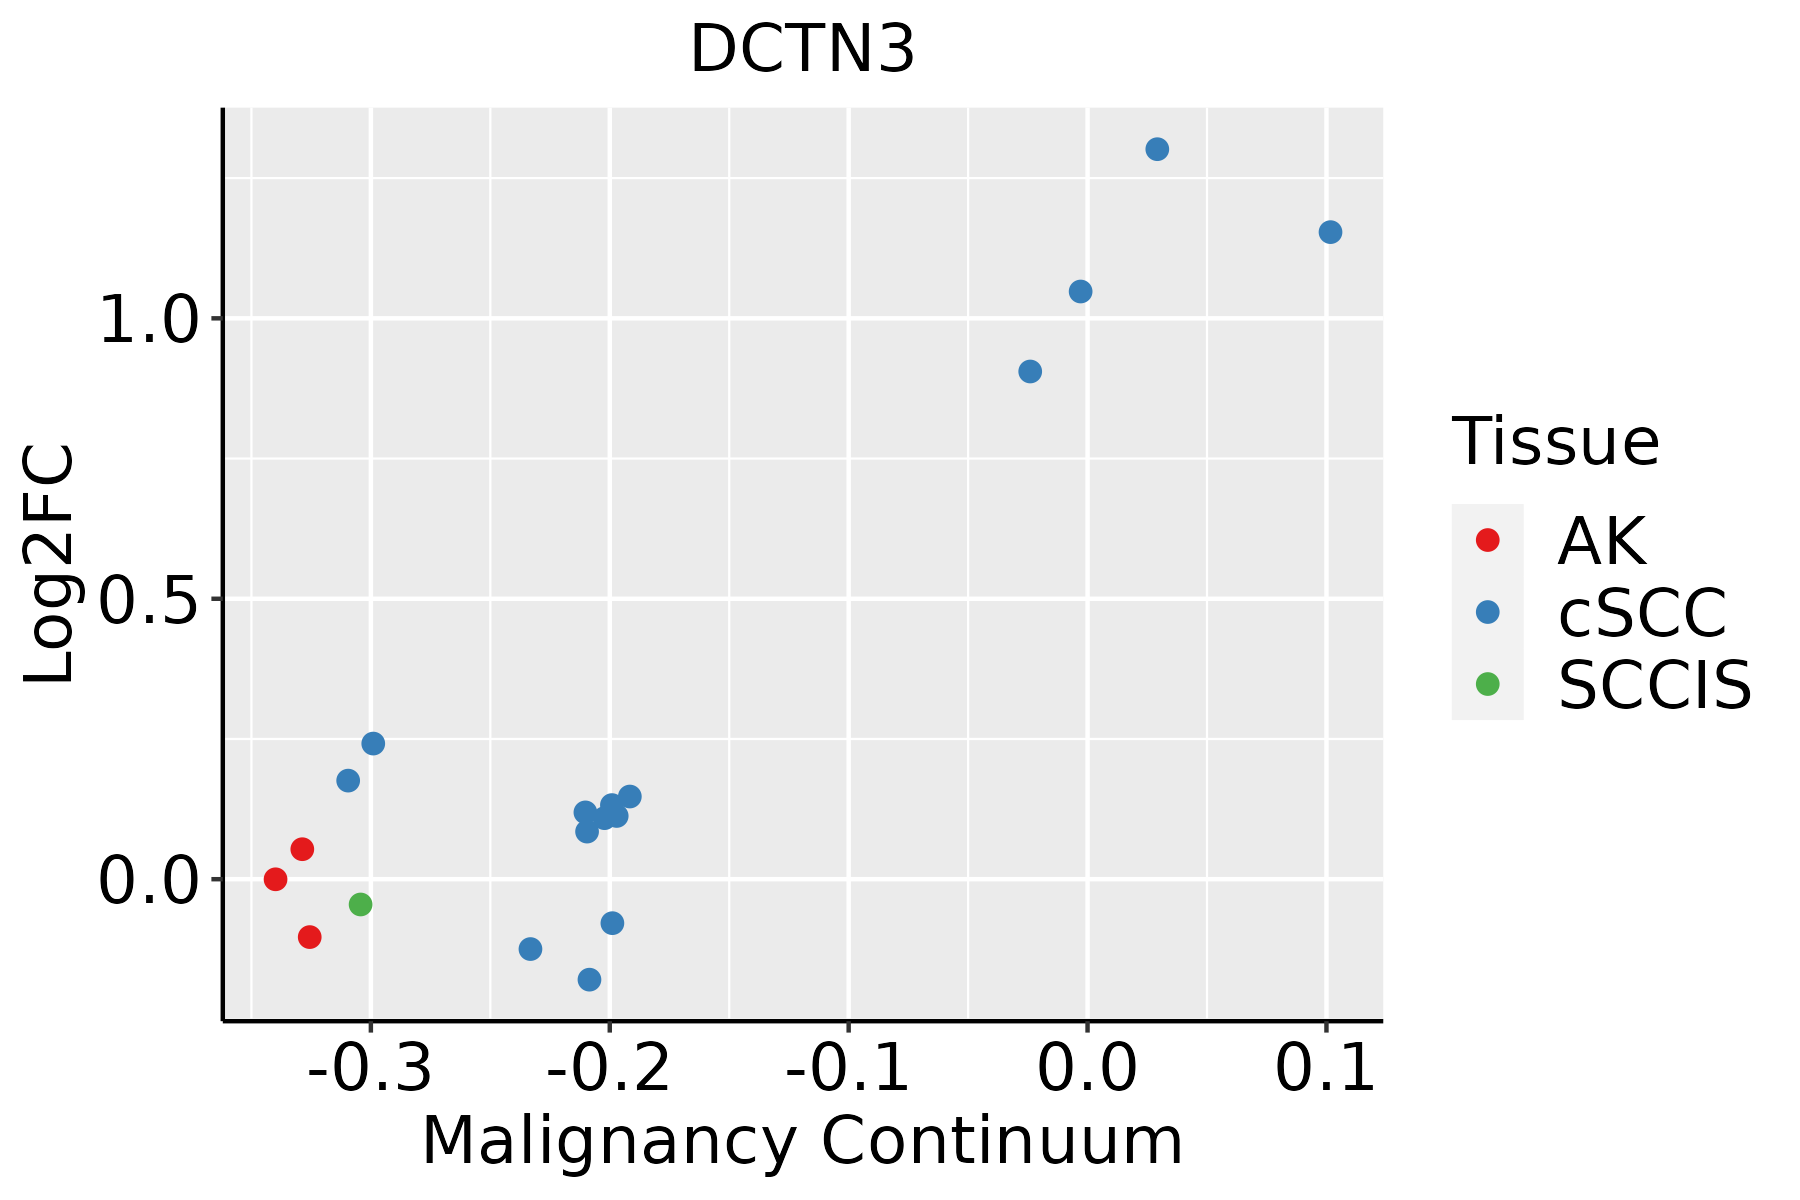 | AK: Actinic keratosis |
| cSCC: Cutaneous squamous cell carcinoma | ||
| SCCIS:squamous cell carcinoma in situ | ||
| Thyroid | 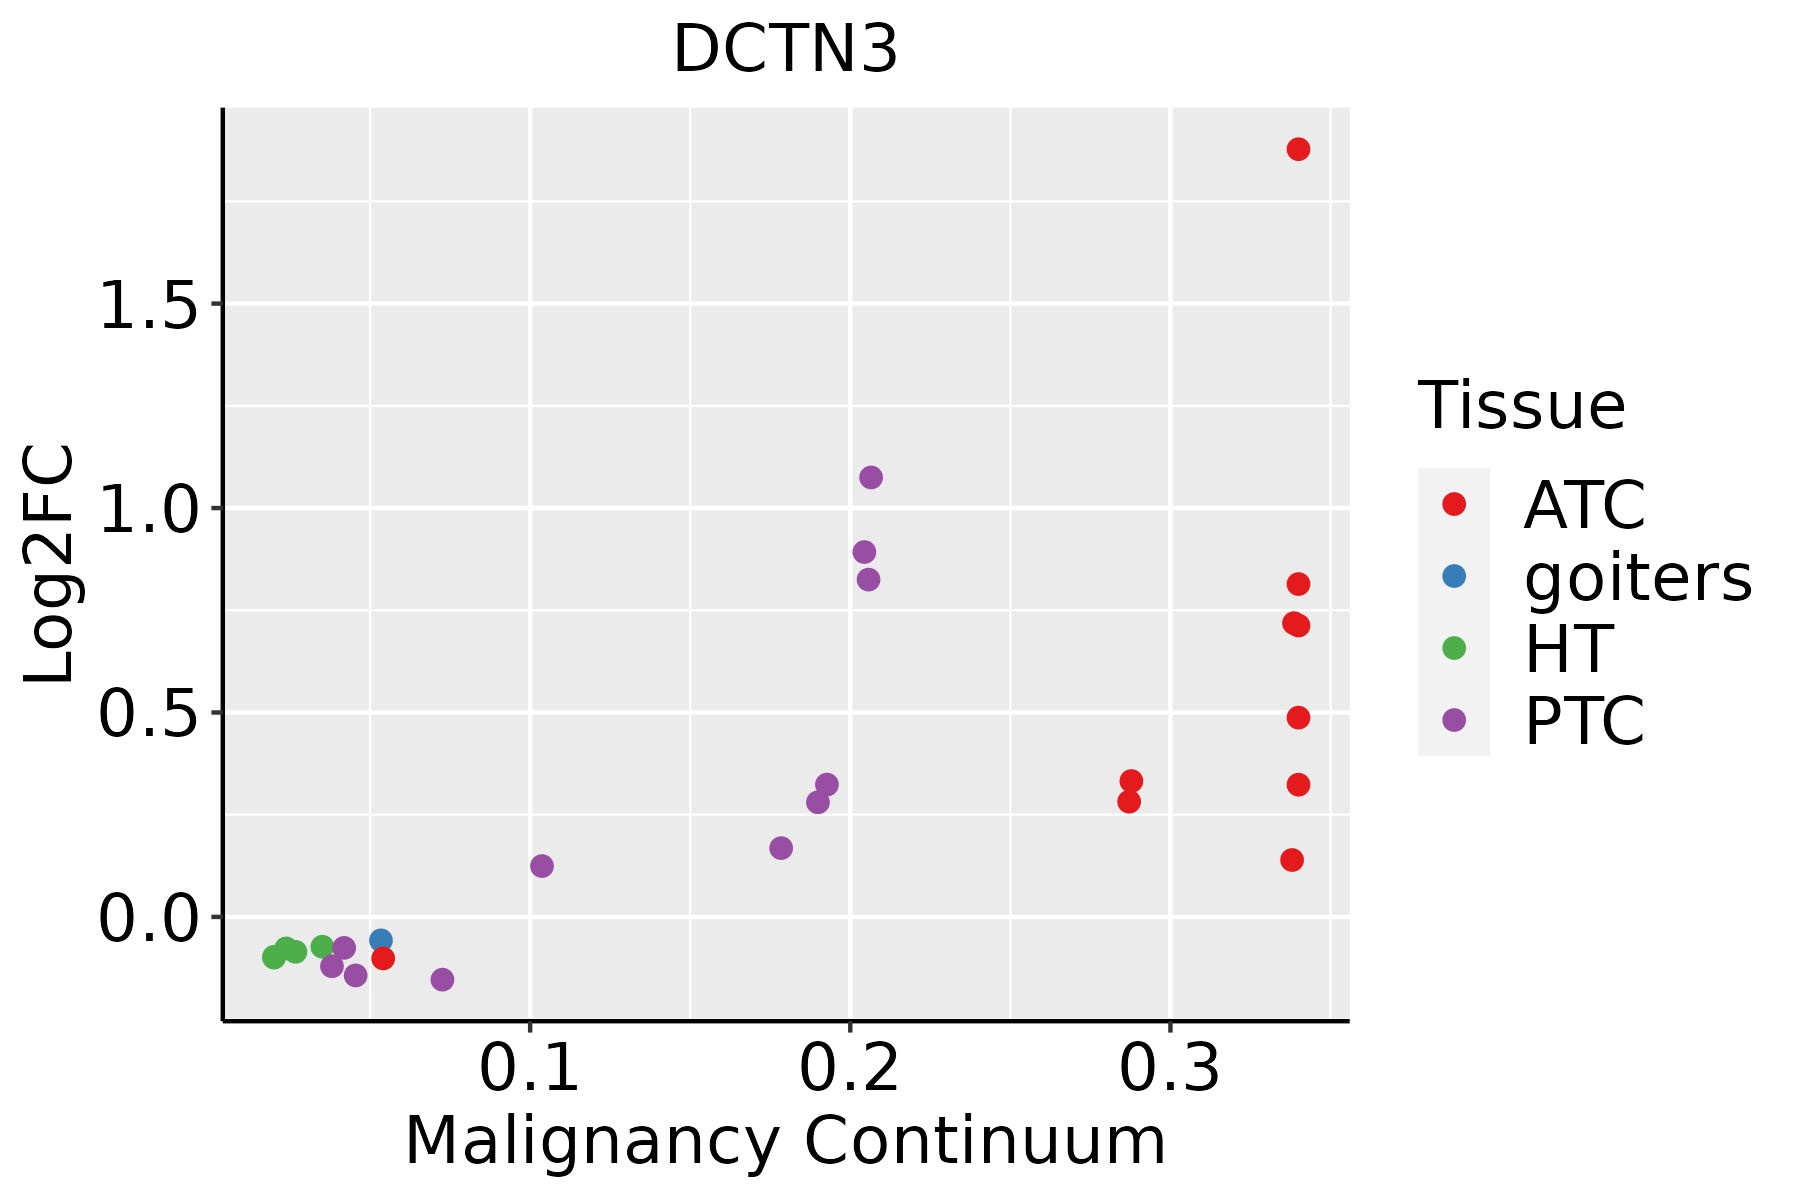 | ATC: Anaplastic thyroid cancer |
| HT: Hashimoto's thyroiditis | ||
| PTC: Papillary thyroid cancer |
| ∗log2FC in expression of this searched gene in stem-like cells from each diseased tissue sample relative to stem-like cells in normal samples in each tissue plotted against the malignancy continuum. Samples are colored based on if they are from different disease stage. |
Top |
Malignant transformation related pathway analysis |
| Find out the enriched GO biological processes and KEGG pathways involved in transition from healthy to precancer to cancer |
| Tissue | Disease Stage | Enriched GO biological Processes |
| Colorectum | AD |  |
| Colorectum | SER |  |
| Colorectum | MSS |  |
| Colorectum | MSI-H |  |
| Colorectum | FAP |  |
| ∗Top 15 enriched GO BP terms are showed in the bar plot of each disease state in each tissue. Each row represents a significant GO biological process which is colored according to the -log10(p.adjust). |
| Page: 1 2 3 4 5 6 7 8 9 |
| GO ID | Tissue | Disease Stage | Description | Gene Ratio | Bg Ratio | pvalue | p.adjust | Count |
| GO:00009107 | Cervix | CC | cytokinesis | 37/2311 | 173/18723 | 5.40e-04 | 5.23e-03 | 37 |
| GO:0000910 | Colorectum | AD | cytokinesis | 59/3918 | 173/18723 | 3.74e-05 | 6.75e-04 | 59 |
| GO:0061640 | Colorectum | AD | cytoskeleton-dependent cytokinesis | 37/3918 | 100/18723 | 1.58e-04 | 2.20e-03 | 37 |
| GO:00009101 | Colorectum | SER | cytokinesis | 45/2897 | 173/18723 | 2.28e-04 | 3.93e-03 | 45 |
| GO:00616401 | Colorectum | SER | cytoskeleton-dependent cytokinesis | 29/2897 | 100/18723 | 4.25e-04 | 6.25e-03 | 29 |
| GO:00009102 | Colorectum | MSS | cytokinesis | 49/3467 | 173/18723 | 1.02e-03 | 1.02e-02 | 49 |
| GO:00009108 | Endometrium | AEH | cytokinesis | 40/2100 | 173/18723 | 6.01e-06 | 1.49e-04 | 40 |
| GO:00616403 | Endometrium | AEH | cytoskeleton-dependent cytokinesis | 24/2100 | 100/18723 | 2.27e-04 | 2.75e-03 | 24 |
| GO:000091013 | Endometrium | EEC | cytokinesis | 40/2168 | 173/18723 | 1.29e-05 | 2.60e-04 | 40 |
| GO:006164012 | Endometrium | EEC | cytoskeleton-dependent cytokinesis | 24/2168 | 100/18723 | 3.66e-04 | 3.95e-03 | 24 |
| GO:000091015 | Esophagus | HGIN | cytokinesis | 44/2587 | 173/18723 | 3.26e-05 | 8.32e-04 | 44 |
| GO:00616406 | Esophagus | HGIN | cytoskeleton-dependent cytokinesis | 27/2587 | 100/18723 | 3.71e-04 | 5.77e-03 | 27 |
| GO:000091016 | Esophagus | ESCC | cytokinesis | 115/8552 | 173/18723 | 2.48e-08 | 4.68e-07 | 115 |
| GO:006164015 | Esophagus | ESCC | cytoskeleton-dependent cytokinesis | 72/8552 | 100/18723 | 8.10e-08 | 1.39e-06 | 72 |
| GO:00009105 | Liver | Cirrhotic | cytokinesis | 62/4634 | 173/18723 | 7.13e-04 | 5.33e-03 | 62 |
| GO:00616402 | Liver | Cirrhotic | cytoskeleton-dependent cytokinesis | 38/4634 | 100/18723 | 2.22e-03 | 1.35e-02 | 38 |
| GO:000091011 | Liver | HCC | cytokinesis | 100/7958 | 173/18723 | 3.38e-05 | 3.39e-04 | 100 |
| GO:006164011 | Liver | HCC | cytoskeleton-dependent cytokinesis | 60/7958 | 100/18723 | 3.09e-04 | 2.20e-03 | 60 |
| GO:000091010 | Oral cavity | OSCC | cytokinesis | 97/7305 | 173/18723 | 3.82e-06 | 4.51e-05 | 97 |
| GO:00616405 | Oral cavity | OSCC | cytoskeleton-dependent cytokinesis | 60/7305 | 100/18723 | 1.69e-05 | 1.67e-04 | 60 |
| Page: 1 2 |
| Pathway ID | Tissue | Disease Stage | Description | Gene Ratio | Bg Ratio | pvalue | p.adjust | qvalue | Count |
| hsa0501618 | Cervix | CC | Huntington disease | 94/1267 | 306/8465 | 8.49e-13 | 3.06e-11 | 1.81e-11 | 94 |
| hsa0502218 | Cervix | CC | Pathways of neurodegeneration - multiple diseases | 128/1267 | 476/8465 | 2.87e-12 | 9.29e-11 | 5.50e-11 | 128 |
| hsa0501418 | Cervix | CC | Amyotrophic lateral sclerosis | 103/1267 | 364/8465 | 1.79e-11 | 4.47e-10 | 2.64e-10 | 103 |
| hsa0513220 | Cervix | CC | Salmonella infection | 74/1267 | 249/8465 | 1.33e-09 | 2.54e-08 | 1.50e-08 | 74 |
| hsa0501619 | Cervix | CC | Huntington disease | 94/1267 | 306/8465 | 8.49e-13 | 3.06e-11 | 1.81e-11 | 94 |
| hsa0502219 | Cervix | CC | Pathways of neurodegeneration - multiple diseases | 128/1267 | 476/8465 | 2.87e-12 | 9.29e-11 | 5.50e-11 | 128 |
| hsa0501419 | Cervix | CC | Amyotrophic lateral sclerosis | 103/1267 | 364/8465 | 1.79e-11 | 4.47e-10 | 2.64e-10 | 103 |
| hsa05132110 | Cervix | CC | Salmonella infection | 74/1267 | 249/8465 | 1.33e-09 | 2.54e-08 | 1.50e-08 | 74 |
| hsa0513225 | Cervix | HSIL_HPV | Salmonella infection | 34/459 | 249/8465 | 5.03e-07 | 1.13e-05 | 9.17e-06 | 34 |
| hsa0501624 | Cervix | HSIL_HPV | Huntington disease | 38/459 | 306/8465 | 1.21e-06 | 2.54e-05 | 2.05e-05 | 38 |
| hsa0502224 | Cervix | HSIL_HPV | Pathways of neurodegeneration - multiple diseases | 46/459 | 476/8465 | 8.10e-05 | 1.08e-03 | 8.72e-04 | 46 |
| hsa0501424 | Cervix | HSIL_HPV | Amyotrophic lateral sclerosis | 35/459 | 364/8465 | 6.43e-04 | 5.23e-03 | 4.23e-03 | 35 |
| hsa0513235 | Cervix | HSIL_HPV | Salmonella infection | 34/459 | 249/8465 | 5.03e-07 | 1.13e-05 | 9.17e-06 | 34 |
| hsa0501634 | Cervix | HSIL_HPV | Huntington disease | 38/459 | 306/8465 | 1.21e-06 | 2.54e-05 | 2.05e-05 | 38 |
| hsa0502234 | Cervix | HSIL_HPV | Pathways of neurodegeneration - multiple diseases | 46/459 | 476/8465 | 8.10e-05 | 1.08e-03 | 8.72e-04 | 46 |
| hsa0501434 | Cervix | HSIL_HPV | Amyotrophic lateral sclerosis | 35/459 | 364/8465 | 6.43e-04 | 5.23e-03 | 4.23e-03 | 35 |
| hsa05016 | Colorectum | AD | Huntington disease | 147/2092 | 306/8465 | 1.93e-19 | 9.26e-18 | 5.91e-18 | 147 |
| hsa05014 | Colorectum | AD | Amyotrophic lateral sclerosis | 164/2092 | 364/8465 | 4.28e-18 | 1.27e-16 | 8.09e-17 | 164 |
| hsa05022 | Colorectum | AD | Pathways of neurodegeneration - multiple diseases | 201/2092 | 476/8465 | 4.54e-18 | 1.27e-16 | 8.09e-17 | 201 |
| hsa05132 | Colorectum | AD | Salmonella infection | 102/2092 | 249/8465 | 7.65e-09 | 1.28e-07 | 8.17e-08 | 102 |
| Page: 1 2 3 4 5 6 7 |
Top |
Cell-cell communication analysis |
| Identification of potential cell-cell interactions between two cell types and their ligand-receptor pairs for different disease states |
| Ligand | Receptor | LRpair | Pathway | Tissue | Disease Stage |
| Page: 1 |
Top |
Single-cell gene regulatory network inference analysis |
| Find out the significant the regulons (TFs) and the target genes of each regulon across cell types for different disease states |
| TF | Cell Type | Tissue | Disease Stage | Target Gene | RSS | Regulon Activity |
| ∗The dot plots of a searched regulon are shown for all cell subpopulations in each disease state of each tissue based on the regulon specific score inferred using pySCENIC and by calculating the average expression. |
| Page: 1 |
Top |
Somatic mutation of malignant transformation related genes |
| Annotation of somatic variants for genes involved in malignant transformation |
| Hugo Symbol | Variant Class | Variant Classification | dbSNP RS | HGVSc | HGVSp | HGVSp Short | SWISSPROT | BIOTYPE | SIFT | PolyPhen | Tumor Sample Barcode | Tissue | Histology | Sex | Age | Stage | Therapy Types | Drugs | Outcome |
| DCTN3 | SNV | Missense_Mutation | c.169N>A | p.Leu57Ile | p.L57I | O75935 | protein_coding | deleterious(0.03) | probably_damaging(0.913) | TCGA-CA-6718-01 | Colorectum | colon adenocarcinoma | Male | <65 | I/II | Unknown | Unknown | PD | |
| DCTN3 | SNV | Missense_Mutation | c.164A>G | p.Lys55Arg | p.K55R | O75935 | protein_coding | deleterious(0.02) | probably_damaging(0.966) | TCGA-CK-6746-01 | Colorectum | colon adenocarcinoma | Female | >=65 | I/II | Unknown | Unknown | SD | |
| DCTN3 | SNV | Missense_Mutation | c.397N>A | p.His133Asn | p.H133N | O75935 | protein_coding | tolerated(0.09) | possibly_damaging(0.843) | TCGA-DM-A1HB-01 | Colorectum | colon adenocarcinoma | Male | >=65 | III/IV | Unknown | Unknown | SD | |
| DCTN3 | SNV | Missense_Mutation | novel | c.146N>A | p.Ser49Asn | p.S49N | O75935 | protein_coding | tolerated(0.68) | benign(0.007) | TCGA-A5-A2K3-01 | Endometrium | uterine corpus endometrioid carcinoma | Female | >=65 | I/II | Chemotherapy | carboplatin | SD |
| DCTN3 | SNV | Missense_Mutation | novel | c.32N>C | p.Gln11Pro | p.Q11P | O75935 | protein_coding | deleterious(0.01) | possibly_damaging(0.648) | TCGA-B5-A1MW-01 | Endometrium | uterine corpus endometrioid carcinoma | Female | <65 | I/II | Unknown | Unknown | PD |
| DCTN3 | SNV | Missense_Mutation | novel | c.143C>T | p.Ser48Phe | p.S48F | O75935 | protein_coding | deleterious(0.02) | benign(0.432) | TCGA-D1-A103-01 | Endometrium | uterine corpus endometrioid carcinoma | Female | >=65 | I/II | Unknown | Unknown | SD |
| DCTN3 | SNV | Missense_Mutation | novel | c.377N>G | p.Leu126Arg | p.L126R | O75935 | protein_coding | deleterious(0) | probably_damaging(0.996) | TCGA-EO-A22S-01 | Endometrium | uterine corpus endometrioid carcinoma | Female | <65 | I/II | Unknown | Unknown | SD |
| DCTN3 | SNV | Missense_Mutation | novel | c.494T>C | p.Phe165Ser | p.F165S | O75935 | protein_coding | deleterious(0) | possibly_damaging(0.88) | TCGA-EO-A22X-01 | Endometrium | uterine corpus endometrioid carcinoma | Female | <65 | III/IV | Unspecific | Carboplatin | Complete Response |
| DCTN3 | SNV | Missense_Mutation | novel | c.220N>A | p.Asp74Asn | p.D74N | O75935 | protein_coding | deleterious(0) | possibly_damaging(0.789) | TCGA-EO-A3AY-01 | Endometrium | uterine corpus endometrioid carcinoma | Female | <65 | I/II | Unknown | Unknown | PD |
| DCTN3 | SNV | Missense_Mutation | novel | c.220G>A | p.Asp74Asn | p.D74N | O75935 | protein_coding | deleterious(0) | possibly_damaging(0.789) | TCGA-EO-A3AZ-01 | Endometrium | uterine corpus endometrioid carcinoma | Female | >=65 | I/II | Unknown | Unknown | SD |
| Page: 1 2 |
Top |
Related drugs of malignant transformation related genes |
| Identification of chemicals and drugs interact with genes involved in malignant transfromation |
| (DGIdb 4.0) |
| Entrez ID | Symbol | Category | Interaction Types | Drug Claim Name | Drug Name | PMIDs |
| Page: 1 |

Copyright 2023-Present -The University of Texas Health Science Center at Houston |