
|
|||||
|
 | |
| |
| |
| |
| |
| |
|
Gene: DCTD |
Gene summary for DCTD |
| Gene information | Species | Human | Gene symbol | DCTD | Gene ID | 1635 |
| Gene name | dCMP deaminase | |
| Gene Alias | DCTD | |
| Cytomap | 4q35.1 | |
| Gene Type | protein-coding | GO ID | GO:0006139 | UniProtAcc | P32321 |
Top |
Malignant transformation analysis |
| Identification of the aberrant gene expression in precancerous and cancerous lesions by comparing the gene expression of stem-like cells in diseased tissues with normal stem cells |
| Entrez ID | Symbol | Replicates | Species | Organ | Tissue | Adj P-value | Log2FC | Malignancy |
| 1635 | DCTD | HTA11_1938_2000001011 | Human | Colorectum | AD | 7.95e-03 | 4.31e-01 | -0.0811 |
| 1635 | DCTD | HTA11_347_2000001011 | Human | Colorectum | AD | 3.03e-08 | 4.39e-01 | -0.1954 |
| 1635 | DCTD | HTA11_1391_2000001011 | Human | Colorectum | AD | 1.01e-07 | 5.48e-01 | -0.059 |
| 1635 | DCTD | HTA11_866_3004761011 | Human | Colorectum | AD | 5.98e-05 | 4.00e-01 | 0.096 |
| 1635 | DCTD | HTA11_6801_2000001011 | Human | Colorectum | SER | 1.61e-02 | 7.09e-01 | 0.0171 |
| 1635 | DCTD | HTA11_7696_3000711011 | Human | Colorectum | AD | 2.30e-11 | 4.39e-01 | 0.0674 |
| 1635 | DCTD | HTA11_99999970781_79442 | Human | Colorectum | MSS | 1.57e-15 | 6.61e-01 | 0.294 |
| 1635 | DCTD | HTA11_99999965062_69753 | Human | Colorectum | MSI-H | 4.48e-03 | 9.62e-01 | 0.3487 |
| 1635 | DCTD | HTA11_99999965104_69814 | Human | Colorectum | MSS | 5.20e-05 | 4.88e-01 | 0.281 |
| 1635 | DCTD | HTA11_99999971662_82457 | Human | Colorectum | MSS | 3.05e-29 | 9.42e-01 | 0.3859 |
| 1635 | DCTD | HTA11_99999974143_84620 | Human | Colorectum | MSS | 5.49e-07 | 4.12e-01 | 0.3005 |
| 1635 | DCTD | A015-C-203 | Human | Colorectum | FAP | 2.79e-02 | -1.15e-01 | -0.1294 |
| 1635 | DCTD | A002-C-205 | Human | Colorectum | FAP | 3.52e-06 | -1.76e-01 | -0.1236 |
| 1635 | DCTD | A002-C-114 | Human | Colorectum | FAP | 4.50e-02 | -1.41e-01 | -0.1561 |
| 1635 | DCTD | A015-C-104 | Human | Colorectum | FAP | 3.22e-02 | -1.02e-01 | -0.1899 |
| 1635 | DCTD | A002-C-016 | Human | Colorectum | FAP | 2.76e-02 | -1.47e-01 | 0.0521 |
| 1635 | DCTD | A002-C-116 | Human | Colorectum | FAP | 4.25e-05 | -1.43e-01 | -0.0452 |
| 1635 | DCTD | LZE4T | Human | Esophagus | ESCC | 1.10e-11 | 3.38e-01 | 0.0811 |
| 1635 | DCTD | LZE8T | Human | Esophagus | ESCC | 9.52e-08 | 1.08e-01 | 0.067 |
| 1635 | DCTD | LZE20T | Human | Esophagus | ESCC | 8.92e-07 | 1.15e-01 | 0.0662 |
| Page: 1 2 3 4 5 6 7 |
| Tissue | Expression Dynamics | Abbreviation |
| Colorectum (GSE201348) |  | FAP: Familial adenomatous polyposis |
| CRC: Colorectal cancer | ||
| Colorectum (HTA11) |  | AD: Adenomas |
| SER: Sessile serrated lesions | ||
| MSI-H: Microsatellite-high colorectal cancer | ||
| MSS: Microsatellite stable colorectal cancer | ||
| Esophagus | 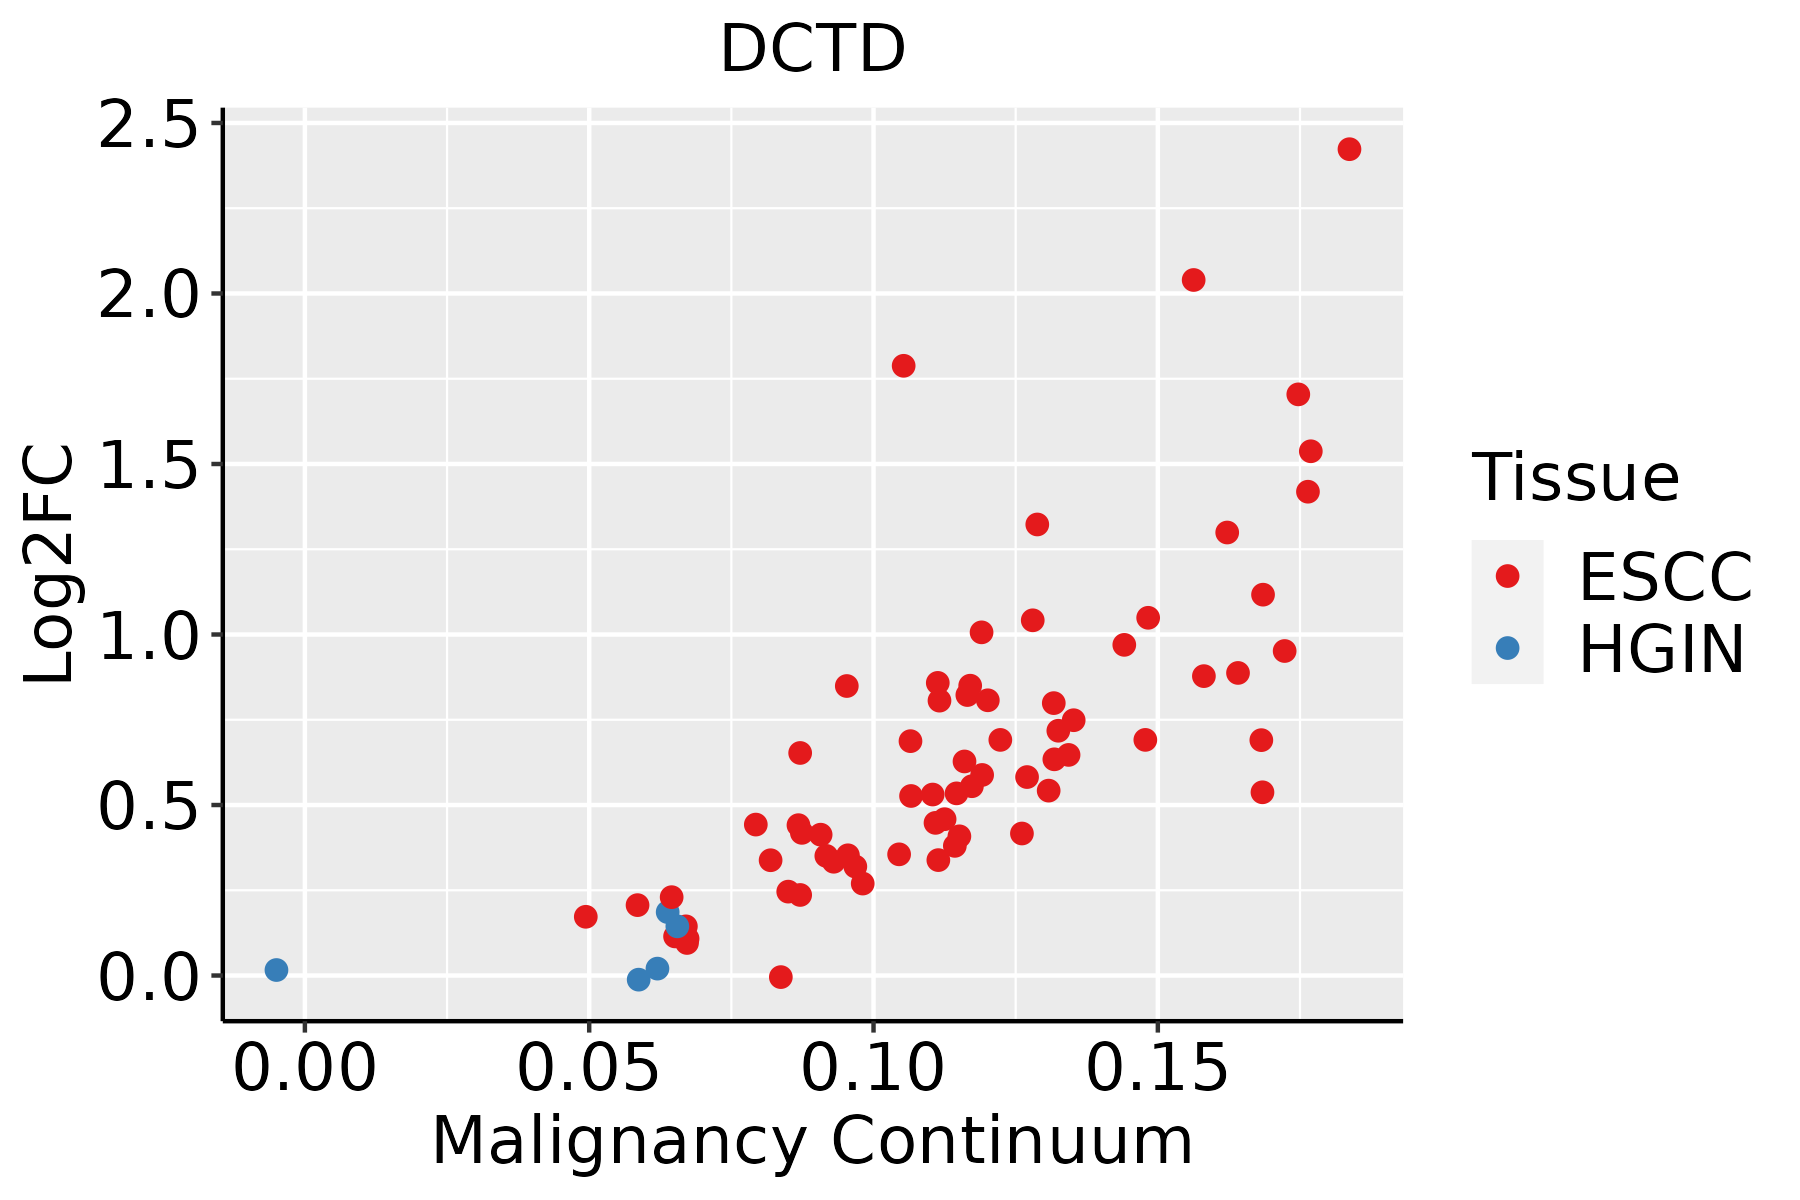 | ESCC: Esophageal squamous cell carcinoma |
| HGIN: High-grade intraepithelial neoplasias | ||
| LGIN: Low-grade intraepithelial neoplasias | ||
| Liver | 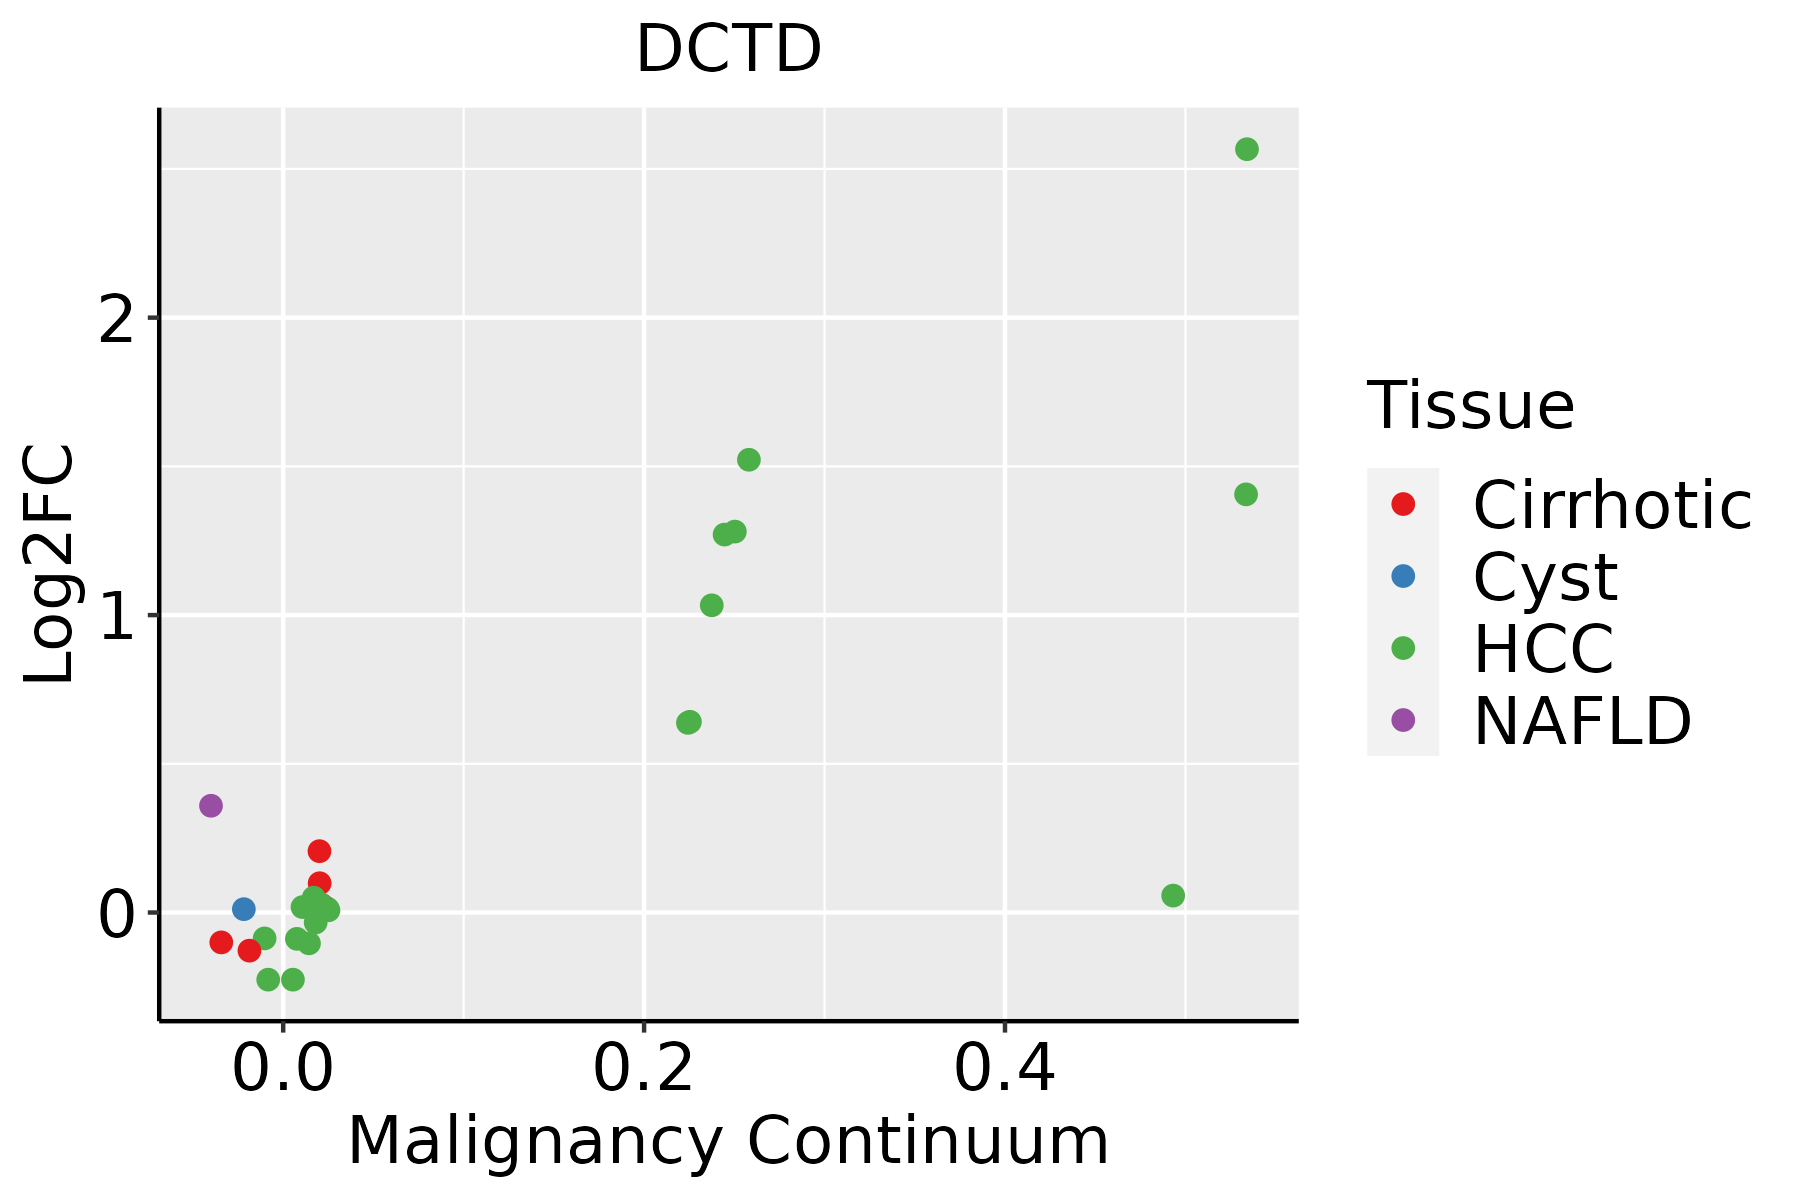 | HCC: Hepatocellular carcinoma |
| NAFLD: Non-alcoholic fatty liver disease | ||
| Oral Cavity | 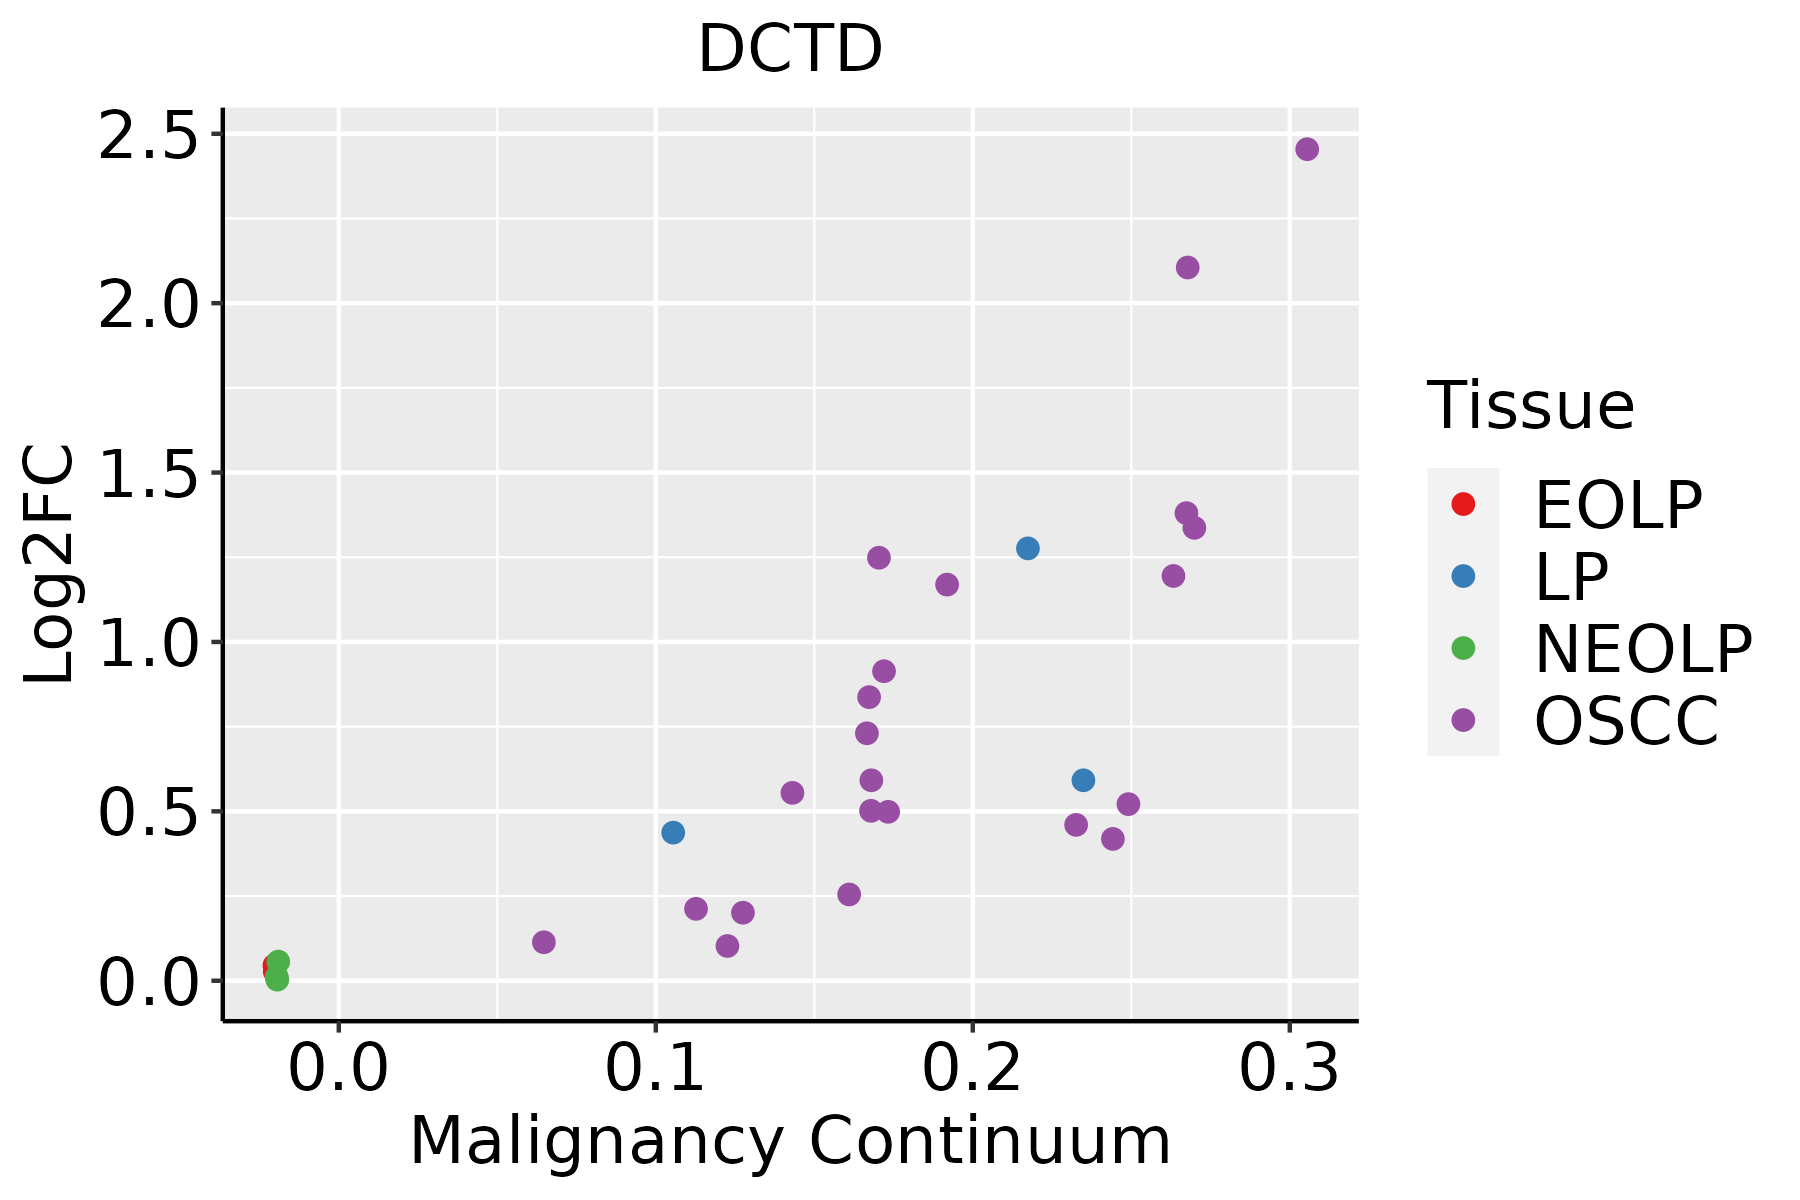 | EOLP: Erosive Oral lichen planus |
| LP: leukoplakia | ||
| NEOLP: Non-erosive oral lichen planus | ||
| OSCC: Oral squamous cell carcinoma | ||
| Skin |  | AK: Actinic keratosis |
| cSCC: Cutaneous squamous cell carcinoma | ||
| SCCIS:squamous cell carcinoma in situ | ||
| Thyroid |  | ATC: Anaplastic thyroid cancer |
| HT: Hashimoto's thyroiditis | ||
| PTC: Papillary thyroid cancer |
| ∗log2FC in expression of this searched gene in stem-like cells from each diseased tissue sample relative to stem-like cells in normal samples in each tissue plotted against the malignancy continuum. Samples are colored based on if they are from different disease stage. |
Top |
Malignant transformation related pathway analysis |
| Find out the enriched GO biological processes and KEGG pathways involved in transition from healthy to precancer to cancer |
| Tissue | Disease Stage | Enriched GO biological Processes |
| Colorectum | AD |  |
| Colorectum | SER |  |
| Colorectum | MSS |  |
| Colorectum | MSI-H |  |
| Colorectum | FAP |  |
| ∗Top 15 enriched GO BP terms are showed in the bar plot of each disease state in each tissue. Each row represents a significant GO biological process which is colored according to the -log10(p.adjust). |
| Page: 1 2 3 4 5 6 7 8 9 |
| GO ID | Tissue | Disease Stage | Description | Gene Ratio | Bg Ratio | pvalue | p.adjust | Count |
| GO:0009117 | Colorectum | AD | nucleotide metabolic process | 168/3918 | 489/18723 | 2.20e-12 | 3.36e-10 | 168 |
| GO:0006753 | Colorectum | AD | nucleoside phosphate metabolic process | 169/3918 | 497/18723 | 4.99e-12 | 6.98e-10 | 169 |
| GO:1901293 | Colorectum | AD | nucleoside phosphate biosynthetic process | 80/3918 | 256/18723 | 6.31e-05 | 1.05e-03 | 80 |
| GO:0009165 | Colorectum | AD | nucleotide biosynthetic process | 79/3918 | 254/18723 | 8.33e-05 | 1.30e-03 | 79 |
| GO:00091171 | Colorectum | SER | nucleotide metabolic process | 122/2897 | 489/18723 | 2.50e-08 | 1.76e-06 | 122 |
| GO:00067531 | Colorectum | SER | nucleoside phosphate metabolic process | 122/2897 | 497/18723 | 6.64e-08 | 4.33e-06 | 122 |
| GO:00091651 | Colorectum | SER | nucleotide biosynthetic process | 58/2897 | 254/18723 | 1.21e-03 | 1.38e-02 | 58 |
| GO:19012931 | Colorectum | SER | nucleoside phosphate biosynthetic process | 58/2897 | 256/18723 | 1.47e-03 | 1.59e-02 | 58 |
| GO:00091172 | Colorectum | MSS | nucleotide metabolic process | 144/3467 | 489/18723 | 1.87e-09 | 1.35e-07 | 144 |
| GO:00067532 | Colorectum | MSS | nucleoside phosphate metabolic process | 145/3467 | 497/18723 | 3.25e-09 | 2.23e-07 | 145 |
| GO:19012932 | Colorectum | MSS | nucleoside phosphate biosynthetic process | 71/3467 | 256/18723 | 1.80e-04 | 2.56e-03 | 71 |
| GO:00091652 | Colorectum | MSS | nucleotide biosynthetic process | 70/3467 | 254/18723 | 2.44e-04 | 3.34e-03 | 70 |
| GO:0009123 | Colorectum | MSS | nucleoside monophosphate metabolic process | 25/3467 | 76/18723 | 1.91e-03 | 1.66e-02 | 25 |
| GO:0009124 | Colorectum | MSI-H | nucleoside monophosphate biosynthetic process | 11/1319 | 42/18723 | 1.14e-04 | 3.45e-03 | 11 |
| GO:00091231 | Colorectum | MSI-H | nucleoside monophosphate metabolic process | 15/1319 | 76/18723 | 2.31e-04 | 6.03e-03 | 15 |
| GO:0009265 | Colorectum | MSI-H | 2'-deoxyribonucleotide biosynthetic process | 5/1319 | 12/18723 | 8.97e-04 | 1.58e-02 | 5 |
| GO:0046385 | Colorectum | MSI-H | deoxyribose phosphate biosynthetic process | 5/1319 | 12/18723 | 8.97e-04 | 1.58e-02 | 5 |
| GO:00091173 | Colorectum | MSI-H | nucleotide metabolic process | 53/1319 | 489/18723 | 1.16e-03 | 1.92e-02 | 53 |
| GO:0009394 | Colorectum | MSI-H | 2'-deoxyribonucleotide metabolic process | 9/1319 | 40/18723 | 1.55e-03 | 2.33e-02 | 9 |
| GO:00067533 | Colorectum | MSI-H | nucleoside phosphate metabolic process | 53/1319 | 497/18723 | 1.66e-03 | 2.45e-02 | 53 |
| Page: 1 2 3 4 5 6 7 |
| Pathway ID | Tissue | Disease Stage | Description | Gene Ratio | Bg Ratio | pvalue | p.adjust | qvalue | Count |
| hsa012325 | Esophagus | ESCC | Nucleotide metabolism | 59/4205 | 85/8465 | 1.67e-04 | 6.58e-04 | 3.37e-04 | 59 |
| hsa002405 | Esophagus | ESCC | Pyrimidine metabolism | 41/4205 | 58/8465 | 9.14e-04 | 2.92e-03 | 1.49e-03 | 41 |
| hsa0123212 | Esophagus | ESCC | Nucleotide metabolism | 59/4205 | 85/8465 | 1.67e-04 | 6.58e-04 | 3.37e-04 | 59 |
| hsa0024012 | Esophagus | ESCC | Pyrimidine metabolism | 41/4205 | 58/8465 | 9.14e-04 | 2.92e-03 | 1.49e-03 | 41 |
| hsa01232 | Liver | Cirrhotic | Nucleotide metabolism | 39/2530 | 85/8465 | 1.27e-03 | 6.73e-03 | 4.15e-03 | 39 |
| hsa00240 | Liver | Cirrhotic | Pyrimidine metabolism | 27/2530 | 58/8465 | 5.31e-03 | 1.88e-02 | 1.16e-02 | 27 |
| hsa012321 | Liver | Cirrhotic | Nucleotide metabolism | 39/2530 | 85/8465 | 1.27e-03 | 6.73e-03 | 4.15e-03 | 39 |
| hsa002401 | Liver | Cirrhotic | Pyrimidine metabolism | 27/2530 | 58/8465 | 5.31e-03 | 1.88e-02 | 1.16e-02 | 27 |
| hsa002402 | Liver | HCC | Pyrimidine metabolism | 44/4020 | 58/8465 | 9.34e-06 | 7.11e-05 | 3.95e-05 | 44 |
| hsa012322 | Liver | HCC | Nucleotide metabolism | 59/4020 | 85/8465 | 3.30e-05 | 1.88e-04 | 1.04e-04 | 59 |
| hsa002403 | Liver | HCC | Pyrimidine metabolism | 44/4020 | 58/8465 | 9.34e-06 | 7.11e-05 | 3.95e-05 | 44 |
| hsa012323 | Liver | HCC | Nucleotide metabolism | 59/4020 | 85/8465 | 3.30e-05 | 1.88e-04 | 1.04e-04 | 59 |
| hsa012324 | Oral cavity | OSCC | Nucleotide metabolism | 54/3704 | 85/8465 | 1.78e-04 | 5.95e-04 | 3.03e-04 | 54 |
| hsa002404 | Oral cavity | OSCC | Pyrimidine metabolism | 37/3704 | 58/8465 | 1.62e-03 | 4.45e-03 | 2.26e-03 | 37 |
| hsa0123211 | Oral cavity | OSCC | Nucleotide metabolism | 54/3704 | 85/8465 | 1.78e-04 | 5.95e-04 | 3.03e-04 | 54 |
| hsa0024011 | Oral cavity | OSCC | Pyrimidine metabolism | 37/3704 | 58/8465 | 1.62e-03 | 4.45e-03 | 2.26e-03 | 37 |
| hsa0123221 | Oral cavity | LP | Nucleotide metabolism | 42/2418 | 85/8465 | 3.62e-05 | 2.36e-04 | 1.52e-04 | 42 |
| hsa0024021 | Oral cavity | LP | Pyrimidine metabolism | 28/2418 | 58/8465 | 1.12e-03 | 5.02e-03 | 3.24e-03 | 28 |
| hsa0123231 | Oral cavity | LP | Nucleotide metabolism | 42/2418 | 85/8465 | 3.62e-05 | 2.36e-04 | 1.52e-04 | 42 |
| hsa0024031 | Oral cavity | LP | Pyrimidine metabolism | 28/2418 | 58/8465 | 1.12e-03 | 5.02e-03 | 3.24e-03 | 28 |
| Page: 1 |
Top |
Cell-cell communication analysis |
| Identification of potential cell-cell interactions between two cell types and their ligand-receptor pairs for different disease states |
| Ligand | Receptor | LRpair | Pathway | Tissue | Disease Stage |
| Page: 1 |
Top |
Single-cell gene regulatory network inference analysis |
| Find out the significant the regulons (TFs) and the target genes of each regulon across cell types for different disease states |
| TF | Cell Type | Tissue | Disease Stage | Target Gene | RSS | Regulon Activity |
| ∗The dot plots of a searched regulon are shown for all cell subpopulations in each disease state of each tissue based on the regulon specific score inferred using pySCENIC and by calculating the average expression. |
| Page: 1 |
Top |
Somatic mutation of malignant transformation related genes |
| Annotation of somatic variants for genes involved in malignant transformation |
| Hugo Symbol | Variant Class | Variant Classification | dbSNP RS | HGVSc | HGVSp | HGVSp Short | SWISSPROT | BIOTYPE | SIFT | PolyPhen | Tumor Sample Barcode | Tissue | Histology | Sex | Age | Stage | Therapy Types | Drugs | Outcome |
| DCTD | SNV | Missense_Mutation | novel | c.383N>A | p.Ile128Asn | p.I128N | P32321 | protein_coding | deleterious(0) | probably_damaging(0.994) | TCGA-AC-A5EH-01 | Breast | breast invasive carcinoma | Female | >=65 | I/II | Unknown | Unknown | SD |
| DCTD | SNV | Missense_Mutation | rs778735165 | c.455N>T | p.Ala152Val | p.A152V | P32321 | protein_coding | deleterious(0) | possibly_damaging(0.594) | TCGA-LP-A7HU-01 | Cervix | cervical & endocervical cancer | Female | <65 | I/II | Unknown | Unknown | SD |
| DCTD | SNV | Missense_Mutation | c.128N>G | p.Asp43Gly | p.D43G | P32321 | protein_coding | deleterious(0) | probably_damaging(0.999) | TCGA-AA-A02J-01 | Colorectum | colon adenocarcinoma | Female | >=65 | III/IV | Unknown | Unknown | PD | |
| DCTD | SNV | Missense_Mutation | rs17849458 | c.317N>T | p.Ser106Leu | p.S106L | P32321 | protein_coding | tolerated(0.18) | benign(0.04) | TCGA-AZ-4315-01 | Colorectum | colon adenocarcinoma | Male | <65 | I/II | Unknown | Unknown | SD |
| DCTD | SNV | Missense_Mutation | novel | c.133A>C | p.Asn45His | p.N45H | P32321 | protein_coding | tolerated(0.18) | benign(0.007) | TCGA-F5-6814-01 | Colorectum | rectum adenocarcinoma | Male | <65 | I/II | Unknown | Unknown | SD |
| DCTD | SNV | Missense_Mutation | rs764782245 | c.373N>A | p.Ala125Thr | p.A125T | P32321 | protein_coding | tolerated(0.15) | possibly_damaging(0.566) | TCGA-A5-A0GA-01 | Endometrium | uterine corpus endometrioid carcinoma | Female | >=65 | III/IV | Chemotherapy | taxol | PD |
| DCTD | SNV | Missense_Mutation | rs17849458 | c.317N>T | p.Ser106Leu | p.S106L | P32321 | protein_coding | tolerated(0.18) | benign(0.04) | TCGA-AJ-A3EL-01 | Endometrium | uterine corpus endometrioid carcinoma | Female | <65 | I/II | Unknown | Unknown | SD |
| DCTD | SNV | Missense_Mutation | rs773939009 | c.223N>A | p.Val75Met | p.V75M | P32321 | protein_coding | tolerated(0.06) | benign(0.13) | TCGA-AP-A056-01 | Endometrium | uterine corpus endometrioid carcinoma | Female | <65 | I/II | Unknown | Unknown | SD |
| DCTD | SNV | Missense_Mutation | c.286N>A | p.Ala96Thr | p.A96T | P32321 | protein_coding | deleterious(0) | probably_damaging(0.996) | TCGA-AP-A0LD-01 | Endometrium | uterine corpus endometrioid carcinoma | Female | <65 | I/II | Unknown | Unknown | SD | |
| DCTD | SNV | Missense_Mutation | rs757869621 | c.64N>A | p.Asp22Asn | p.D22N | P32321 | protein_coding | tolerated(0.18) | benign(0.034) | TCGA-AP-A1DV-01 | Endometrium | uterine corpus endometrioid carcinoma | Female | <65 | I/II | Unknown | Unknown | SD |
| Page: 1 2 3 |
Top |
Related drugs of malignant transformation related genes |
| Identification of chemicals and drugs interact with genes involved in malignant transfromation |
| (DGIdb 4.0) |
| Entrez ID | Symbol | Category | Interaction Types | Drug Claim Name | Drug Name | PMIDs |
| 1635 | DCTD | ENZYME | gemcitabine | GEMCITABINE | 22838950 |
| Page: 1 |

Copyright 2023-Present -The University of Texas Health Science Center at Houston |