
|
|||||
|
 | |
| |
| |
| |
| |
| |
|
Gene: DCPS |
Gene summary for DCPS |
| Gene information | Species | Human | Gene symbol | DCPS | Gene ID | 28960 |
| Gene name | decapping enzyme, scavenger | |
| Gene Alias | ARS | |
| Cytomap | 11q24.2 | |
| Gene Type | protein-coding | GO ID | GO:0000288 | UniProtAcc | Q96C86 |
Top |
Malignant transformation analysis |
| Identification of the aberrant gene expression in precancerous and cancerous lesions by comparing the gene expression of stem-like cells in diseased tissues with normal stem cells |
| Entrez ID | Symbol | Replicates | Species | Organ | Tissue | Adj P-value | Log2FC | Malignancy |
| 28960 | DCPS | LZE4T | Human | Esophagus | ESCC | 6.70e-09 | 1.57e-01 | 0.0811 |
| 28960 | DCPS | LZE7T | Human | Esophagus | ESCC | 3.68e-05 | 2.55e-01 | 0.0667 |
| 28960 | DCPS | LZE20T | Human | Esophagus | ESCC | 2.06e-06 | 2.66e-01 | 0.0662 |
| 28960 | DCPS | LZE24T | Human | Esophagus | ESCC | 2.15e-22 | 4.44e-01 | 0.0596 |
| 28960 | DCPS | P2T-E | Human | Esophagus | ESCC | 4.86e-26 | 5.46e-01 | 0.1177 |
| 28960 | DCPS | P4T-E | Human | Esophagus | ESCC | 1.52e-49 | 1.03e+00 | 0.1323 |
| 28960 | DCPS | P5T-E | Human | Esophagus | ESCC | 1.42e-19 | 3.77e-01 | 0.1327 |
| 28960 | DCPS | P8T-E | Human | Esophagus | ESCC | 1.04e-14 | 2.99e-01 | 0.0889 |
| 28960 | DCPS | P9T-E | Human | Esophagus | ESCC | 1.77e-16 | 4.01e-01 | 0.1131 |
| 28960 | DCPS | P10T-E | Human | Esophagus | ESCC | 2.04e-26 | 4.59e-01 | 0.116 |
| 28960 | DCPS | P11T-E | Human | Esophagus | ESCC | 1.13e-18 | 5.73e-01 | 0.1426 |
| 28960 | DCPS | P12T-E | Human | Esophagus | ESCC | 2.45e-36 | 5.40e-01 | 0.1122 |
| 28960 | DCPS | P15T-E | Human | Esophagus | ESCC | 4.35e-17 | 3.79e-01 | 0.1149 |
| 28960 | DCPS | P16T-E | Human | Esophagus | ESCC | 1.62e-54 | 9.96e-01 | 0.1153 |
| 28960 | DCPS | P17T-E | Human | Esophagus | ESCC | 1.01e-09 | 3.97e-01 | 0.1278 |
| 28960 | DCPS | P19T-E | Human | Esophagus | ESCC | 6.29e-12 | 7.67e-01 | 0.1662 |
| 28960 | DCPS | P20T-E | Human | Esophagus | ESCC | 1.57e-09 | 1.81e-01 | 0.1124 |
| 28960 | DCPS | P21T-E | Human | Esophagus | ESCC | 3.14e-51 | 9.03e-01 | 0.1617 |
| 28960 | DCPS | P22T-E | Human | Esophagus | ESCC | 1.56e-13 | 2.76e-01 | 0.1236 |
| 28960 | DCPS | P23T-E | Human | Esophagus | ESCC | 4.11e-13 | 2.78e-01 | 0.108 |
| Page: 1 2 3 4 5 6 |
| Tissue | Expression Dynamics | Abbreviation |
| Esophagus |  | ESCC: Esophageal squamous cell carcinoma |
| HGIN: High-grade intraepithelial neoplasias | ||
| LGIN: Low-grade intraepithelial neoplasias | ||
| Liver | 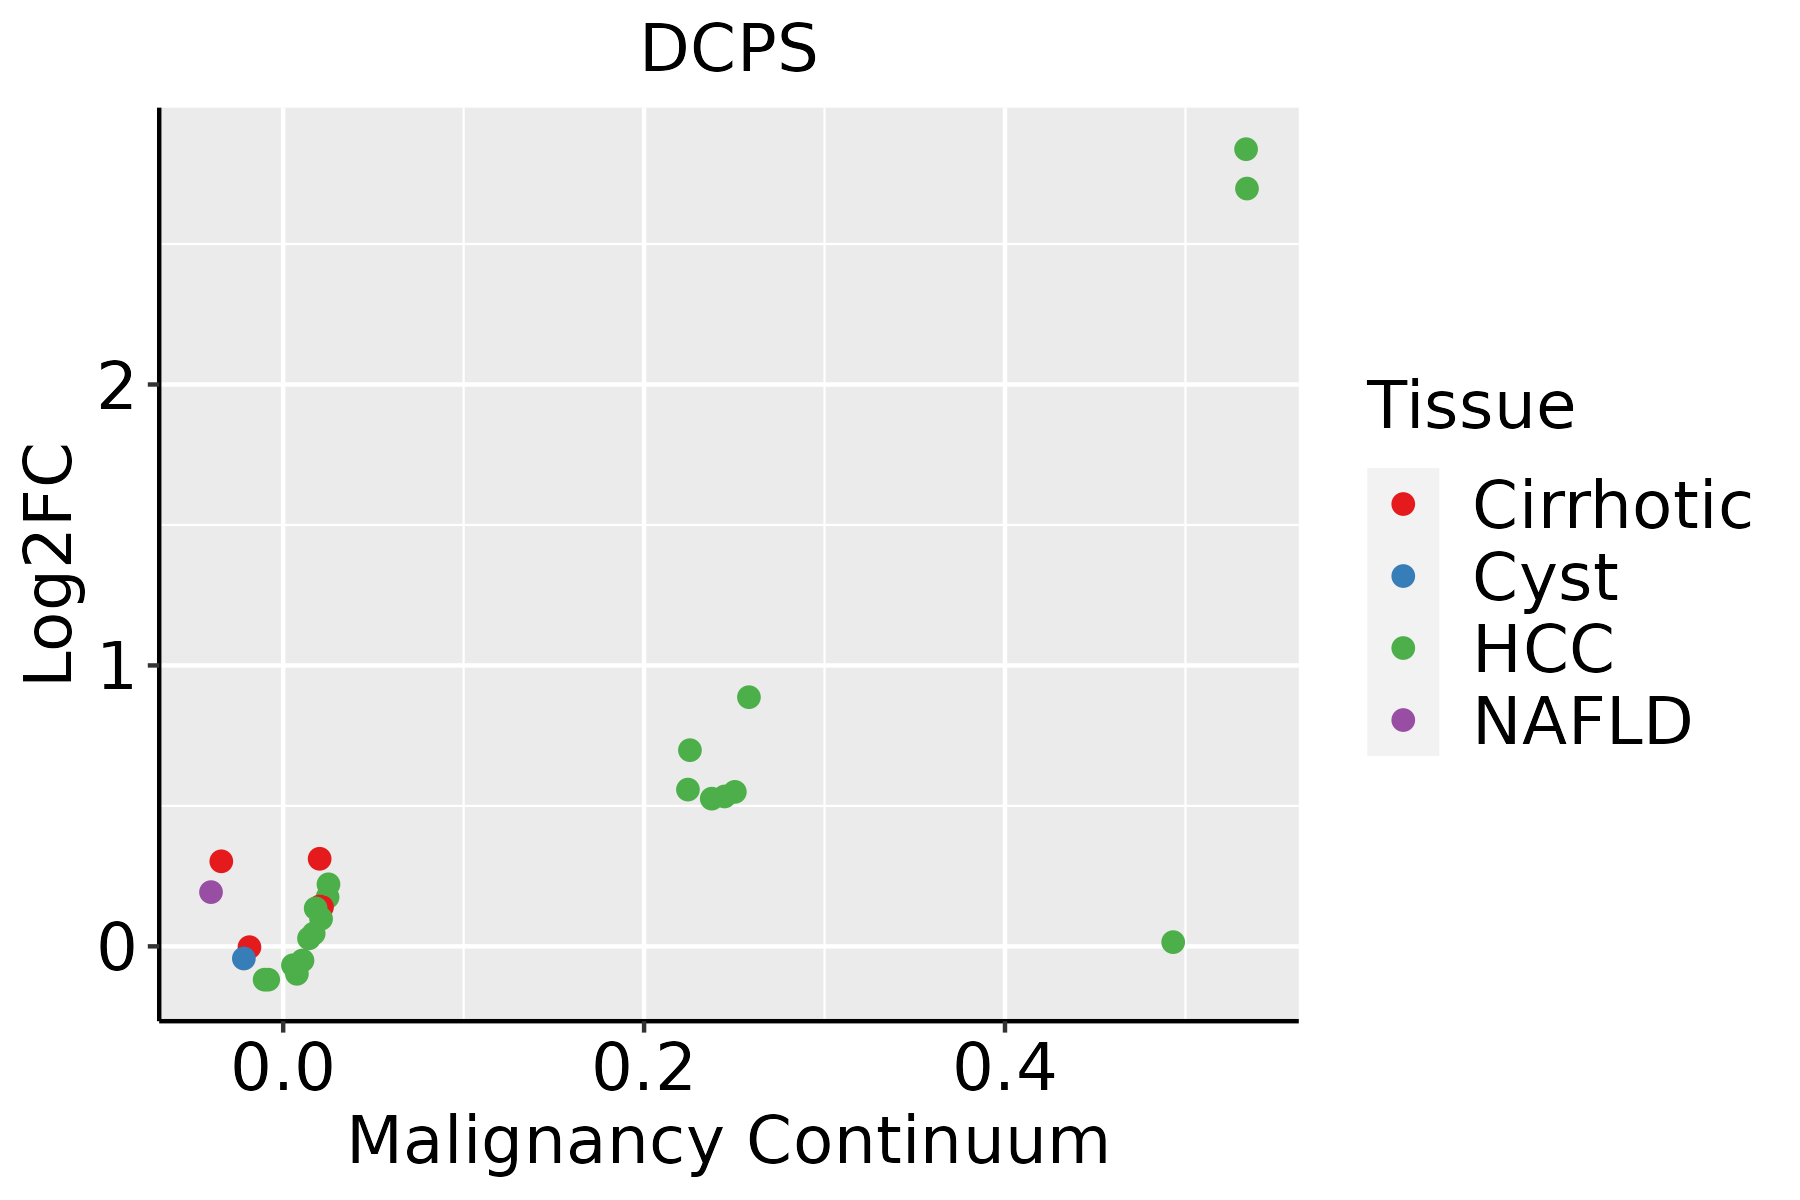 | HCC: Hepatocellular carcinoma |
| NAFLD: Non-alcoholic fatty liver disease | ||
| Oral Cavity |  | EOLP: Erosive Oral lichen planus |
| LP: leukoplakia | ||
| NEOLP: Non-erosive oral lichen planus | ||
| OSCC: Oral squamous cell carcinoma | ||
| Skin |  | AK: Actinic keratosis |
| cSCC: Cutaneous squamous cell carcinoma | ||
| SCCIS:squamous cell carcinoma in situ | ||
| Thyroid |  | ATC: Anaplastic thyroid cancer |
| HT: Hashimoto's thyroiditis | ||
| PTC: Papillary thyroid cancer |
| ∗log2FC in expression of this searched gene in stem-like cells from each diseased tissue sample relative to stem-like cells in normal samples in each tissue plotted against the malignancy continuum. Samples are colored based on if they are from different disease stage. |
Top |
Malignant transformation related pathway analysis |
| Find out the enriched GO biological processes and KEGG pathways involved in transition from healthy to precancer to cancer |
| Tissue | Disease Stage | Enriched GO biological Processes |
| Colorectum | AD |  |
| Colorectum | SER |  |
| Colorectum | MSS |  |
| Colorectum | MSI-H |  |
| Colorectum | FAP |  |
| ∗Top 15 enriched GO BP terms are showed in the bar plot of each disease state in each tissue. Each row represents a significant GO biological process which is colored according to the -log10(p.adjust). |
| Page: 1 2 3 4 5 6 7 8 9 |
| GO ID | Tissue | Disease Stage | Description | Gene Ratio | Bg Ratio | pvalue | p.adjust | Count |
| GO:0008380111 | Esophagus | ESCC | RNA splicing | 336/8552 | 434/18723 | 1.74e-42 | 3.67e-39 | 336 |
| GO:0000375111 | Esophagus | ESCC | RNA splicing, via transesterification reactions | 248/8552 | 324/18723 | 3.05e-30 | 1.49e-27 | 248 |
| GO:0000377111 | Esophagus | ESCC | RNA splicing, via transesterification reactions with bulged adenosine as nucleophile | 244/8552 | 320/18723 | 2.52e-29 | 1.07e-26 | 244 |
| GO:0000398111 | Esophagus | ESCC | mRNA splicing, via spliceosome | 244/8552 | 320/18723 | 2.52e-29 | 1.07e-26 | 244 |
| GO:0009896111 | Esophagus | ESCC | positive regulation of catabolic process | 332/8552 | 492/18723 | 4.36e-23 | 9.22e-21 | 332 |
| GO:0031331111 | Esophagus | ESCC | positive regulation of cellular catabolic process | 292/8552 | 427/18723 | 8.67e-22 | 1.53e-19 | 292 |
| GO:1903311110 | Esophagus | ESCC | regulation of mRNA metabolic process | 210/8552 | 288/18723 | 3.25e-21 | 5.56e-19 | 210 |
| GO:0006401110 | Esophagus | ESCC | RNA catabolic process | 204/8552 | 278/18723 | 3.39e-21 | 5.66e-19 | 204 |
| GO:0034655110 | Esophagus | ESCC | nucleobase-containing compound catabolic process | 272/8552 | 407/18723 | 2.92e-18 | 2.90e-16 | 272 |
| GO:0006402110 | Esophagus | ESCC | mRNA catabolic process | 170/8552 | 232/18723 | 8.70e-18 | 8.00e-16 | 170 |
| GO:0006417111 | Esophagus | ESCC | regulation of translation | 304/8552 | 468/18723 | 1.53e-17 | 1.33e-15 | 304 |
| GO:004670018 | Esophagus | ESCC | heterocycle catabolic process | 286/8552 | 445/18723 | 1.12e-15 | 7.47e-14 | 286 |
| GO:004427019 | Esophagus | ESCC | cellular nitrogen compound catabolic process | 288/8552 | 451/18723 | 3.03e-15 | 1.79e-13 | 288 |
| GO:0071496111 | Esophagus | ESCC | cellular response to external stimulus | 215/8552 | 320/18723 | 4.29e-15 | 2.43e-13 | 215 |
| GO:001943918 | Esophagus | ESCC | aromatic compound catabolic process | 295/8552 | 467/18723 | 1.09e-14 | 5.98e-13 | 295 |
| GO:190136118 | Esophagus | ESCC | organic cyclic compound catabolic process | 307/8552 | 495/18723 | 9.99e-14 | 4.80e-12 | 307 |
| GO:0031668111 | Esophagus | ESCC | cellular response to extracellular stimulus | 168/8552 | 246/18723 | 4.93e-13 | 2.23e-11 | 168 |
| GO:000095618 | Esophagus | ESCC | nuclear-transcribed mRNA catabolic process | 88/8552 | 112/18723 | 9.41e-13 | 4.14e-11 | 88 |
| GO:0031669110 | Esophagus | ESCC | cellular response to nutrient levels | 148/8552 | 215/18723 | 4.58e-12 | 1.76e-10 | 148 |
| GO:0031667111 | Esophagus | ESCC | response to nutrient levels | 289/8552 | 474/18723 | 9.25e-12 | 3.47e-10 | 289 |
| Page: 1 2 3 4 5 6 7 8 9 10 11 12 13 14 15 16 |
| Pathway ID | Tissue | Disease Stage | Description | Gene Ratio | Bg Ratio | pvalue | p.adjust | qvalue | Count |
| hsa0301824 | Esophagus | ESCC | RNA degradation | 62/4205 | 79/8465 | 1.18e-07 | 9.39e-07 | 4.81e-07 | 62 |
| hsa0301834 | Esophagus | ESCC | RNA degradation | 62/4205 | 79/8465 | 1.18e-07 | 9.39e-07 | 4.81e-07 | 62 |
| hsa03018 | Liver | Cirrhotic | RNA degradation | 44/2530 | 79/8465 | 1.43e-06 | 1.65e-05 | 1.02e-05 | 44 |
| hsa030181 | Liver | Cirrhotic | RNA degradation | 44/2530 | 79/8465 | 1.43e-06 | 1.65e-05 | 1.02e-05 | 44 |
| hsa030182 | Liver | HCC | RNA degradation | 58/4020 | 79/8465 | 2.29e-06 | 2.19e-05 | 1.22e-05 | 58 |
| hsa030183 | Liver | HCC | RNA degradation | 58/4020 | 79/8465 | 2.29e-06 | 2.19e-05 | 1.22e-05 | 58 |
| hsa030189 | Oral cavity | OSCC | RNA degradation | 59/3704 | 79/8465 | 2.05e-08 | 1.91e-07 | 9.70e-08 | 59 |
| hsa0301814 | Oral cavity | OSCC | RNA degradation | 59/3704 | 79/8465 | 2.05e-08 | 1.91e-07 | 9.70e-08 | 59 |
| hsa0301823 | Oral cavity | LP | RNA degradation | 39/2418 | 79/8465 | 6.98e-05 | 4.38e-04 | 2.83e-04 | 39 |
| hsa0301833 | Oral cavity | LP | RNA degradation | 39/2418 | 79/8465 | 6.98e-05 | 4.38e-04 | 2.83e-04 | 39 |
| Page: 1 |
Top |
Cell-cell communication analysis |
| Identification of potential cell-cell interactions between two cell types and their ligand-receptor pairs for different disease states |
| Ligand | Receptor | LRpair | Pathway | Tissue | Disease Stage |
| Page: 1 |
Top |
Single-cell gene regulatory network inference analysis |
| Find out the significant the regulons (TFs) and the target genes of each regulon across cell types for different disease states |
| TF | Cell Type | Tissue | Disease Stage | Target Gene | RSS | Regulon Activity |
| ∗The dot plots of a searched regulon are shown for all cell subpopulations in each disease state of each tissue based on the regulon specific score inferred using pySCENIC and by calculating the average expression. |
| Page: 1 |
Top |
Somatic mutation of malignant transformation related genes |
| Annotation of somatic variants for genes involved in malignant transformation |
| Hugo Symbol | Variant Class | Variant Classification | dbSNP RS | HGVSc | HGVSp | HGVSp Short | SWISSPROT | BIOTYPE | SIFT | PolyPhen | Tumor Sample Barcode | Tissue | Histology | Sex | Age | Stage | Therapy Types | Drugs | Outcome |
| DCPS | SNV | Missense_Mutation | c.419N>C | p.Leu140Pro | p.L140P | Q96C86 | protein_coding | deleterious(0) | probably_damaging(0.99) | TCGA-A8-A09Z-01 | Breast | breast invasive carcinoma | Female | >=65 | I/II | Unknown | Unknown | SD | |
| DCPS | SNV | Missense_Mutation | novel | c.184N>T | p.Ile62Phe | p.I62F | Q96C86 | protein_coding | deleterious(0) | benign(0.229) | TCGA-AR-A2LK-01 | Breast | breast invasive carcinoma | Female | <65 | III/IV | Hormone Therapy | anastrozole | PD |
| DCPS | deletion | Frame_Shift_Del | novel | c.677delG | p.Gly226AlafsTer33 | p.G226Afs*33 | Q96C86 | protein_coding | TCGA-EA-A410-01 | Cervix | cervical & endocervical cancer | Female | <65 | I/II | Unknown | Unknown | SD | ||
| DCPS | SNV | Missense_Mutation | c.122G>A | p.Arg41His | p.R41H | Q96C86 | protein_coding | tolerated(0.36) | benign(0) | TCGA-A6-5667-01 | Colorectum | colon adenocarcinoma | Female | <65 | III/IV | Chemotherapy | oxaliplatin | SD | |
| DCPS | SNV | Missense_Mutation | rs554435261 | c.658N>A | p.Ala220Thr | p.A220T | Q96C86 | protein_coding | deleterious(0) | probably_damaging(0.999) | TCGA-AA-3845-01 | Colorectum | colon adenocarcinoma | Female | >=65 | I/II | Unknown | Unknown | PD |
| DCPS | SNV | Missense_Mutation | rs773359297 | c.434G>A | p.Arg145His | p.R145H | Q96C86 | protein_coding | tolerated(0.26) | benign(0.001) | TCGA-AA-3864-01 | Colorectum | colon adenocarcinoma | Male | >=65 | I/II | Unknown | Unknown | SD |
| DCPS | SNV | Missense_Mutation | rs371676072 | c.958N>A | p.Ala320Thr | p.A320T | Q96C86 | protein_coding | tolerated(0.33) | benign(0) | TCGA-AM-5821-01 | Colorectum | colon adenocarcinoma | Female | >=65 | I/II | Unknown | Unknown | SD |
| DCPS | SNV | Missense_Mutation | novel | c.350N>G | p.His117Arg | p.H117R | Q96C86 | protein_coding | tolerated(0.68) | benign(0) | TCGA-AZ-6601-01 | Colorectum | colon adenocarcinoma | Male | >=65 | I/II | Unknown | Unknown | PD |
| DCPS | SNV | Missense_Mutation | rs768453817 | c.694N>A | p.Asp232Asn | p.D232N | Q96C86 | protein_coding | deleterious(0) | probably_damaging(0.955) | TCGA-EI-6882-01 | Colorectum | rectum adenocarcinoma | Male | <65 | I/II | Unknown | Unknown | SD |
| DCPS | SNV | Missense_Mutation | c.235N>T | p.Asp79Tyr | p.D79Y | Q96C86 | protein_coding | deleterious(0) | possibly_damaging(0.869) | TCGA-G5-6233-01 | Colorectum | rectum adenocarcinoma | Male | >=65 | III/IV | Chemotherapy | 5-fluorouracil | PD |
| Page: 1 2 3 4 |
Top |
Related drugs of malignant transformation related genes |
| Identification of chemicals and drugs interact with genes involved in malignant transfromation |
| (DGIdb 4.0) |
| Entrez ID | Symbol | Category | Interaction Types | Drug Claim Name | Drug Name | PMIDs |
| 28960 | DCPS | ENZYME, DRUGGABLE GENOME | RG3039 | |||
| 28960 | DCPS | ENZYME, DRUGGABLE GENOME | RG3039 |
| Page: 1 |

Copyright 2023-Present -The University of Texas Health Science Center at Houston |