
|
|||||
|
 | |
| |
| |
| |
| |
| |
|
Gene: DCLRE1C |
Gene summary for DCLRE1C |
| Gene information | Species | Human | Gene symbol | DCLRE1C | Gene ID | 64421 |
| Gene name | DNA cross-link repair 1C | |
| Gene Alias | A-SCID | |
| Cytomap | 10p13 | |
| Gene Type | protein-coding | GO ID | GO:0000723 | UniProtAcc | Q96SD1 |
Top |
Malignant transformation analysis |
| Identification of the aberrant gene expression in precancerous and cancerous lesions by comparing the gene expression of stem-like cells in diseased tissues with normal stem cells |
| Entrez ID | Symbol | Replicates | Species | Organ | Tissue | Adj P-value | Log2FC | Malignancy |
| 64421 | DCLRE1C | LZE22T | Human | Esophagus | ESCC | 5.58e-03 | 2.23e-01 | 0.068 |
| 64421 | DCLRE1C | LZE24T | Human | Esophagus | ESCC | 7.12e-11 | 4.51e-01 | 0.0596 |
| 64421 | DCLRE1C | LZE6T | Human | Esophagus | ESCC | 4.33e-02 | 1.28e-01 | 0.0845 |
| 64421 | DCLRE1C | P1T-E | Human | Esophagus | ESCC | 4.28e-06 | 6.42e-01 | 0.0875 |
| 64421 | DCLRE1C | P2T-E | Human | Esophagus | ESCC | 2.11e-11 | 2.19e-01 | 0.1177 |
| 64421 | DCLRE1C | P4T-E | Human | Esophagus | ESCC | 5.34e-07 | 1.48e-01 | 0.1323 |
| 64421 | DCLRE1C | P5T-E | Human | Esophagus | ESCC | 6.48e-04 | 9.53e-02 | 0.1327 |
| 64421 | DCLRE1C | P8T-E | Human | Esophagus | ESCC | 2.99e-09 | 1.60e-01 | 0.0889 |
| 64421 | DCLRE1C | P9T-E | Human | Esophagus | ESCC | 1.70e-02 | 5.19e-02 | 0.1131 |
| 64421 | DCLRE1C | P10T-E | Human | Esophagus | ESCC | 1.54e-11 | 1.68e-01 | 0.116 |
| 64421 | DCLRE1C | P12T-E | Human | Esophagus | ESCC | 2.53e-14 | 1.87e-01 | 0.1122 |
| 64421 | DCLRE1C | P15T-E | Human | Esophagus | ESCC | 1.31e-07 | 1.18e-01 | 0.1149 |
| 64421 | DCLRE1C | P16T-E | Human | Esophagus | ESCC | 6.04e-09 | 1.59e-01 | 0.1153 |
| 64421 | DCLRE1C | P20T-E | Human | Esophagus | ESCC | 6.06e-15 | 1.98e-01 | 0.1124 |
| 64421 | DCLRE1C | P21T-E | Human | Esophagus | ESCC | 4.68e-13 | 3.09e-01 | 0.1617 |
| 64421 | DCLRE1C | P23T-E | Human | Esophagus | ESCC | 1.56e-06 | 3.02e-01 | 0.108 |
| 64421 | DCLRE1C | P24T-E | Human | Esophagus | ESCC | 5.65e-10 | 1.92e-01 | 0.1287 |
| 64421 | DCLRE1C | P26T-E | Human | Esophagus | ESCC | 1.12e-06 | 1.66e-01 | 0.1276 |
| 64421 | DCLRE1C | P27T-E | Human | Esophagus | ESCC | 7.83e-12 | 2.45e-01 | 0.1055 |
| 64421 | DCLRE1C | P28T-E | Human | Esophagus | ESCC | 7.63e-04 | 5.58e-02 | 0.1149 |
| Page: 1 2 3 |
| Tissue | Expression Dynamics | Abbreviation |
| Esophagus | 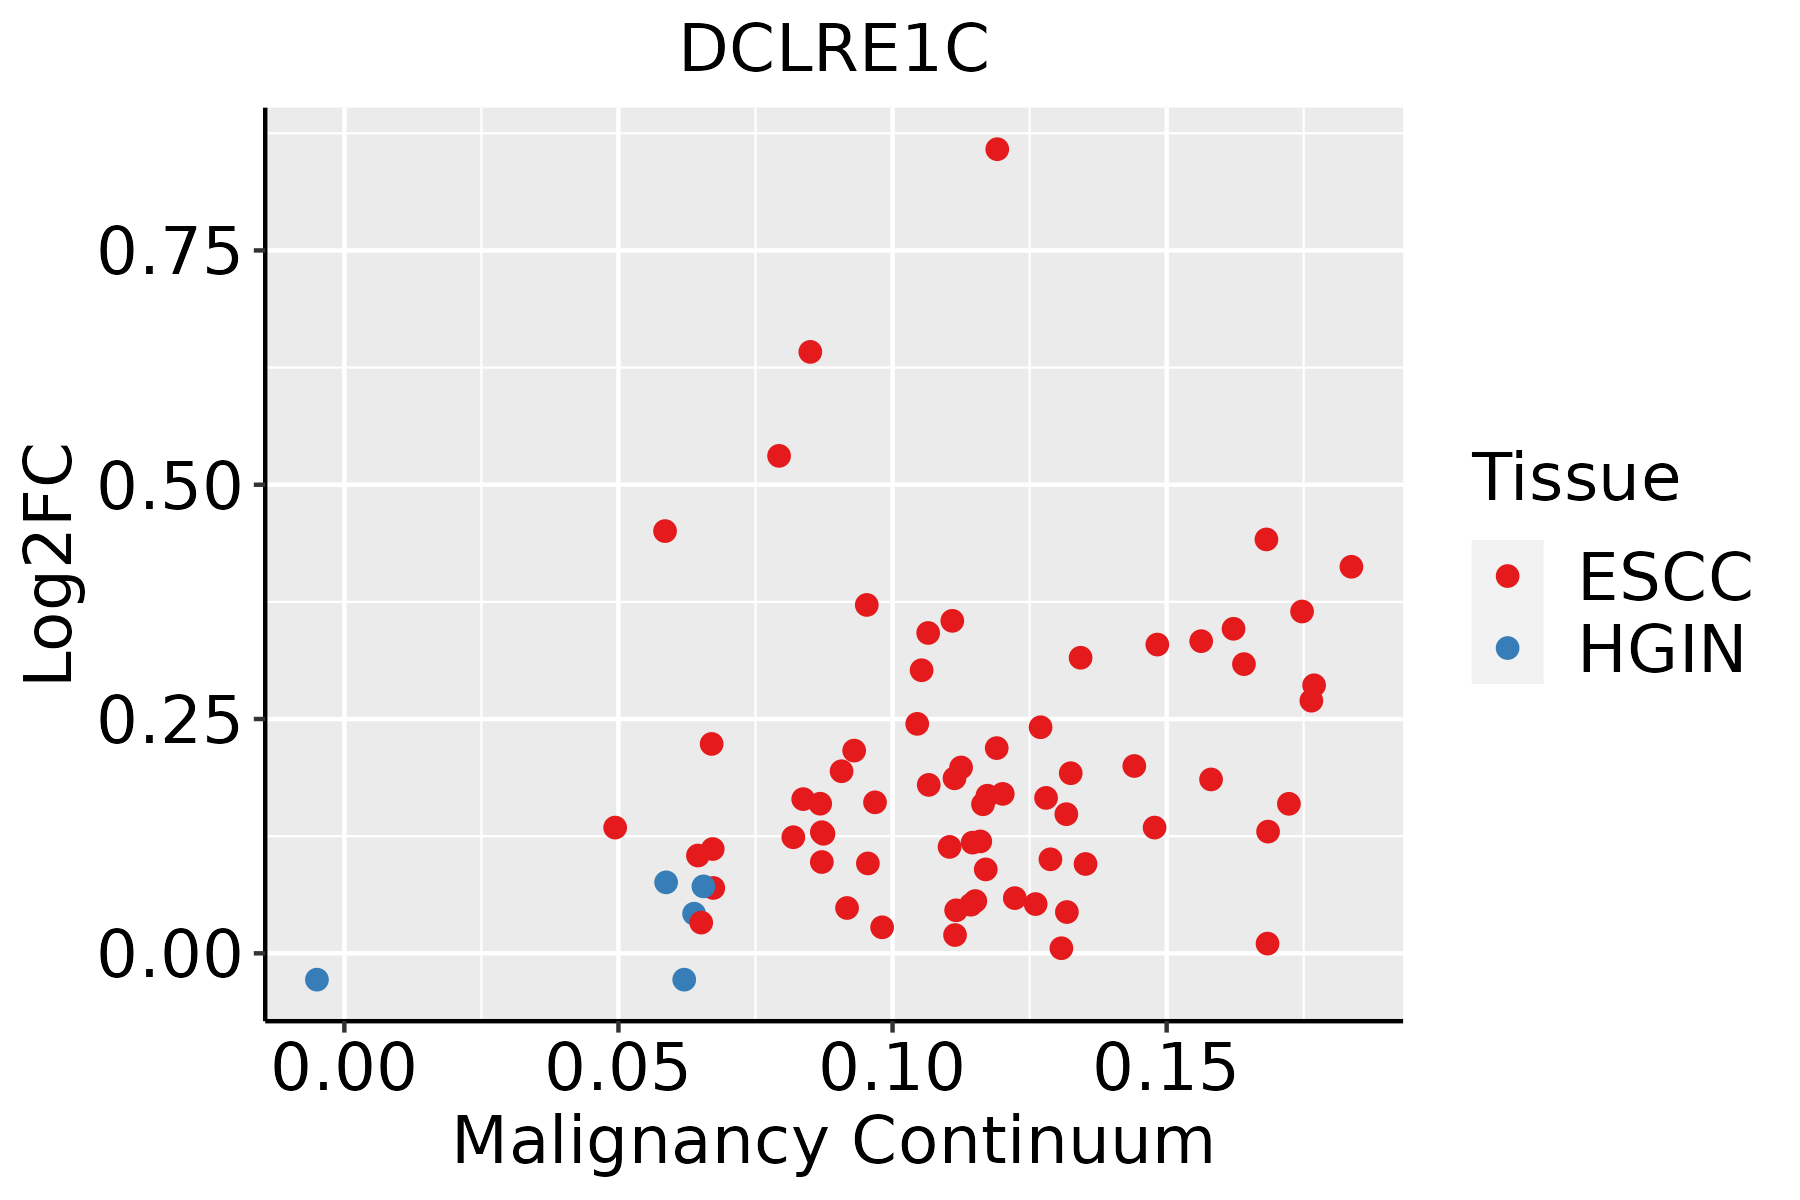 | ESCC: Esophageal squamous cell carcinoma |
| HGIN: High-grade intraepithelial neoplasias | ||
| LGIN: Low-grade intraepithelial neoplasias | ||
| Liver |  | HCC: Hepatocellular carcinoma |
| NAFLD: Non-alcoholic fatty liver disease |
| ∗log2FC in expression of this searched gene in stem-like cells from each diseased tissue sample relative to stem-like cells in normal samples in each tissue plotted against the malignancy continuum. Samples are colored based on if they are from different disease stage. |
Top |
Malignant transformation related pathway analysis |
| Find out the enriched GO biological processes and KEGG pathways involved in transition from healthy to precancer to cancer |
| Tissue | Disease Stage | Enriched GO biological Processes |
| Colorectum | AD |  |
| Colorectum | SER |  |
| Colorectum | MSS |  |
| Colorectum | MSI-H |  |
| Colorectum | FAP |  |
| ∗Top 15 enriched GO BP terms are showed in the bar plot of each disease state in each tissue. Each row represents a significant GO biological process which is colored according to the -log10(p.adjust). |
| Page: 1 2 3 4 5 6 7 8 9 |
| GO ID | Tissue | Disease Stage | Description | Gene Ratio | Bg Ratio | pvalue | p.adjust | Count |
| GO:001021217 | Esophagus | ESCC | response to ionizing radiation | 110/8552 | 148/18723 | 1.11e-12 | 4.78e-11 | 110 |
| GO:000072319 | Esophagus | ESCC | telomere maintenance | 99/8552 | 131/18723 | 2.68e-12 | 1.08e-10 | 99 |
| GO:000931419 | Esophagus | ESCC | response to radiation | 277/8552 | 456/18723 | 4.42e-11 | 1.43e-09 | 277 |
| GO:00903053 | Esophagus | ESCC | nucleic acid phosphodiester bond hydrolysis | 163/8552 | 261/18723 | 3.07e-08 | 5.73e-07 | 163 |
| GO:00063024 | Esophagus | ESCC | double-strand break repair | 152/8552 | 251/18723 | 1.33e-06 | 1.62e-05 | 152 |
| GO:003220014 | Esophagus | ESCC | telomere organization | 99/8552 | 159/18723 | 1.77e-05 | 1.57e-04 | 99 |
| GO:00063101 | Esophagus | ESCC | DNA recombination | 168/8552 | 305/18723 | 5.58e-04 | 3.05e-03 | 168 |
| GO:00162332 | Esophagus | ESCC | telomere capping | 28/8552 | 39/18723 | 8.57e-04 | 4.40e-03 | 28 |
| GO:00025622 | Esophagus | ESCC | somatic diversification of immune receptors via germline recombination within a single locus | 43/8552 | 66/18723 | 1.10e-03 | 5.53e-03 | 43 |
| GO:0006303 | Esophagus | ESCC | double-strand break repair via nonhomologous end joining | 43/8552 | 66/18723 | 1.10e-03 | 5.53e-03 | 43 |
| GO:00164442 | Esophagus | ESCC | somatic cell DNA recombination | 43/8552 | 66/18723 | 1.10e-03 | 5.53e-03 | 43 |
| GO:00022003 | Esophagus | ESCC | somatic diversification of immune receptors | 49/8552 | 77/18723 | 1.12e-03 | 5.60e-03 | 49 |
| GO:19031317 | Esophagus | ESCC | mononuclear cell differentiation | 226/8552 | 426/18723 | 1.20e-03 | 5.88e-03 | 226 |
| GO:00300984 | Esophagus | ESCC | lymphocyte differentiation | 192/8552 | 374/18723 | 1.52e-02 | 4.93e-02 | 192 |
| GO:000072311 | Liver | HCC | telomere maintenance | 85/7958 | 131/18723 | 1.86e-07 | 3.40e-06 | 85 |
| GO:0090305 | Liver | HCC | nucleic acid phosphodiester bond hydrolysis | 152/7958 | 261/18723 | 1.90e-07 | 3.46e-06 | 152 |
| GO:001021221 | Liver | HCC | response to ionizing radiation | 89/7958 | 148/18723 | 1.10e-05 | 1.26e-04 | 89 |
| GO:00063021 | Liver | HCC | double-strand break repair | 131/7958 | 251/18723 | 1.17e-03 | 6.54e-03 | 131 |
| GO:00322001 | Liver | HCC | telomere organization | 86/7958 | 159/18723 | 2.06e-03 | 1.04e-02 | 86 |
| GO:00093146 | Liver | HCC | response to radiation | 223/7958 | 456/18723 | 3.08e-03 | 1.43e-02 | 223 |
| Page: 1 2 |
| Pathway ID | Tissue | Disease Stage | Description | Gene Ratio | Bg Ratio | pvalue | p.adjust | qvalue | Count |
| Page: 1 |
Top |
Cell-cell communication analysis |
| Identification of potential cell-cell interactions between two cell types and their ligand-receptor pairs for different disease states |
| Ligand | Receptor | LRpair | Pathway | Tissue | Disease Stage |
| Page: 1 |
Top |
Single-cell gene regulatory network inference analysis |
| Find out the significant the regulons (TFs) and the target genes of each regulon across cell types for different disease states |
| TF | Cell Type | Tissue | Disease Stage | Target Gene | RSS | Regulon Activity |
| ∗The dot plots of a searched regulon are shown for all cell subpopulations in each disease state of each tissue based on the regulon specific score inferred using pySCENIC and by calculating the average expression. |
| Page: 1 |
Top |
Somatic mutation of malignant transformation related genes |
| Annotation of somatic variants for genes involved in malignant transformation |
| Hugo Symbol | Variant Class | Variant Classification | dbSNP RS | HGVSc | HGVSp | HGVSp Short | SWISSPROT | BIOTYPE | SIFT | PolyPhen | Tumor Sample Barcode | Tissue | Histology | Sex | Age | Stage | Therapy Types | Drugs | Outcome |
| DCLRE1C | SNV | Missense_Mutation | c.1484N>C | p.Arg495Thr | p.R495T | Q96SD1 | protein_coding | tolerated_low_confidence(0.49) | benign(0) | TCGA-A2-A0EV-01 | Breast | breast invasive carcinoma | Female | >=65 | I/II | Unknown | Unknown | SD | |
| DCLRE1C | SNV | Missense_Mutation | c.1993G>C | p.Glu665Gln | p.E665Q | Q96SD1 | protein_coding | deleterious_low_confidence(0.01) | possibly_damaging(0.796) | TCGA-A2-A0EY-01 | Breast | breast invasive carcinoma | Female | <65 | I/II | Chemotherapy | adriamycin | SD | |
| DCLRE1C | SNV | Missense_Mutation | c.1310G>C | p.Arg437Thr | p.R437T | Q96SD1 | protein_coding | tolerated_low_confidence(0.06) | benign(0.009) | TCGA-A2-A0YK-01 | Breast | breast invasive carcinoma | Female | <65 | I/II | Chemotherapy | cytoxan | SD | |
| DCLRE1C | SNV | Missense_Mutation | c.442N>C | p.Glu148Gln | p.E148Q | Q96SD1 | protein_coding | deleterious(0.04) | benign(0.212) | TCGA-AR-A0TX-01 | Breast | breast invasive carcinoma | Female | <65 | I/II | Unknown | Unknown | SD | |
| DCLRE1C | SNV | Missense_Mutation | c.1084N>C | p.Ser362Pro | p.S362P | Q96SD1 | protein_coding | tolerated(0.24) | benign(0.01) | TCGA-BH-A0DS-01 | Breast | breast invasive carcinoma | Female | >=65 | III/IV | Chemotherapy | cyclophosphamide | SD | |
| DCLRE1C | insertion | Frame_Shift_Ins | novel | c.1186_1187insAATATTACAATAGAGAAAATACAGTA | p.Pro396GlnfsTer15 | p.P396Qfs*15 | Q96SD1 | protein_coding | TCGA-A8-A07R-01 | Breast | breast invasive carcinoma | Female | >=65 | III/IV | Ancillary | zoledronic | SD | ||
| DCLRE1C | deletion | Frame_Shift_Del | novel | c.1619delC | p.Ser540Ter | p.S540* | Q96SD1 | protein_coding | TCGA-EW-A2FV-01 | Breast | breast invasive carcinoma | Female | <65 | III/IV | Chemotherapy | docetaxel | SD | ||
| DCLRE1C | SNV | Missense_Mutation | novel | c.70C>A | p.Leu24Met | p.L24M | Q96SD1 | protein_coding | deleterious(0.02) | probably_damaging(0.967) | TCGA-2W-A8YY-01 | Cervix | cervical & endocervical cancer | Female | <65 | I/II | Chemotherapy | cisplatin | CR |
| DCLRE1C | SNV | Missense_Mutation | c.310N>A | p.Glu104Lys | p.E104K | Q96SD1 | protein_coding | deleterious(0.03) | possibly_damaging(0.603) | TCGA-DS-A0VM-01 | Cervix | cervical & endocervical cancer | Female | <65 | I/II | Chemotherapy | cisplatin | PD | |
| DCLRE1C | SNV | Missense_Mutation | novel | c.1148N>A | p.Arg383Gln | p.R383Q | Q96SD1 | protein_coding | tolerated(0.59) | benign(0) | TCGA-EA-A3HU-01 | Cervix | cervical & endocervical cancer | Female | <65 | I/II | Unknown | Unknown | SD |
| Page: 1 2 3 4 5 6 7 8 |
Top |
Related drugs of malignant transformation related genes |
| Identification of chemicals and drugs interact with genes involved in malignant transfromation |
| (DGIdb 4.0) |
| Entrez ID | Symbol | Category | Interaction Types | Drug Claim Name | Drug Name | PMIDs |
| Page: 1 |

Copyright 2023-Present -The University of Texas Health Science Center at Houston |