
|
|||||
|
 | |
| |
| |
| |
| |
| |
|
Gene: DCK |
Gene summary for DCK |
| Gene information | Species | Human | Gene symbol | DCK | Gene ID | 1633 |
| Gene name | deoxycytidine kinase | |
| Gene Alias | DCK | |
| Cytomap | 4q13.3 | |
| Gene Type | protein-coding | GO ID | GO:0006139 | UniProtAcc | F5CTF3 |
Top |
Malignant transformation analysis |
| Identification of the aberrant gene expression in precancerous and cancerous lesions by comparing the gene expression of stem-like cells in diseased tissues with normal stem cells |
| Entrez ID | Symbol | Replicates | Species | Organ | Tissue | Adj P-value | Log2FC | Malignancy |
| 1633 | DCK | LZE4T | Human | Esophagus | ESCC | 1.55e-03 | 1.37e-01 | 0.0811 |
| 1633 | DCK | LZE7T | Human | Esophagus | ESCC | 3.37e-03 | 3.81e-01 | 0.0667 |
| 1633 | DCK | LZE24T | Human | Esophagus | ESCC | 2.35e-15 | 4.69e-01 | 0.0596 |
| 1633 | DCK | LZE6T | Human | Esophagus | ESCC | 2.20e-06 | 2.31e-01 | 0.0845 |
| 1633 | DCK | P2T-E | Human | Esophagus | ESCC | 2.07e-30 | 6.53e-01 | 0.1177 |
| 1633 | DCK | P4T-E | Human | Esophagus | ESCC | 9.92e-32 | 7.03e-01 | 0.1323 |
| 1633 | DCK | P5T-E | Human | Esophagus | ESCC | 3.57e-08 | 1.66e-01 | 0.1327 |
| 1633 | DCK | P8T-E | Human | Esophagus | ESCC | 4.20e-09 | 1.79e-01 | 0.0889 |
| 1633 | DCK | P9T-E | Human | Esophagus | ESCC | 4.74e-06 | 7.70e-02 | 0.1131 |
| 1633 | DCK | P10T-E | Human | Esophagus | ESCC | 8.97e-20 | 2.58e-01 | 0.116 |
| 1633 | DCK | P11T-E | Human | Esophagus | ESCC | 3.81e-10 | 2.43e-01 | 0.1426 |
| 1633 | DCK | P12T-E | Human | Esophagus | ESCC | 4.77e-20 | 4.56e-01 | 0.1122 |
| 1633 | DCK | P15T-E | Human | Esophagus | ESCC | 1.00e-23 | 4.87e-01 | 0.1149 |
| 1633 | DCK | P16T-E | Human | Esophagus | ESCC | 3.22e-26 | 5.45e-01 | 0.1153 |
| 1633 | DCK | P17T-E | Human | Esophagus | ESCC | 1.29e-04 | 2.79e-01 | 0.1278 |
| 1633 | DCK | P20T-E | Human | Esophagus | ESCC | 2.95e-15 | 2.76e-01 | 0.1124 |
| 1633 | DCK | P21T-E | Human | Esophagus | ESCC | 5.32e-24 | 3.48e-01 | 0.1617 |
| 1633 | DCK | P22T-E | Human | Esophagus | ESCC | 6.06e-14 | 2.99e-01 | 0.1236 |
| 1633 | DCK | P23T-E | Human | Esophagus | ESCC | 2.39e-19 | 3.48e-01 | 0.108 |
| 1633 | DCK | P24T-E | Human | Esophagus | ESCC | 6.40e-08 | 1.68e-01 | 0.1287 |
| Page: 1 2 3 4 |
| Tissue | Expression Dynamics | Abbreviation |
| Esophagus | 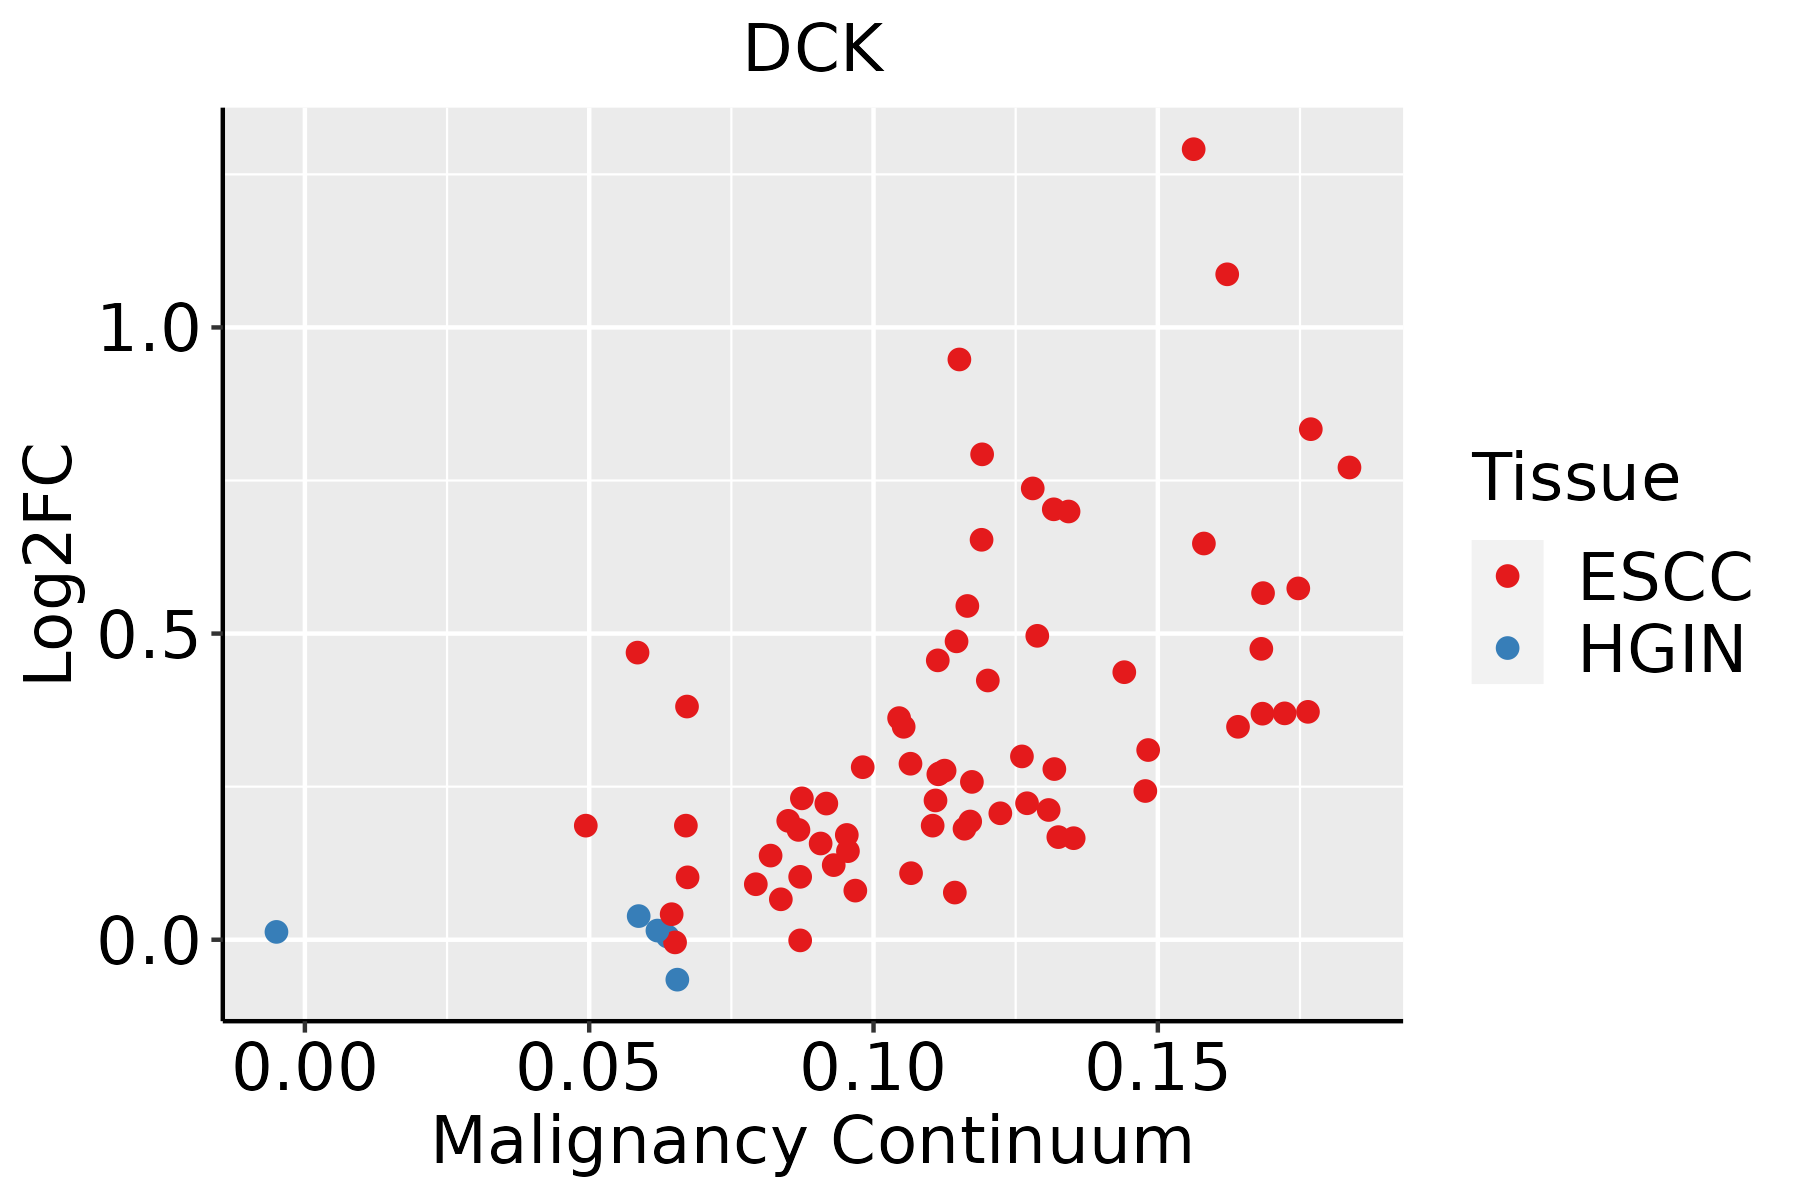 | ESCC: Esophageal squamous cell carcinoma |
| HGIN: High-grade intraepithelial neoplasias | ||
| LGIN: Low-grade intraepithelial neoplasias | ||
| Oral Cavity |  | EOLP: Erosive Oral lichen planus |
| LP: leukoplakia | ||
| NEOLP: Non-erosive oral lichen planus | ||
| OSCC: Oral squamous cell carcinoma | ||
| Skin | 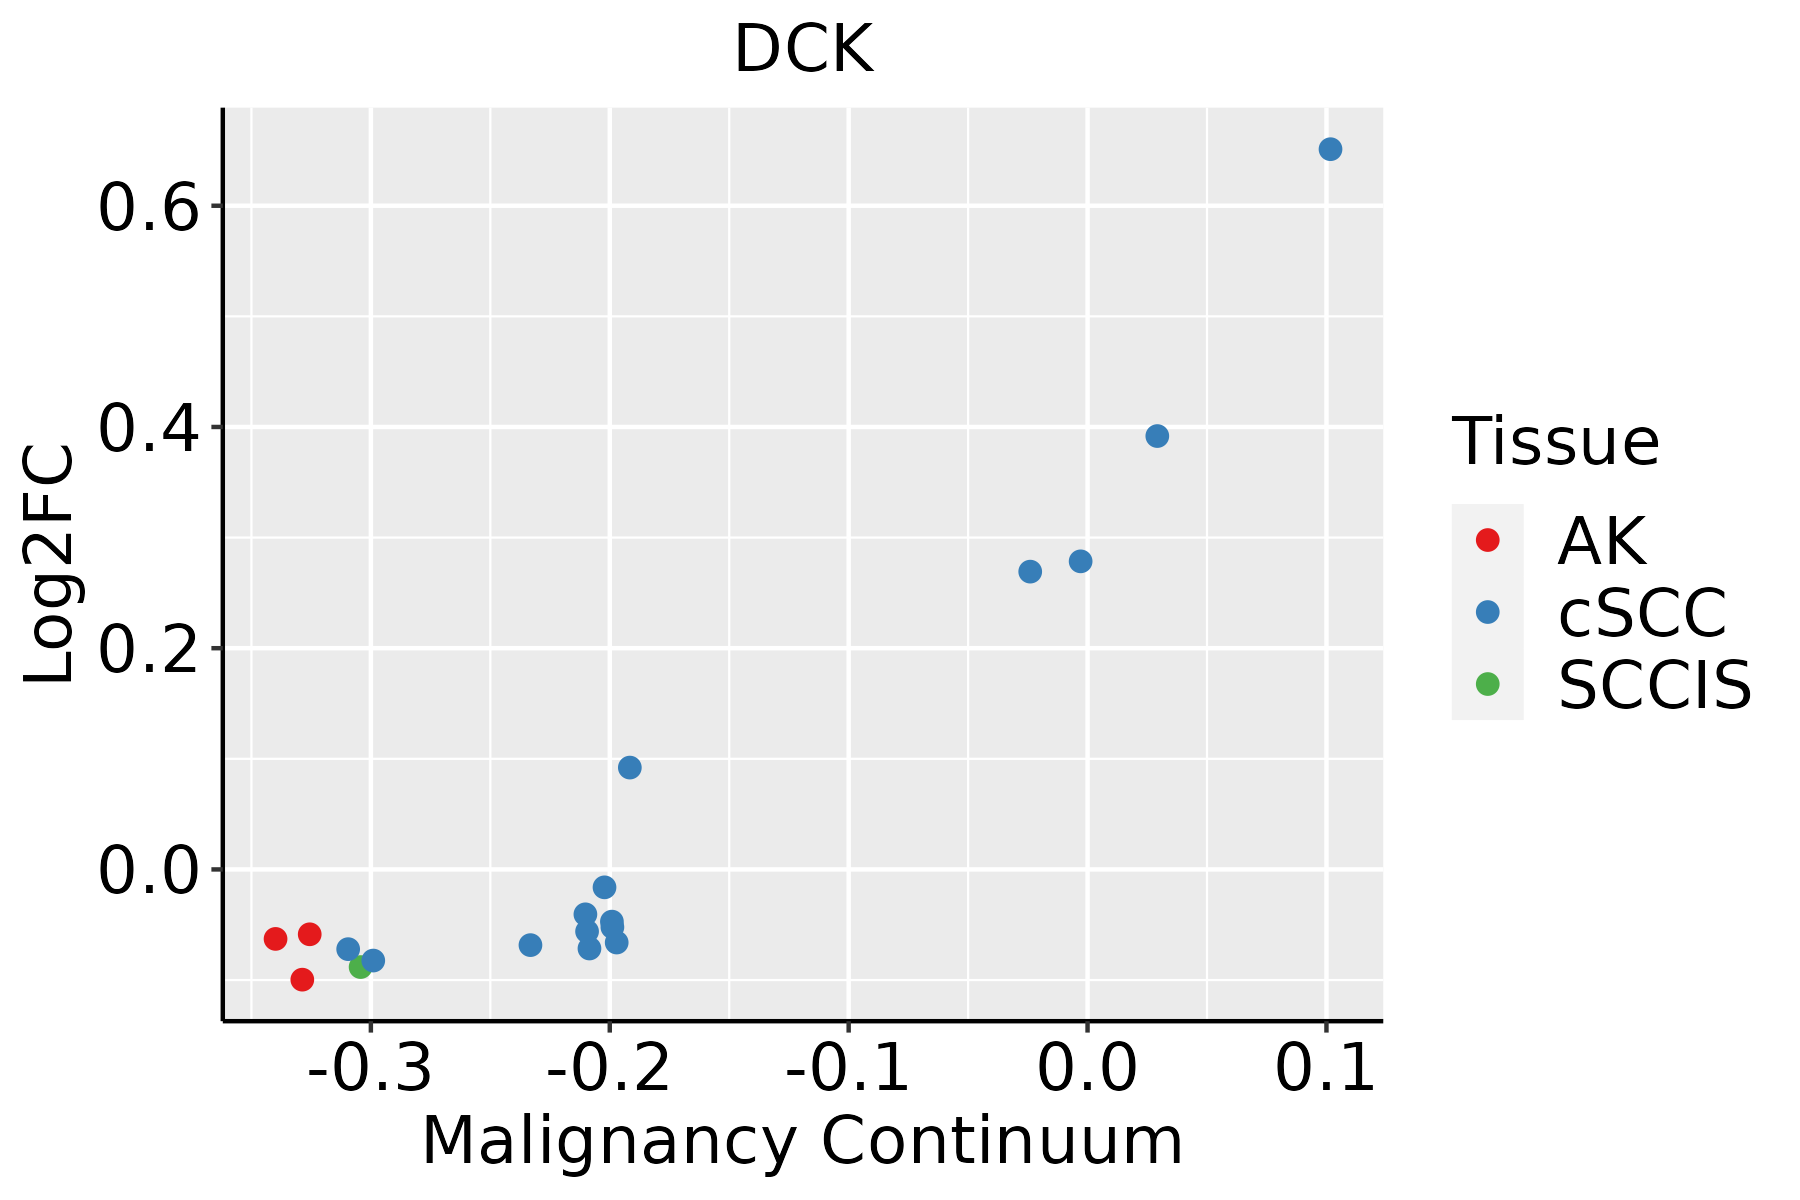 | AK: Actinic keratosis |
| cSCC: Cutaneous squamous cell carcinoma | ||
| SCCIS:squamous cell carcinoma in situ |
| ∗log2FC in expression of this searched gene in stem-like cells from each diseased tissue sample relative to stem-like cells in normal samples in each tissue plotted against the malignancy continuum. Samples are colored based on if they are from different disease stage. |
Top |
Malignant transformation related pathway analysis |
| Find out the enriched GO biological processes and KEGG pathways involved in transition from healthy to precancer to cancer |
| Tissue | Disease Stage | Enriched GO biological Processes |
| Colorectum | AD |  |
| Colorectum | SER |  |
| Colorectum | MSS |  |
| Colorectum | MSI-H |  |
| Colorectum | FAP |  |
| ∗Top 15 enriched GO BP terms are showed in the bar plot of each disease state in each tissue. Each row represents a significant GO biological process which is colored according to the -log10(p.adjust). |
| Page: 1 2 3 4 5 6 7 8 9 |
| GO ID | Tissue | Disease Stage | Description | Gene Ratio | Bg Ratio | pvalue | p.adjust | Count |
| GO:0006753110 | Esophagus | ESCC | nucleoside phosphate metabolic process | 288/8552 | 497/18723 | 1.80e-08 | 3.50e-07 | 288 |
| GO:0009117111 | Esophagus | ESCC | nucleotide metabolic process | 282/8552 | 489/18723 | 4.70e-08 | 8.50e-07 | 282 |
| GO:0072521111 | Esophagus | ESCC | purine-containing compound metabolic process | 238/8552 | 416/18723 | 1.20e-06 | 1.49e-05 | 238 |
| GO:0006163111 | Esophagus | ESCC | purine nucleotide metabolic process | 226/8552 | 396/18723 | 2.81e-06 | 3.21e-05 | 226 |
| GO:000916516 | Esophagus | ESCC | nucleotide biosynthetic process | 150/8552 | 254/18723 | 1.12e-05 | 1.06e-04 | 150 |
| GO:190129316 | Esophagus | ESCC | nucleoside phosphate biosynthetic process | 151/8552 | 256/18723 | 1.15e-05 | 1.08e-04 | 151 |
| GO:007252217 | Esophagus | ESCC | purine-containing compound biosynthetic process | 120/8552 | 200/18723 | 3.02e-05 | 2.51e-04 | 120 |
| GO:000616417 | Esophagus | ESCC | purine nucleotide biosynthetic process | 113/8552 | 191/18723 | 1.16e-04 | 8.04e-04 | 113 |
| GO:00062203 | Esophagus | ESCC | pyrimidine nucleotide metabolic process | 35/8552 | 50/18723 | 4.33e-04 | 2.44e-03 | 35 |
| GO:00091234 | Esophagus | ESCC | nucleoside monophosphate metabolic process | 49/8552 | 76/18723 | 7.30e-04 | 3.80e-03 | 49 |
| GO:000926212 | Esophagus | ESCC | deoxyribonucleotide metabolic process | 31/8552 | 44/18723 | 7.70e-04 | 3.99e-03 | 31 |
| GO:00725273 | Esophagus | ESCC | pyrimidine-containing compound metabolic process | 52/8552 | 82/18723 | 9.03e-04 | 4.61e-03 | 52 |
| GO:00092633 | Esophagus | ESCC | deoxyribonucleotide biosynthetic process | 13/8552 | 15/18723 | 1.31e-03 | 6.26e-03 | 13 |
| GO:00091243 | Esophagus | ESCC | nucleoside monophosphate biosynthetic process | 29/8552 | 42/18723 | 1.87e-03 | 8.46e-03 | 29 |
| GO:001969212 | Esophagus | ESCC | deoxyribose phosphate metabolic process | 29/8552 | 42/18723 | 1.87e-03 | 8.46e-03 | 29 |
| GO:00091269 | Esophagus | ESCC | purine nucleoside monophosphate metabolic process | 30/8552 | 44/18723 | 2.14e-03 | 9.54e-03 | 30 |
| GO:000939412 | Esophagus | ESCC | 2'-deoxyribonucleotide metabolic process | 27/8552 | 40/18723 | 4.39e-03 | 1.73e-02 | 27 |
| GO:00092653 | Esophagus | ESCC | 2'-deoxyribonucleotide biosynthetic process | 10/8552 | 12/18723 | 8.94e-03 | 3.12e-02 | 10 |
| GO:00463853 | Esophagus | ESCC | deoxyribose phosphate biosynthetic process | 10/8552 | 12/18723 | 8.94e-03 | 3.12e-02 | 10 |
| GO:00091273 | Esophagus | ESCC | purine nucleoside monophosphate biosynthetic process | 15/8552 | 21/18723 | 1.54e-02 | 4.96e-02 | 15 |
| Page: 1 2 3 4 |
| Pathway ID | Tissue | Disease Stage | Description | Gene Ratio | Bg Ratio | pvalue | p.adjust | qvalue | Count |
| hsa012325 | Esophagus | ESCC | Nucleotide metabolism | 59/4205 | 85/8465 | 1.67e-04 | 6.58e-04 | 3.37e-04 | 59 |
| hsa002405 | Esophagus | ESCC | Pyrimidine metabolism | 41/4205 | 58/8465 | 9.14e-04 | 2.92e-03 | 1.49e-03 | 41 |
| hsa0123212 | Esophagus | ESCC | Nucleotide metabolism | 59/4205 | 85/8465 | 1.67e-04 | 6.58e-04 | 3.37e-04 | 59 |
| hsa0024012 | Esophagus | ESCC | Pyrimidine metabolism | 41/4205 | 58/8465 | 9.14e-04 | 2.92e-03 | 1.49e-03 | 41 |
| hsa012324 | Oral cavity | OSCC | Nucleotide metabolism | 54/3704 | 85/8465 | 1.78e-04 | 5.95e-04 | 3.03e-04 | 54 |
| hsa002404 | Oral cavity | OSCC | Pyrimidine metabolism | 37/3704 | 58/8465 | 1.62e-03 | 4.45e-03 | 2.26e-03 | 37 |
| hsa0123211 | Oral cavity | OSCC | Nucleotide metabolism | 54/3704 | 85/8465 | 1.78e-04 | 5.95e-04 | 3.03e-04 | 54 |
| hsa0024011 | Oral cavity | OSCC | Pyrimidine metabolism | 37/3704 | 58/8465 | 1.62e-03 | 4.45e-03 | 2.26e-03 | 37 |
| hsa0123221 | Oral cavity | LP | Nucleotide metabolism | 42/2418 | 85/8465 | 3.62e-05 | 2.36e-04 | 1.52e-04 | 42 |
| hsa0024021 | Oral cavity | LP | Pyrimidine metabolism | 28/2418 | 58/8465 | 1.12e-03 | 5.02e-03 | 3.24e-03 | 28 |
| hsa0123231 | Oral cavity | LP | Nucleotide metabolism | 42/2418 | 85/8465 | 3.62e-05 | 2.36e-04 | 1.52e-04 | 42 |
| hsa0024031 | Oral cavity | LP | Pyrimidine metabolism | 28/2418 | 58/8465 | 1.12e-03 | 5.02e-03 | 3.24e-03 | 28 |
| Page: 1 |
Top |
Cell-cell communication analysis |
| Identification of potential cell-cell interactions between two cell types and their ligand-receptor pairs for different disease states |
| Ligand | Receptor | LRpair | Pathway | Tissue | Disease Stage |
| Page: 1 |
Top |
Single-cell gene regulatory network inference analysis |
| Find out the significant the regulons (TFs) and the target genes of each regulon across cell types for different disease states |
| TF | Cell Type | Tissue | Disease Stage | Target Gene | RSS | Regulon Activity |
| ∗The dot plots of a searched regulon are shown for all cell subpopulations in each disease state of each tissue based on the regulon specific score inferred using pySCENIC and by calculating the average expression. |
| Page: 1 |
Top |
Somatic mutation of malignant transformation related genes |
| Annotation of somatic variants for genes involved in malignant transformation |
| Hugo Symbol | Variant Class | Variant Classification | dbSNP RS | HGVSc | HGVSp | HGVSp Short | SWISSPROT | BIOTYPE | SIFT | PolyPhen | Tumor Sample Barcode | Tissue | Histology | Sex | Age | Stage | Therapy Types | Drugs | Outcome |
| DCK | SNV | Missense_Mutation | c.51G>T | p.Glu17Asp | p.E17D | P27707 | protein_coding | tolerated(0.62) | benign(0.021) | TCGA-A8-A09Z-01 | Breast | breast invasive carcinoma | Female | >=65 | I/II | Unknown | Unknown | SD | |
| DCK | SNV | Missense_Mutation | novel | c.730N>T | p.Asp244Tyr | p.D244Y | P27707 | protein_coding | deleterious(0) | benign(0.026) | TCGA-XX-A899-01 | Breast | breast invasive carcinoma | Female | <65 | III/IV | Chemotherapy | cytoxan | CR |
| DCK | SNV | Missense_Mutation | novel | c.415N>C | p.Ser139Pro | p.S139P | P27707 | protein_coding | tolerated(0.13) | possibly_damaging(0.773) | TCGA-EA-A410-01 | Cervix | cervical & endocervical cancer | Female | <65 | I/II | Unknown | Unknown | SD |
| DCK | SNV | Missense_Mutation | c.667N>G | p.Thr223Ala | p.T223A | P27707 | protein_coding | tolerated(0.05) | benign(0.101) | TCGA-AA-3715-01 | Colorectum | colon adenocarcinoma | Male | >=65 | I/II | Unknown | Unknown | PD | |
| DCK | SNV | Missense_Mutation | novel | c.623N>G | p.Leu208Arg | p.L208R | P27707 | protein_coding | deleterious(0) | probably_damaging(0.985) | TCGA-AZ-4315-01 | Colorectum | colon adenocarcinoma | Male | <65 | I/II | Unknown | Unknown | SD |
| DCK | SNV | Missense_Mutation | novel | c.491N>C | p.Asn164Thr | p.N164T | P27707 | protein_coding | tolerated(0.15) | benign(0.003) | TCGA-A5-A0G5-01 | Endometrium | uterine corpus endometrioid carcinoma | Female | >=65 | I/II | Unknown | Unknown | SD |
| DCK | SNV | Missense_Mutation | novel | c.508N>A | p.Leu170Ile | p.L170I | P27707 | protein_coding | tolerated(0.48) | benign(0.198) | TCGA-A5-A1OF-01 | Endometrium | uterine corpus endometrioid carcinoma | Female | <65 | I/II | Unknown | Unknown | SD |
| DCK | SNV | Missense_Mutation | c.268N>A | p.Glu90Lys | p.E90K | P27707 | protein_coding | tolerated(0.57) | benign(0.019) | TCGA-AP-A059-01 | Endometrium | uterine corpus endometrioid carcinoma | Female | >=65 | I/II | Unknown | Unknown | SD | |
| DCK | SNV | Missense_Mutation | novel | c.196N>T | p.Asp66Tyr | p.D66Y | P27707 | protein_coding | deleterious(0.01) | possibly_damaging(0.656) | TCGA-AP-A1DV-01 | Endometrium | uterine corpus endometrioid carcinoma | Female | <65 | I/II | Unknown | Unknown | SD |
| DCK | SNV | Missense_Mutation | c.307N>G | p.Ser103Gly | p.S103G | P27707 | protein_coding | deleterious(0.03) | probably_damaging(1) | TCGA-BS-A0TA-01 | Endometrium | uterine corpus endometrioid carcinoma | Female | <65 | III/IV | Chemotherapy | taxol | PD |
| Page: 1 2 |
Top |
Related drugs of malignant transformation related genes |
| Identification of chemicals and drugs interact with genes involved in malignant transfromation |
| (DGIdb 4.0) |
| Entrez ID | Symbol | Category | Interaction Types | Drug Claim Name | Drug Name | PMIDs |
| 1633 | DCK | DRUGGABLE GENOME, ENZYME, KINASE | idarubicin | IDARUBICIN | 15564883 | |
| 1633 | DCK | DRUGGABLE GENOME, ENZYME, KINASE | lamivudine | LAMIVUDINE | ||
| 1633 | DCK | DRUGGABLE GENOME, ENZYME, KINASE | DEOXYCYTIDINE | DEOXYCYTIDINE | 10471381,11952160 | |
| 1633 | DCK | DRUGGABLE GENOME, ENZYME, KINASE | TETRAHYDROURIDINE | TETRAHYDROURIDINE | 17296311 | |
| 1633 | DCK | DRUGGABLE GENOME, ENZYME, KINASE | daunorubicin | DAUNORUBICIN | 25119182 | |
| 1633 | DCK | DRUGGABLE GENOME, ENZYME, KINASE | CAMPTOTHECIN | CAMPTOTHECIN | 14973057 | |
| 1633 | DCK | DRUGGABLE GENOME, ENZYME, KINASE | FLUDARABINE | FLUDARABINE | ||
| 1633 | DCK | DRUGGABLE GENOME, ENZYME, KINASE | 2,3-DIDEOXYADENOSINE | 3262616 | ||
| 1633 | DCK | DRUGGABLE GENOME, ENZYME, KINASE | cytarabine | CYTARABINE | 15564883 | |
| 1633 | DCK | DRUGGABLE GENOME, ENZYME, KINASE | FMDC | TEZACITABINE | 10961690 |
| Page: 1 2 |

Copyright 2023-Present -The University of Texas Health Science Center at Houston |