| GO ID | Tissue | Disease Stage | Description | Gene Ratio | Bg Ratio | pvalue | p.adjust | Count |
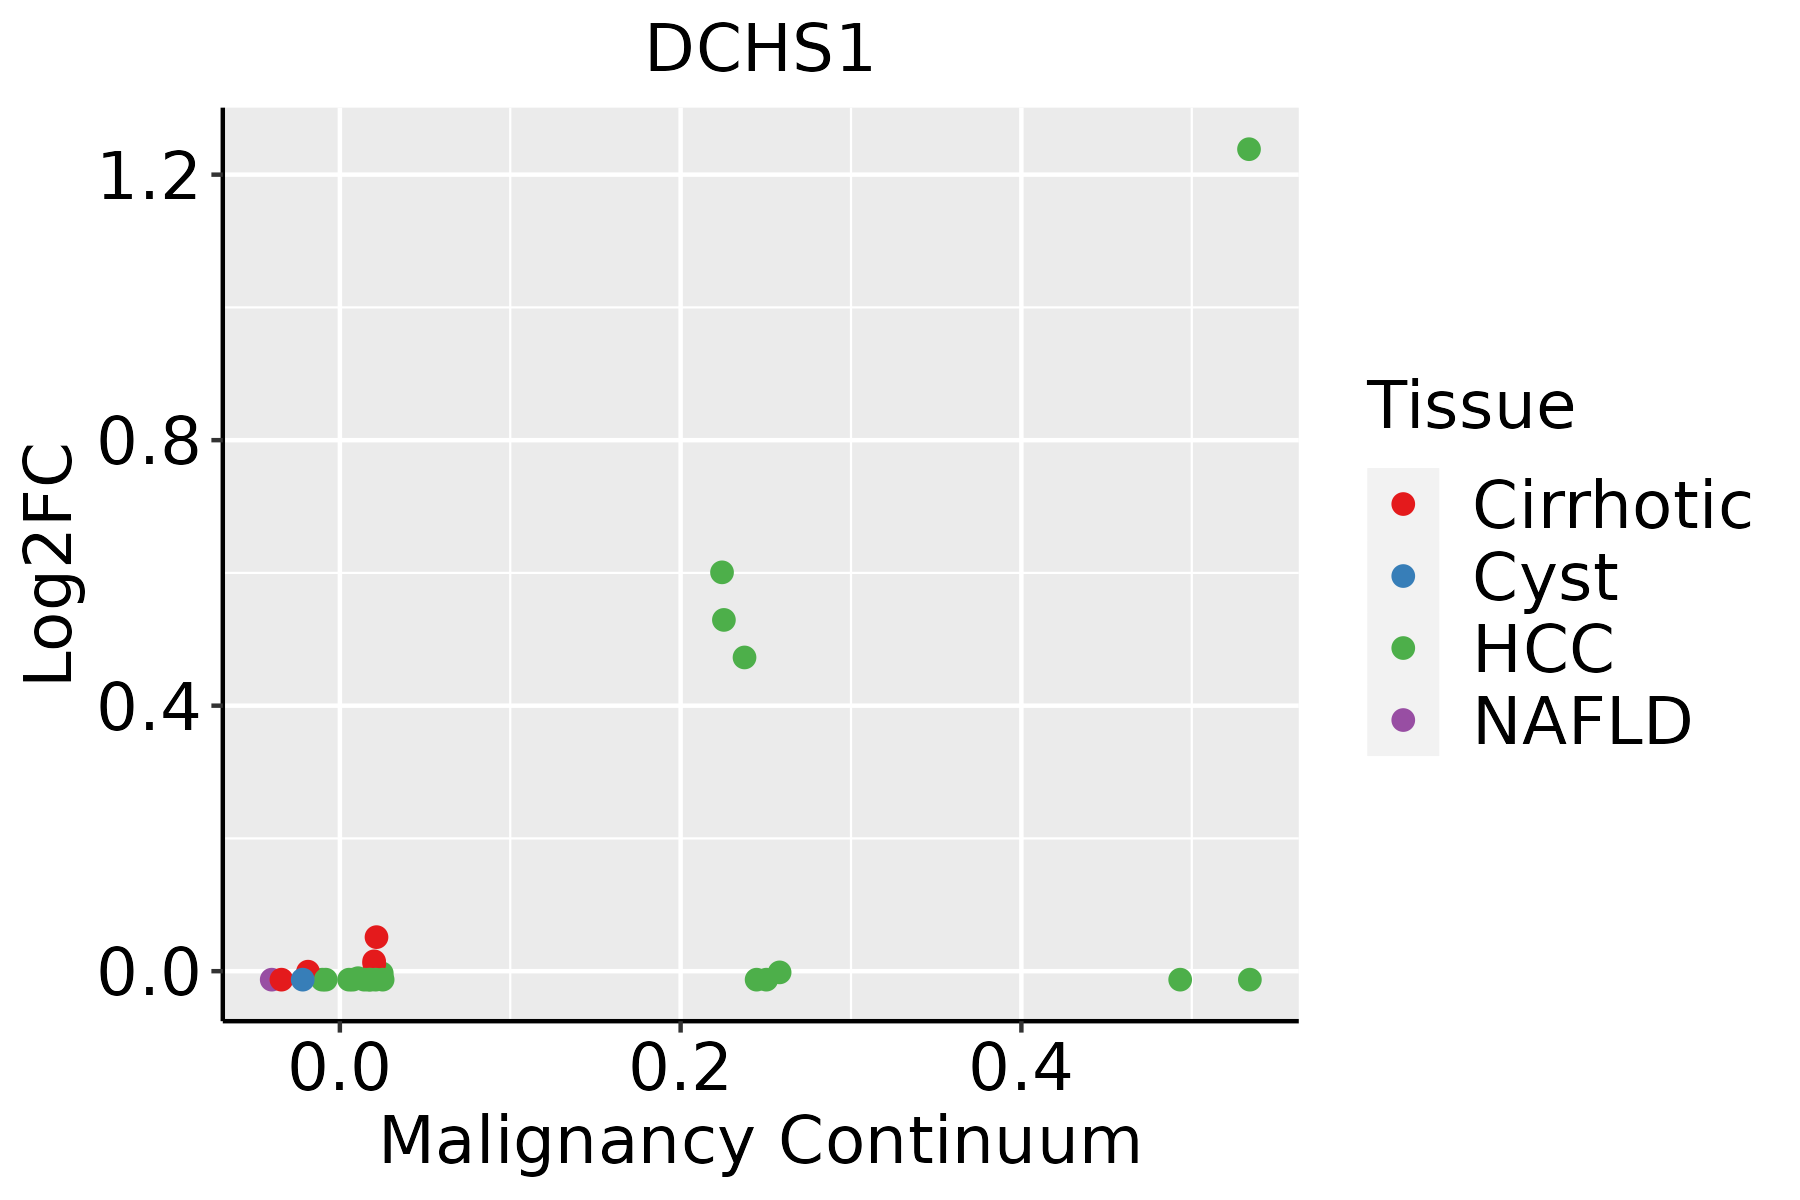
| GO:007265921 | Liver | HCC | protein localization to plasma membrane | 177/7958 | 284/18723 | 1.02e-11 | 4.18e-10 | 177 |
| GO:199077821 | Liver | HCC | protein localization to cell periphery | 200/7958 | 333/18723 | 6.07e-11 | 2.23e-09 | 200 |
| GO:004521622 | Liver | HCC | cell-cell junction organization | 107/7958 | 200/18723 | 1.06e-03 | 6.11e-03 | 107 |
| GO:00016553 | Liver | HCC | urogenital system development | 170/7958 | 338/18723 | 2.15e-03 | 1.08e-02 | 170 |
| GO:00219154 | Liver | HCC | neural tube development | 82/7958 | 152/18723 | 2.83e-03 | 1.33e-02 | 82 |
| GO:00018222 | Liver | HCC | kidney development | 148/7958 | 293/18723 | 3.25e-03 | 1.49e-02 | 148 |
| GO:00720012 | Liver | HCC | renal system development | 152/7958 | 302/18723 | 3.45e-03 | 1.56e-02 | 152 |
| GO:003433211 | Liver | HCC | adherens junction organization | 30/7958 | 49/18723 | 6.31e-03 | 2.57e-02 | 30 |
| GO:000704312 | Liver | HCC | cell-cell junction assembly | 76/7958 | 146/18723 | 1.23e-02 | 4.47e-02 | 76 |
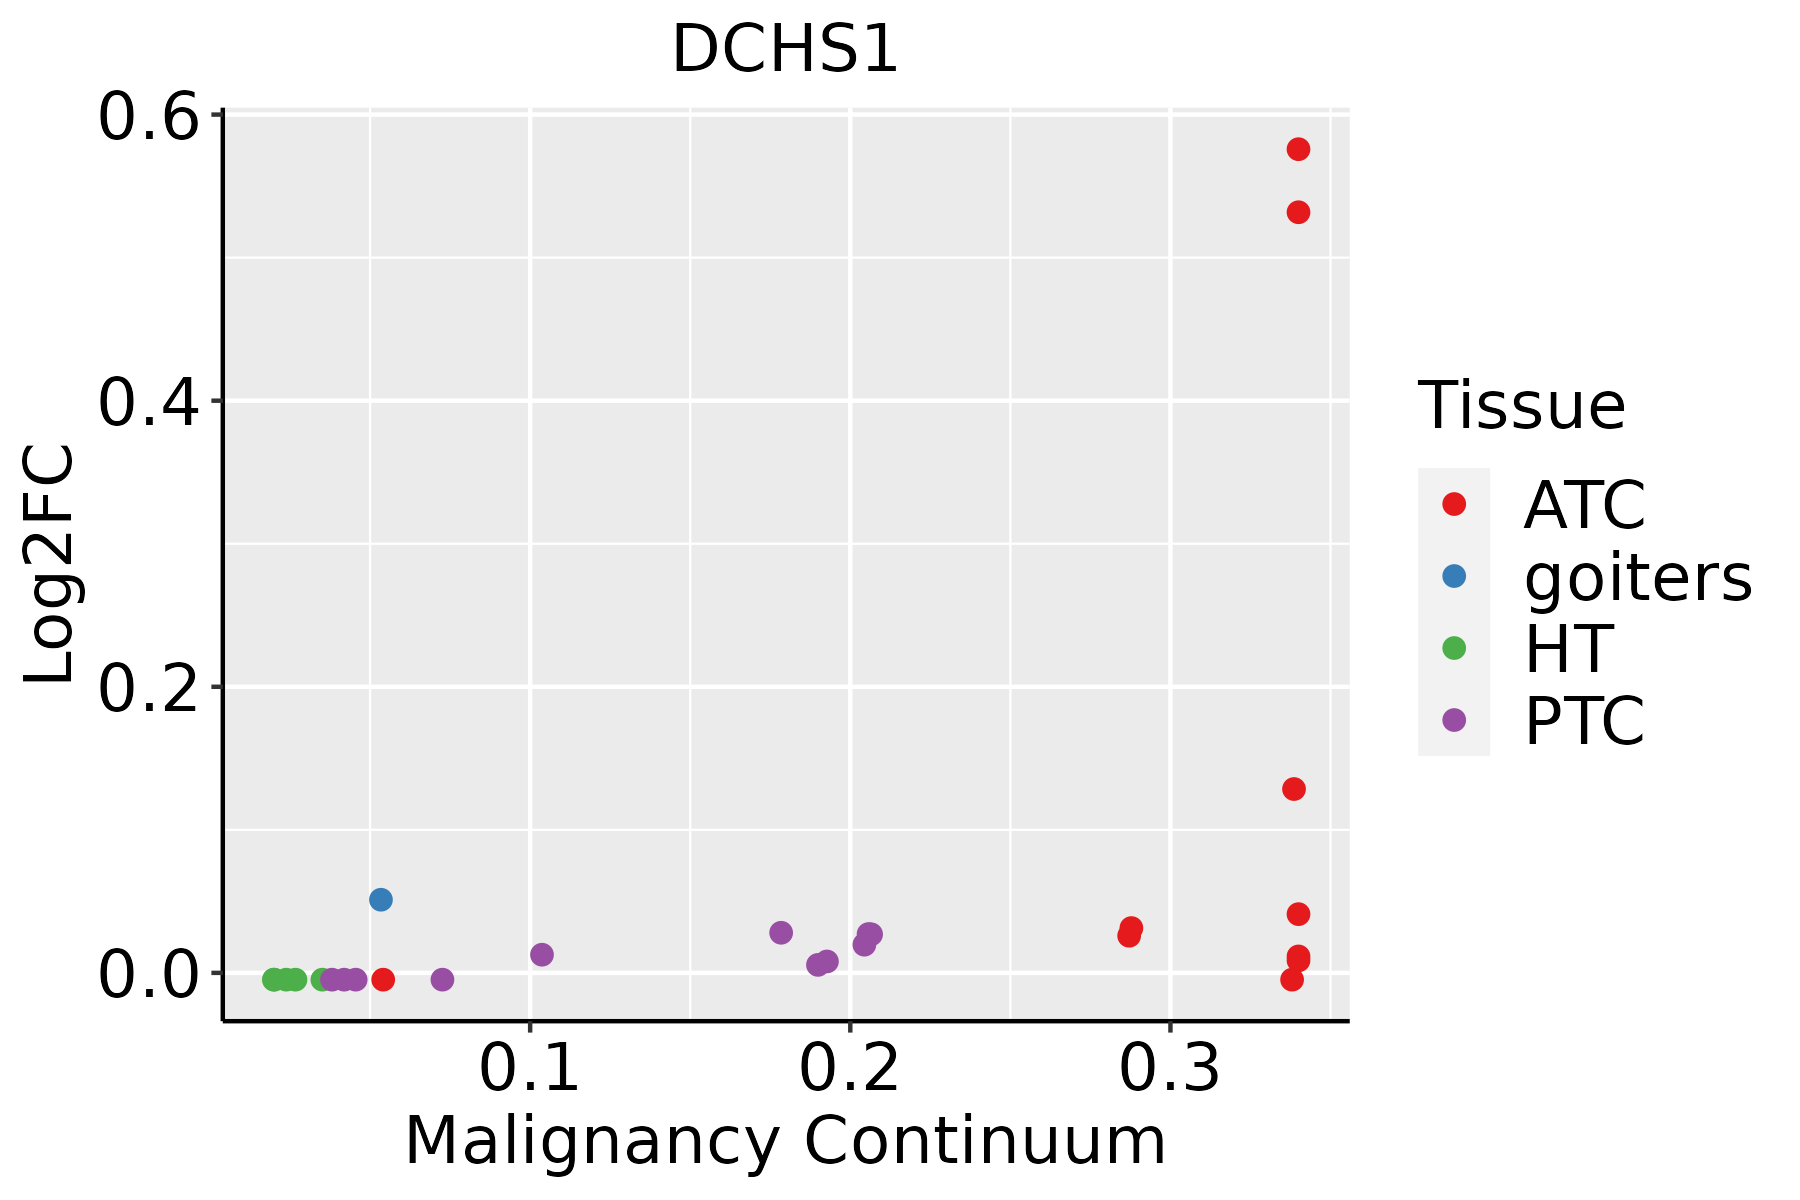
| GO:007265928 | Thyroid | ATC | protein localization to plasma membrane | 161/6293 | 284/18723 | 8.45e-16 | 6.52e-14 | 161 |
| GO:199077826 | Thyroid | ATC | protein localization to cell periphery | 181/6293 | 333/18723 | 3.72e-15 | 2.56e-13 | 181 |
| GO:000150332 | Thyroid | ATC | ossification | 206/6293 | 408/18723 | 9.23e-13 | 3.95e-11 | 206 |
| GO:000182222 | Thyroid | ATC | kidney development | 146/6293 | 293/18723 | 5.81e-09 | 1.28e-07 | 146 |
| GO:000165522 | Thyroid | ATC | urogenital system development | 164/6293 | 338/18723 | 7.92e-09 | 1.70e-07 | 164 |
| GO:007200122 | Thyroid | ATC | renal system development | 149/6293 | 302/18723 | 9.48e-09 | 1.99e-07 | 149 |
| GO:006056222 | Thyroid | ATC | epithelial tube morphogenesis | 156/6293 | 325/18723 | 4.48e-08 | 8.14e-07 | 156 |
| GO:002191515 | Thyroid | ATC | neural tube development | 80/6293 | 152/18723 | 9.87e-07 | 1.29e-05 | 80 |
| GO:006034813 | Thyroid | ATC | bone development | 102/6293 | 205/18723 | 1.18e-06 | 1.52e-05 | 102 |
| GO:003432924 | Thyroid | ATC | cell junction assembly | 187/6293 | 420/18723 | 1.71e-06 | 2.08e-05 | 187 |
| GO:006048521 | Thyroid | ATC | mesenchyme development | 136/6293 | 291/18723 | 2.04e-06 | 2.43e-05 | 136 |
| Hugo Symbol | Variant Class | Variant Classification | dbSNP RS | HGVSc | HGVSp | HGVSp Short | SWISSPROT | BIOTYPE | SIFT | PolyPhen | Tumor Sample Barcode | Tissue | Histology | Sex | Age | Stage | Therapy Types | Drugs | Outcome |
| DCHS1 | SNV | Missense_Mutation | novel | c.3082N>A | p.Asp1028Asn | p.D1028N | Q96JQ0 | protein_coding | tolerated(0.17) | probably_damaging(0.995) | TCGA-5L-AAT1-01 | Breast | breast invasive carcinoma | Female | <65 | III/IV | Hormone Therapy | letrozol | SD |
| DCHS1 | SNV | Missense_Mutation | novel | c.328N>A | p.Glu110Lys | p.E110K | Q96JQ0 | protein_coding | deleterious(0) | probably_damaging(0.977) | TCGA-5L-AAT1-01 | Breast | breast invasive carcinoma | Female | <65 | III/IV | Hormone Therapy | letrozol | SD |
| DCHS1 | SNV | Missense_Mutation | rs747724857 | c.2935A>C | p.Thr979Pro | p.T979P | Q96JQ0 | protein_coding | deleterious(0.02) | possibly_damaging(0.451) | TCGA-A1-A0SI-01 | Breast | breast invasive carcinoma | Female | <65 | I/II | Unknown | Unknown | SD |
| DCHS1 | SNV | Missense_Mutation | novel | c.569N>A | p.Thr190Asn | p.T190N | Q96JQ0 | protein_coding | deleterious(0.02) | probably_damaging(0.967) | TCGA-A2-A0D1-01 | Breast | breast invasive carcinoma | Female | >=65 | I/II | Chemotherapy | taxotere | SD |
| DCHS1 | SNV | Missense_Mutation | rs200322732 | c.6989N>A | p.Arg2330His | p.R2330H | Q96JQ0 | protein_coding | tolerated(0.22) | benign(0.139) | TCGA-A7-A13H-01 | Breast | breast invasive carcinoma | Female | <65 | I/II | Hormone Therapy | anastrozole | PD |
| DCHS1 | SNV | Missense_Mutation | rs540343475 | c.7489N>T | p.Pro2497Ser | p.P2497S | Q96JQ0 | protein_coding | deleterious(0.04) | possibly_damaging(0.894) | TCGA-A8-A08B-01 | Breast | breast invasive carcinoma | Female | <65 | I/II | Chemotherapy | 5-fluorouracil | CR |
| DCHS1 | SNV | Missense_Mutation | novel | c.6920C>T | p.Pro2307Leu | p.P2307L | Q96JQ0 | protein_coding | deleterious(0) | possibly_damaging(0.71) | TCGA-A8-A09E-01 | Breast | breast invasive carcinoma | Female | >=65 | III/IV | Hormone Therapy | anastrozole | SD |
| DCHS1 | SNV | Missense_Mutation | | c.5387N>A | p.Gly1796Glu | p.G1796E | Q96JQ0 | protein_coding | tolerated(0.22) | benign(0.037) | TCGA-A8-A09Z-01 | Breast | breast invasive carcinoma | Female | >=65 | I/II | Unknown | Unknown | SD |
| DCHS1 | SNV | Missense_Mutation | | c.3679N>T | p.Pro1227Ser | p.P1227S | Q96JQ0 | protein_coding | tolerated(0.48) | benign(0.136) | TCGA-A8-A09Z-01 | Breast | breast invasive carcinoma | Female | >=65 | I/II | Unknown | Unknown | SD |
| DCHS1 | SNV | Missense_Mutation | rs761187405 | c.1258N>A | p.Val420Ile | p.V420I | Q96JQ0 | protein_coding | tolerated(1) | benign(0.026) | TCGA-AC-A8OP-01 | Breast | breast invasive carcinoma | Female | >=65 | I/II | Unknown | Unknown | SD |