
|
|||||
|
 | |
| |
| |
| |
| |
| |
|
Gene: DCDC2 |
Gene summary for DCDC2 |
| Gene information | Species | Human | Gene symbol | DCDC2 | Gene ID | 51473 |
| Gene name | doublecortin domain containing 2 | |
| Gene Alias | DCDC2A | |
| Cytomap | 6p22.3 | |
| Gene Type | protein-coding | GO ID | GO:0000902 | UniProtAcc | Q9UHG0 |
Top |
Malignant transformation analysis |
| Identification of the aberrant gene expression in precancerous and cancerous lesions by comparing the gene expression of stem-like cells in diseased tissues with normal stem cells |
| Entrez ID | Symbol | Replicates | Species | Organ | Tissue | Adj P-value | Log2FC | Malignancy |
| 51473 | DCDC2 | AEH-subject1 | Human | Endometrium | AEH | 5.35e-37 | 8.42e-01 | -0.3059 |
| 51473 | DCDC2 | AEH-subject2 | Human | Endometrium | AEH | 3.83e-09 | 4.18e-01 | -0.2525 |
| 51473 | DCDC2 | AEH-subject3 | Human | Endometrium | AEH | 1.77e-32 | 8.72e-01 | -0.2576 |
| 51473 | DCDC2 | AEH-subject4 | Human | Endometrium | AEH | 2.37e-36 | 9.80e-01 | -0.2657 |
| 51473 | DCDC2 | AEH-subject5 | Human | Endometrium | AEH | 1.82e-03 | 3.67e-01 | -0.2953 |
| 51473 | DCDC2 | EEC-subject1 | Human | Endometrium | EEC | 9.77e-07 | 4.54e-01 | -0.2682 |
| 51473 | DCDC2 | EEC-subject2 | Human | Endometrium | EEC | 2.75e-28 | 7.58e-01 | -0.2607 |
| 51473 | DCDC2 | EEC-subject4 | Human | Endometrium | EEC | 2.53e-02 | 2.58e-01 | -0.2571 |
| 51473 | DCDC2 | EEC-subject5 | Human | Endometrium | EEC | 1.66e-04 | 3.70e-01 | -0.249 |
| 51473 | DCDC2 | GSM6177620_NYU_UCEC1_lib1_lib1 | Human | Endometrium | EEC | 5.20e-03 | -4.06e-02 | -0.1869 |
| 51473 | DCDC2 | GSM6177621_NYU_UCEC2_lib1_lib1 | Human | Endometrium | EEC | 2.18e-07 | -3.68e-02 | -0.1934 |
| 51473 | DCDC2 | GSM6177622_NYU_UCEC3_lib1_lib1 | Human | Endometrium | EEC | 9.20e-17 | 2.61e-01 | -0.1917 |
| 51473 | DCDC2 | GSM6177622_NYU_UCEC3_lib2_lib2 | Human | Endometrium | EEC | 3.51e-08 | 2.18e-01 | -0.1916 |
| 51473 | DCDC2 | GSM6177623_NYU_UCEC3_Vis | Human | Endometrium | EEC | 3.06e-03 | 3.17e-01 | -0.1269 |
| 51473 | DCDC2 | S43 | Human | Liver | Cirrhotic | 1.73e-13 | -2.66e-01 | -0.0187 |
| 51473 | DCDC2 | HCC1_Meng | Human | Liver | HCC | 3.29e-42 | -3.80e-01 | 0.0246 |
| 51473 | DCDC2 | HCC2_Meng | Human | Liver | HCC | 1.24e-15 | -4.16e-01 | 0.0107 |
| 51473 | DCDC2 | cirrhotic1 | Human | Liver | Cirrhotic | 1.37e-27 | 5.55e-01 | 0.0202 |
| 51473 | DCDC2 | cirrhotic2 | Human | Liver | Cirrhotic | 7.39e-32 | 5.50e-01 | 0.0201 |
| 51473 | DCDC2 | cirrhotic3 | Human | Liver | Cirrhotic | 7.62e-08 | 1.69e-01 | 0.0215 |
| Page: 1 2 3 |
| Tissue | Expression Dynamics | Abbreviation |
| Endometrium | 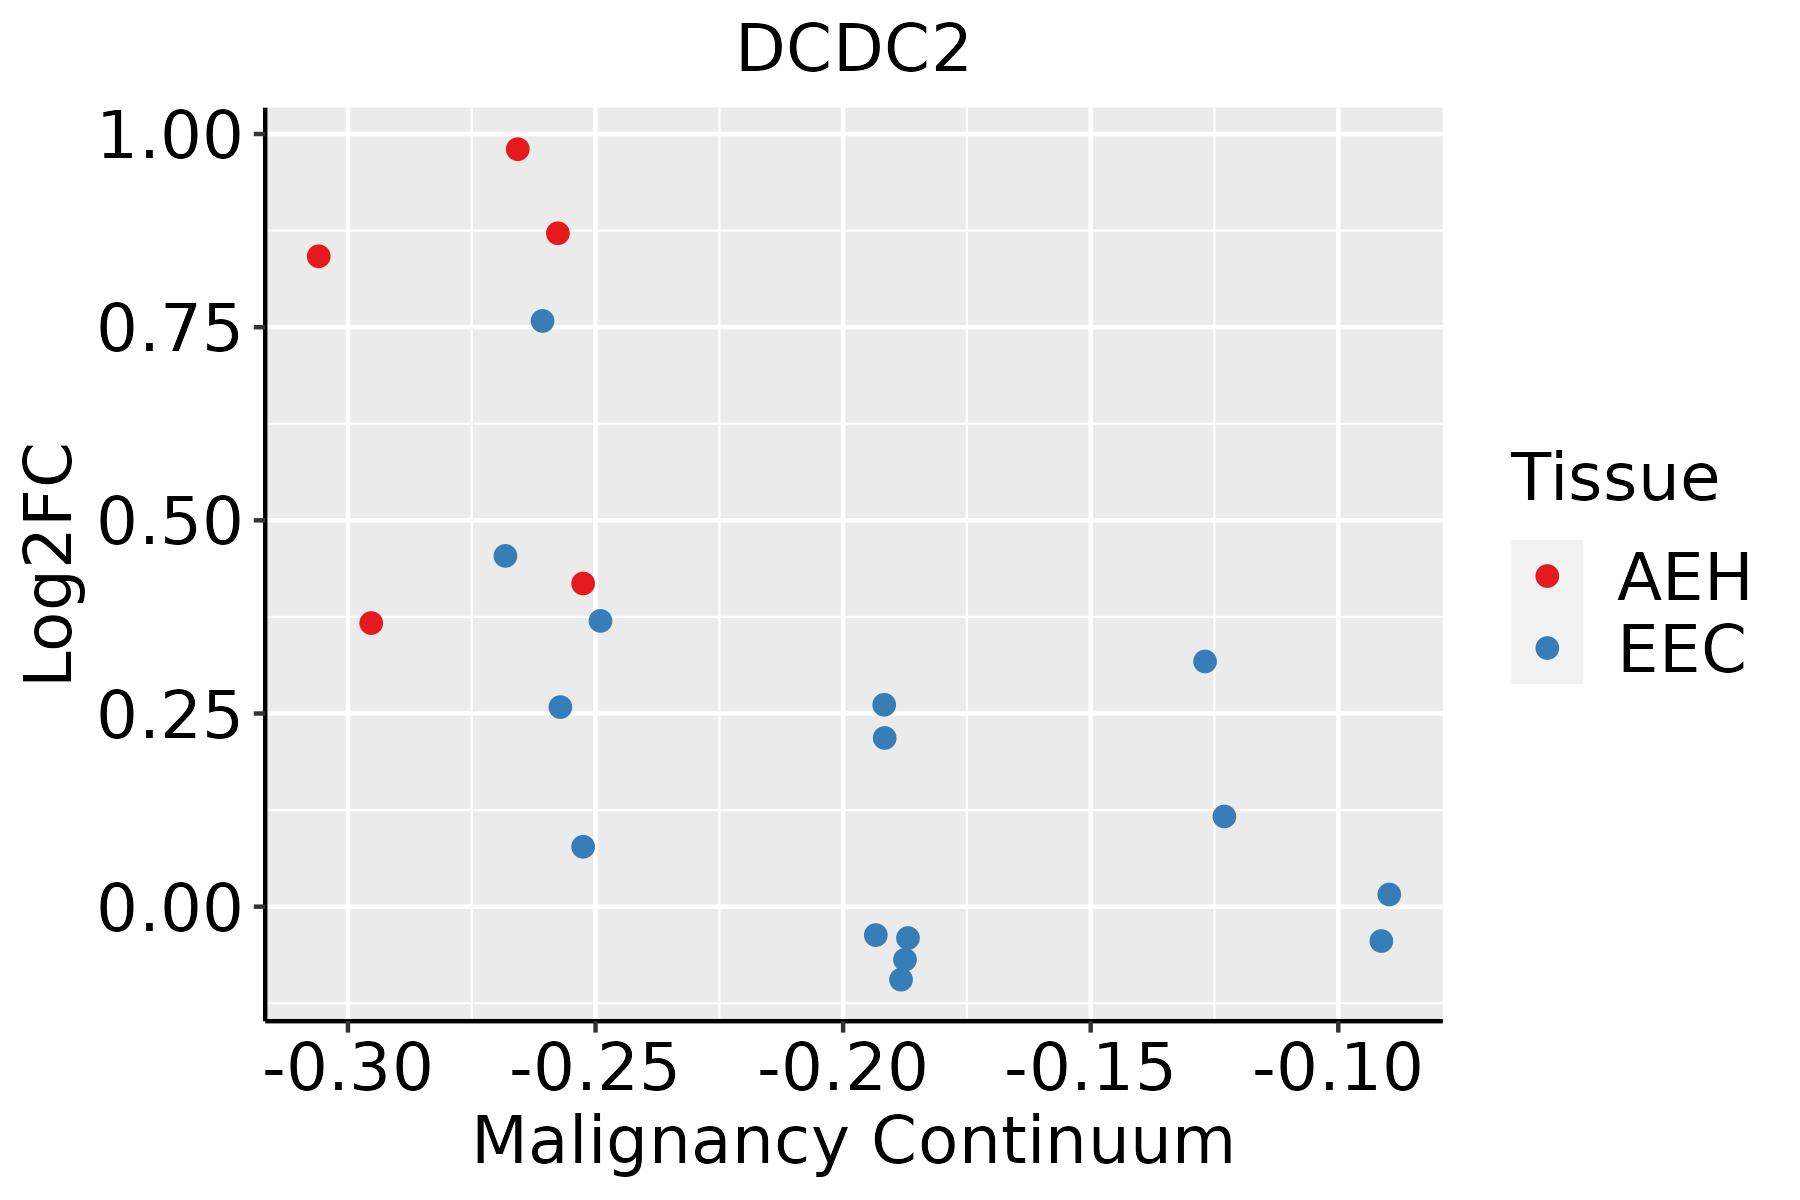 | AEH: Atypical endometrial hyperplasia |
| EEC: Endometrioid Cancer | ||
| Liver | 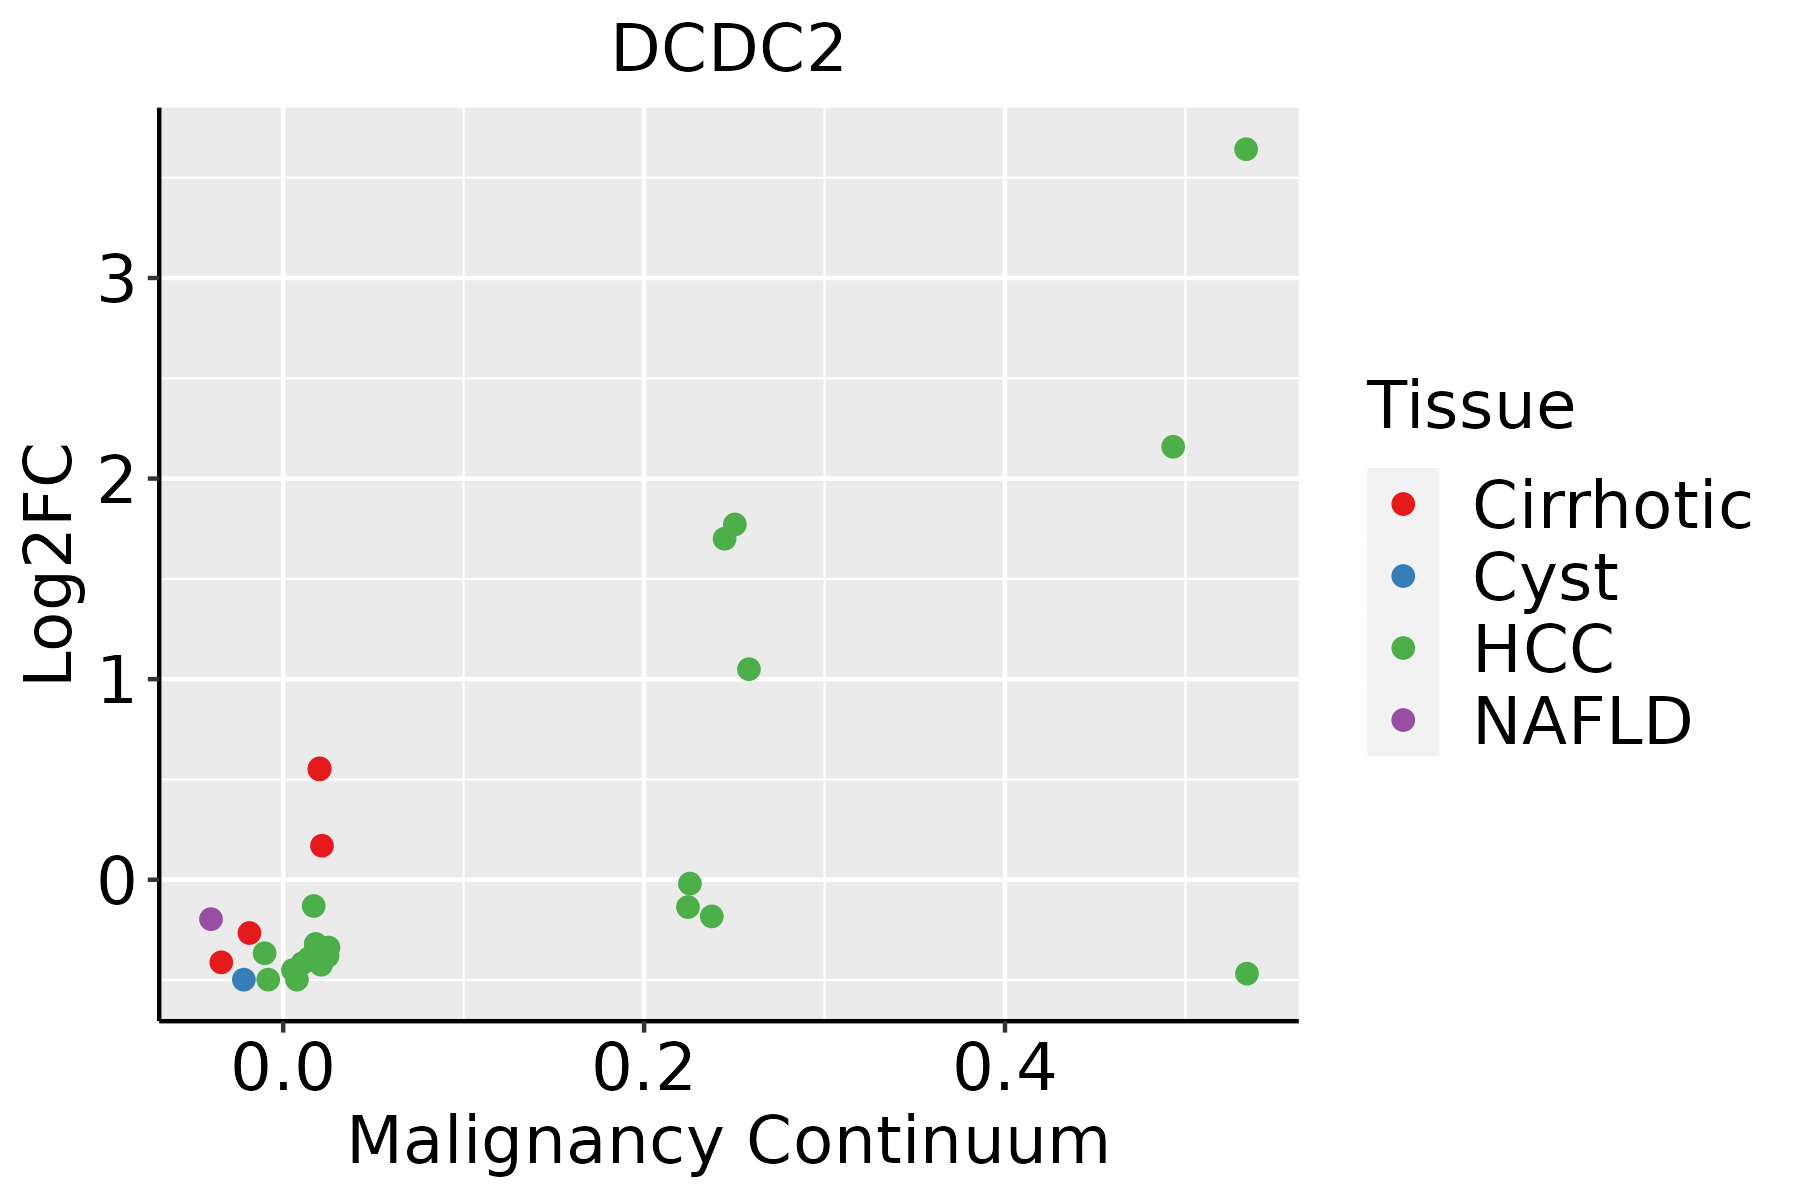 | HCC: Hepatocellular carcinoma |
| NAFLD: Non-alcoholic fatty liver disease | ||
| Lung | 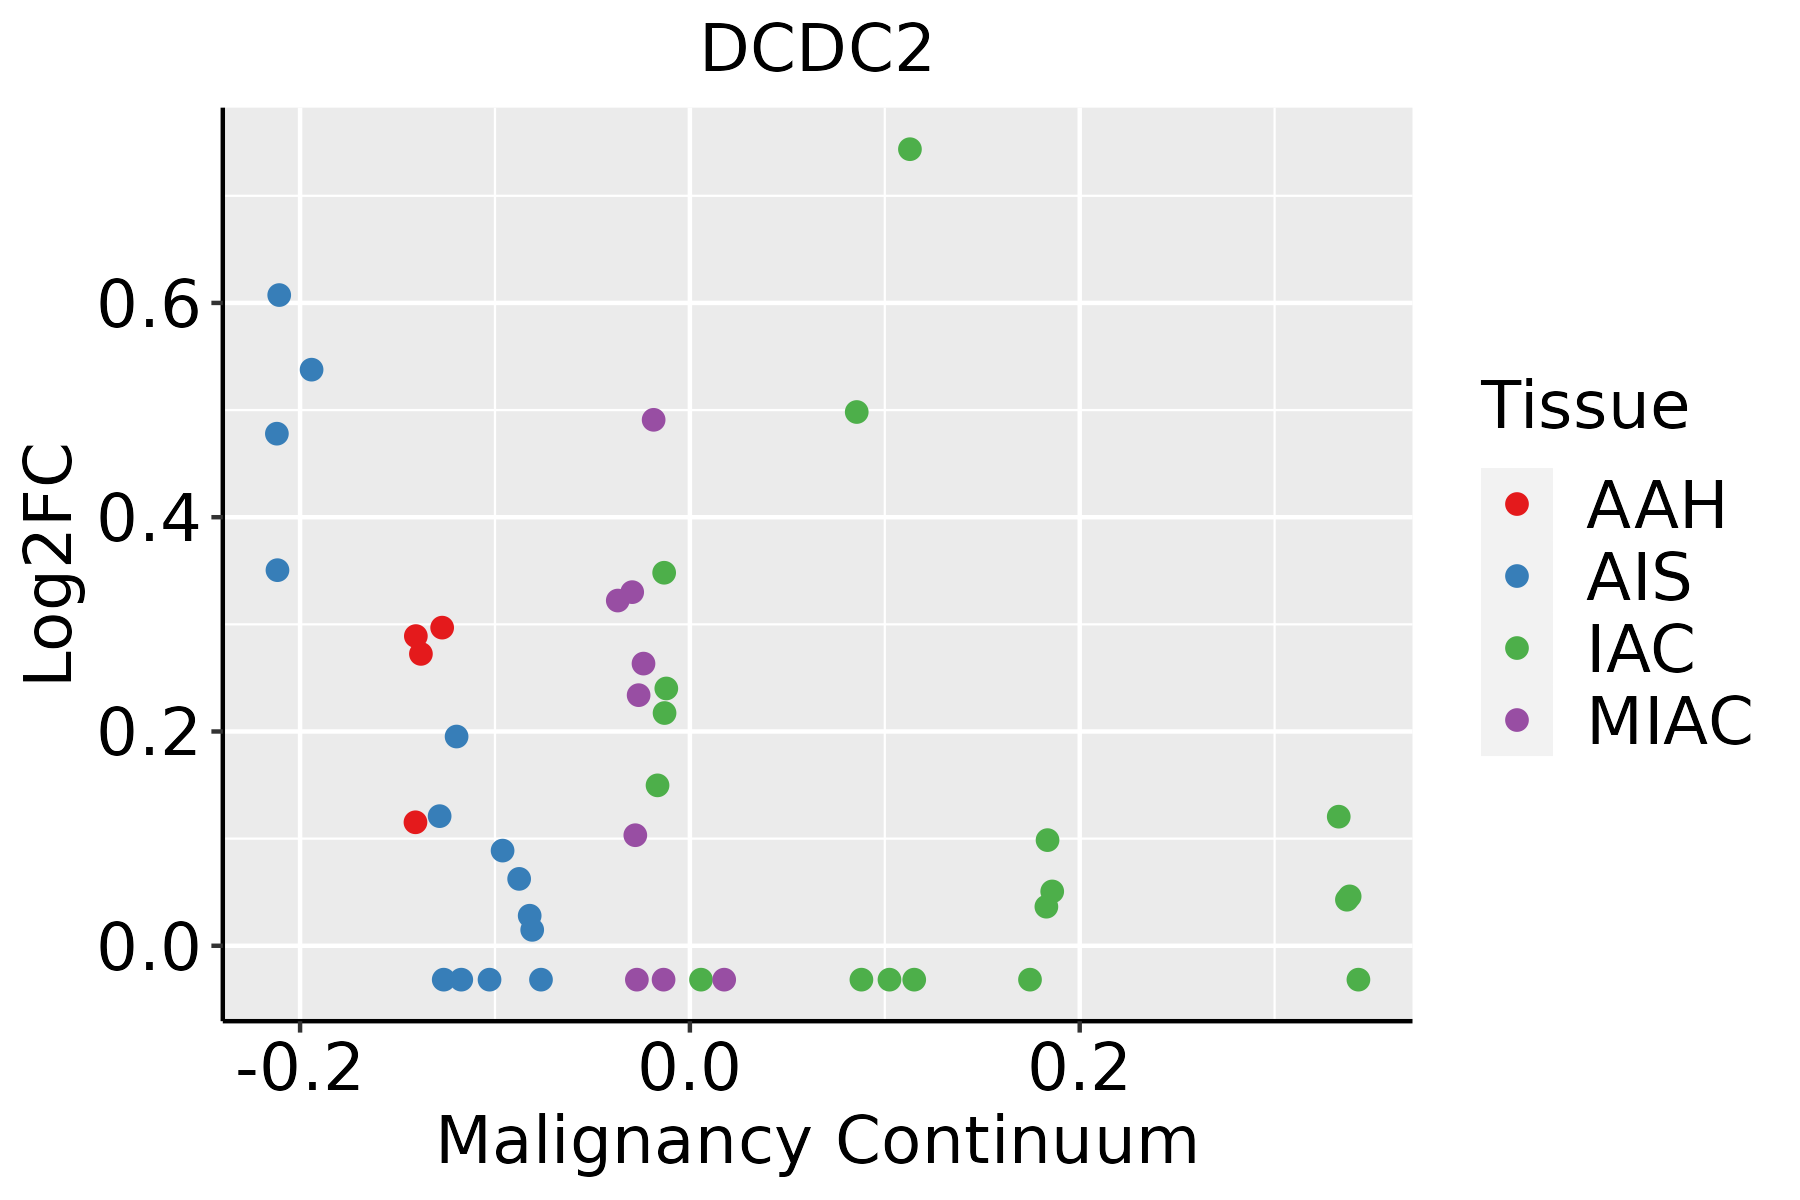 | AAH: Atypical adenomatous hyperplasia |
| AIS: Adenocarcinoma in situ | ||
| IAC: Invasive lung adenocarcinoma | ||
| MIA: Minimally invasive adenocarcinoma | ||
| Thyroid | 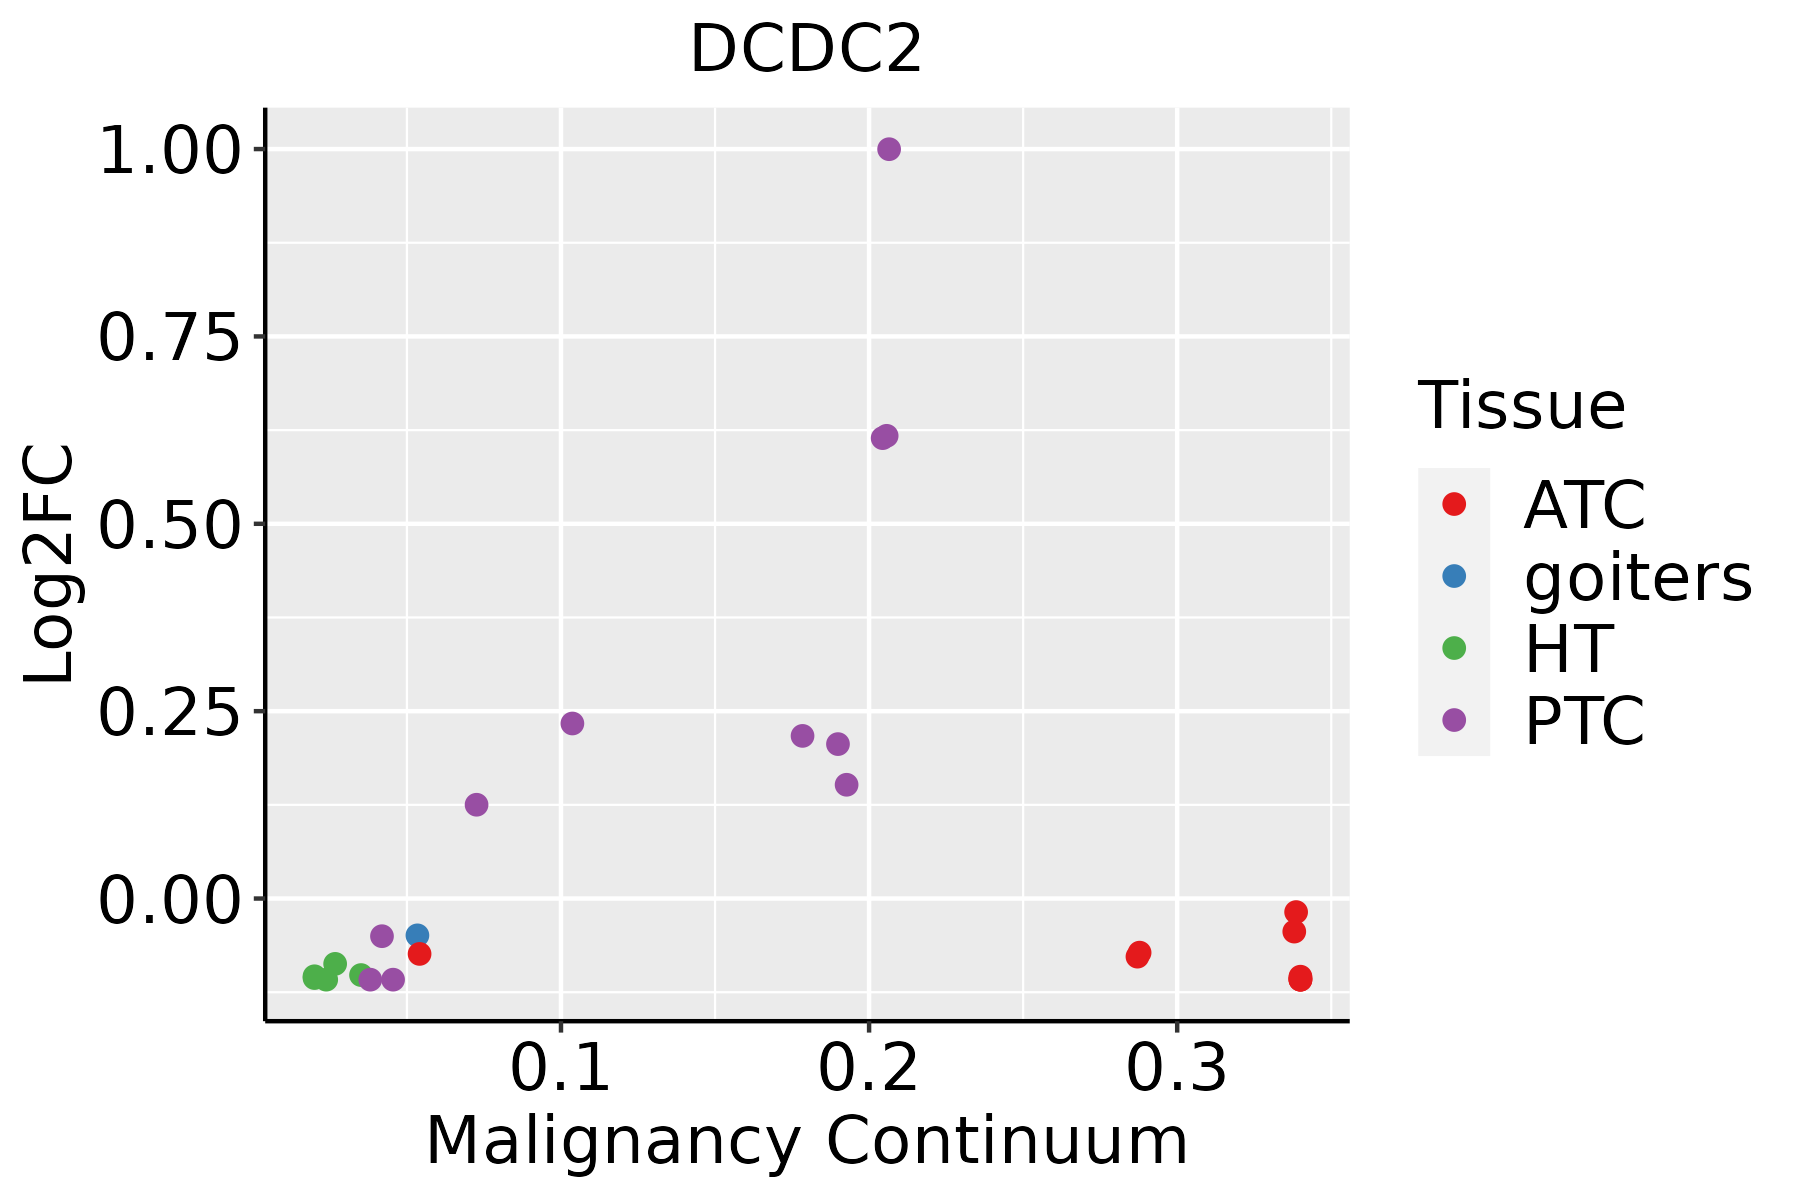 | ATC: Anaplastic thyroid cancer |
| HT: Hashimoto's thyroiditis | ||
| PTC: Papillary thyroid cancer |
| ∗log2FC in expression of this searched gene in stem-like cells from each diseased tissue sample relative to stem-like cells in normal samples in each tissue plotted against the malignancy continuum. Samples are colored based on if they are from different disease stage. |
Top |
Malignant transformation related pathway analysis |
| Find out the enriched GO biological processes and KEGG pathways involved in transition from healthy to precancer to cancer |
| Tissue | Disease Stage | Enriched GO biological Processes |
| Colorectum | AD |  |
| Colorectum | SER |  |
| Colorectum | MSS |  |
| Colorectum | MSI-H |  |
| Colorectum | FAP |  |
| ∗Top 15 enriched GO BP terms are showed in the bar plot of each disease state in each tissue. Each row represents a significant GO biological process which is colored according to the -log10(p.adjust). |
| Page: 1 2 3 4 5 6 7 8 9 |
| GO ID | Tissue | Disease Stage | Description | Gene Ratio | Bg Ratio | pvalue | p.adjust | Count |
| GO:00301118 | Endometrium | AEH | regulation of Wnt signaling pathway | 71/2100 | 328/18723 | 3.31e-08 | 1.87e-06 | 71 |
| GO:00160558 | Endometrium | AEH | Wnt signaling pathway | 85/2100 | 444/18723 | 4.99e-07 | 1.97e-05 | 85 |
| GO:01987388 | Endometrium | AEH | cell-cell signaling by wnt | 85/2100 | 446/18723 | 6.07e-07 | 2.29e-05 | 85 |
| GO:00163588 | Endometrium | AEH | dendrite development | 46/2100 | 243/18723 | 2.56e-04 | 3.03e-03 | 46 |
| GO:00017642 | Endometrium | AEH | neuron migration | 31/2100 | 156/18723 | 1.08e-03 | 9.46e-03 | 31 |
| GO:01200329 | Endometrium | AEH | regulation of plasma membrane bounded cell projection assembly | 34/2100 | 186/18723 | 2.79e-03 | 2.01e-02 | 34 |
| GO:00604918 | Endometrium | AEH | regulation of cell projection assembly | 34/2100 | 188/18723 | 3.33e-03 | 2.32e-02 | 34 |
| GO:003011113 | Endometrium | EEC | regulation of Wnt signaling pathway | 74/2168 | 328/18723 | 1.03e-08 | 6.47e-07 | 74 |
| GO:001605513 | Endometrium | EEC | Wnt signaling pathway | 90/2168 | 444/18723 | 6.65e-08 | 3.50e-06 | 90 |
| GO:019873813 | Endometrium | EEC | cell-cell signaling by wnt | 90/2168 | 446/18723 | 8.25e-08 | 4.23e-06 | 90 |
| GO:00017641 | Endometrium | EEC | neuron migration | 33/2168 | 156/18723 | 4.17e-04 | 4.38e-03 | 33 |
| GO:001635813 | Endometrium | EEC | dendrite development | 44/2168 | 243/18723 | 1.72e-03 | 1.34e-02 | 44 |
| GO:012003214 | Endometrium | EEC | regulation of plasma membrane bounded cell projection assembly | 35/2168 | 186/18723 | 2.52e-03 | 1.84e-02 | 35 |
| GO:006049114 | Endometrium | EEC | regulation of cell projection assembly | 35/2168 | 188/18723 | 3.02e-03 | 2.10e-02 | 35 |
| GO:001605511 | Liver | Cirrhotic | Wnt signaling pathway | 150/4634 | 444/18723 | 9.75e-06 | 1.42e-04 | 150 |
| GO:019873811 | Liver | Cirrhotic | cell-cell signaling by wnt | 150/4634 | 446/18723 | 1.28e-05 | 1.80e-04 | 150 |
| GO:003011111 | Liver | Cirrhotic | regulation of Wnt signaling pathway | 112/4634 | 328/18723 | 7.57e-05 | 8.40e-04 | 112 |
| GO:1902115 | Liver | Cirrhotic | regulation of organelle assembly | 66/4634 | 186/18723 | 6.66e-04 | 5.04e-03 | 66 |
| GO:01200326 | Liver | Cirrhotic | regulation of plasma membrane bounded cell projection assembly | 63/4634 | 186/18723 | 3.16e-03 | 1.78e-02 | 63 |
| GO:00604915 | Liver | Cirrhotic | regulation of cell projection assembly | 63/4634 | 188/18723 | 4.17e-03 | 2.22e-02 | 63 |
| Page: 1 2 3 |
| Pathway ID | Tissue | Disease Stage | Description | Gene Ratio | Bg Ratio | pvalue | p.adjust | qvalue | Count |
| Page: 1 |
Top |
Cell-cell communication analysis |
| Identification of potential cell-cell interactions between two cell types and their ligand-receptor pairs for different disease states |
| Ligand | Receptor | LRpair | Pathway | Tissue | Disease Stage |
| Page: 1 |
Top |
Single-cell gene regulatory network inference analysis |
| Find out the significant the regulons (TFs) and the target genes of each regulon across cell types for different disease states |
| TF | Cell Type | Tissue | Disease Stage | Target Gene | RSS | Regulon Activity |
| ∗The dot plots of a searched regulon are shown for all cell subpopulations in each disease state of each tissue based on the regulon specific score inferred using pySCENIC and by calculating the average expression. |
| Page: 1 |
Top |
Somatic mutation of malignant transformation related genes |
| Annotation of somatic variants for genes involved in malignant transformation |
| Hugo Symbol | Variant Class | Variant Classification | dbSNP RS | HGVSc | HGVSp | HGVSp Short | SWISSPROT | BIOTYPE | SIFT | PolyPhen | Tumor Sample Barcode | Tissue | Histology | Sex | Age | Stage | Therapy Types | Drugs | Outcome |
| DCDC2 | SNV | Missense_Mutation | c.1421N>A | p.Ala474Asp | p.A474D | Q9UHG0 | protein_coding | deleterious_low_confidence(0.03) | benign(0) | TCGA-A2-A25A-01 | Breast | breast invasive carcinoma | Female | <65 | I/II | Unspecific | Cytoxan | SD | |
| DCDC2 | SNV | Missense_Mutation | c.740C>T | p.Ser247Phe | p.S247F | Q9UHG0 | protein_coding | tolerated(0.17) | benign(0.006) | TCGA-IR-A3LK-01 | Cervix | cervical & endocervical cancer | Female | >=65 | I/II | Chemotherapy | cisplatin | PD | |
| DCDC2 | SNV | Missense_Mutation | novel | c.163N>A | p.Val55Ile | p.V55I | Q9UHG0 | protein_coding | tolerated(0.38) | possibly_damaging(0.656) | TCGA-VS-A950-01 | Cervix | cervical & endocervical cancer | Female | <65 | III/IV | Unknown | Unknown | SD |
| DCDC2 | SNV | Missense_Mutation | c.1420N>A | p.Ala474Thr | p.A474T | Q9UHG0 | protein_coding | deleterious_low_confidence(0.05) | benign(0.015) | TCGA-AA-3672-01 | Colorectum | colon adenocarcinoma | Female | >=65 | III/IV | Unknown | Unknown | SD | |
| DCDC2 | SNV | Missense_Mutation | c.218G>A | p.Arg73Gln | p.R73Q | Q9UHG0 | protein_coding | deleterious(0.02) | probably_damaging(0.979) | TCGA-AA-3977-01 | Colorectum | colon adenocarcinoma | Male | >=65 | I/II | Unknown | Unknown | SD | |
| DCDC2 | SNV | Missense_Mutation | c.994N>T | p.Asp332Tyr | p.D332Y | Q9UHG0 | protein_coding | deleterious(0.05) | possibly_damaging(0.819) | TCGA-AA-A010-01 | Colorectum | colon adenocarcinoma | Female | <65 | I/II | Chemotherapy | folinic | CR | |
| DCDC2 | SNV | Missense_Mutation | rs200233521 | c.770G>A | p.Arg257His | p.R257H | Q9UHG0 | protein_coding | deleterious(0.04) | possibly_damaging(0.869) | TCGA-AD-6901-01 | Colorectum | colon adenocarcinoma | Male | >=65 | I/II | Chemotherapy | xeloda | PD |
| DCDC2 | SNV | Missense_Mutation | novel | c.650N>G | p.Lys217Arg | p.K217R | Q9UHG0 | protein_coding | tolerated(0.13) | benign(0.003) | TCGA-CA-6717-01 | Colorectum | colon adenocarcinoma | Male | <65 | I/II | Chemotherapy | oxaliplatin | CR |
| DCDC2 | SNV | Missense_Mutation | c.869N>C | p.Lys290Thr | p.K290T | Q9UHG0 | protein_coding | tolerated(0.13) | benign(0.003) | TCGA-CA-6718-01 | Colorectum | colon adenocarcinoma | Male | <65 | I/II | Unknown | Unknown | PD | |
| DCDC2 | SNV | Missense_Mutation | c.898N>C | p.Ser300Pro | p.S300P | Q9UHG0 | protein_coding | tolerated(0.11) | benign(0.007) | TCGA-D5-6928-01 | Colorectum | colon adenocarcinoma | Male | >=65 | I/II | Unknown | Unknown | SD |
| Page: 1 2 3 4 5 6 |
Top |
Related drugs of malignant transformation related genes |
| Identification of chemicals and drugs interact with genes involved in malignant transfromation |
| (DGIdb 4.0) |
| Entrez ID | Symbol | Category | Interaction Types | Drug Claim Name | Drug Name | PMIDs |
| Page: 1 |

Copyright 2023-Present -The University of Texas Health Science Center at Houston |