
|
|||||
|
 | |
| |
| |
| |
| |
| |
|
Gene: DCAF8 |
Gene summary for DCAF8 |
| Gene information | Species | Human | Gene symbol | DCAF8 | Gene ID | 50717 |
| Gene name | DDB1 and CUL4 associated factor 8 | |
| Gene Alias | GAN2 | |
| Cytomap | 1q23.2 | |
| Gene Type | protein-coding | GO ID | GO:0006464 | UniProtAcc | B7Z8C9 |
Top |
Malignant transformation analysis |
| Identification of the aberrant gene expression in precancerous and cancerous lesions by comparing the gene expression of stem-like cells in diseased tissues with normal stem cells |
| Entrez ID | Symbol | Replicates | Species | Organ | Tissue | Adj P-value | Log2FC | Malignancy |
| 50717 | DCAF8 | LZE2T | Human | Esophagus | ESCC | 2.40e-10 | 8.70e-01 | 0.082 |
| 50717 | DCAF8 | LZE4T | Human | Esophagus | ESCC | 4.82e-13 | 4.27e-01 | 0.0811 |
| 50717 | DCAF8 | LZE7T | Human | Esophagus | ESCC | 2.40e-07 | 4.97e-01 | 0.0667 |
| 50717 | DCAF8 | LZE8T | Human | Esophagus | ESCC | 7.96e-09 | 2.91e-01 | 0.067 |
| 50717 | DCAF8 | LZE20T | Human | Esophagus | ESCC | 4.45e-07 | 1.96e-01 | 0.0662 |
| 50717 | DCAF8 | LZE22T | Human | Esophagus | ESCC | 9.55e-04 | 2.94e-01 | 0.068 |
| 50717 | DCAF8 | LZE24T | Human | Esophagus | ESCC | 6.08e-13 | 3.49e-01 | 0.0596 |
| 50717 | DCAF8 | LZE21T | Human | Esophagus | ESCC | 6.43e-07 | 4.14e-01 | 0.0655 |
| 50717 | DCAF8 | LZE6T | Human | Esophagus | ESCC | 3.88e-04 | 2.59e-01 | 0.0845 |
| 50717 | DCAF8 | P1T-E | Human | Esophagus | ESCC | 2.28e-10 | 4.90e-01 | 0.0875 |
| 50717 | DCAF8 | P2T-E | Human | Esophagus | ESCC | 2.22e-27 | 5.45e-01 | 0.1177 |
| 50717 | DCAF8 | P4T-E | Human | Esophagus | ESCC | 4.78e-25 | 5.29e-01 | 0.1323 |
| 50717 | DCAF8 | P5T-E | Human | Esophagus | ESCC | 5.54e-23 | 3.77e-01 | 0.1327 |
| 50717 | DCAF8 | P8T-E | Human | Esophagus | ESCC | 9.68e-20 | 2.64e-01 | 0.0889 |
| 50717 | DCAF8 | P9T-E | Human | Esophagus | ESCC | 2.08e-22 | 4.26e-01 | 0.1131 |
| 50717 | DCAF8 | P10T-E | Human | Esophagus | ESCC | 2.75e-29 | 3.96e-01 | 0.116 |
| 50717 | DCAF8 | P11T-E | Human | Esophagus | ESCC | 7.81e-08 | 3.70e-01 | 0.1426 |
| 50717 | DCAF8 | P12T-E | Human | Esophagus | ESCC | 2.44e-18 | 3.91e-01 | 0.1122 |
| 50717 | DCAF8 | P15T-E | Human | Esophagus | ESCC | 9.22e-25 | 5.42e-01 | 0.1149 |
| 50717 | DCAF8 | P16T-E | Human | Esophagus | ESCC | 2.52e-29 | 3.95e-01 | 0.1153 |
| Page: 1 2 3 4 5 6 |
| Tissue | Expression Dynamics | Abbreviation |
| Esophagus | 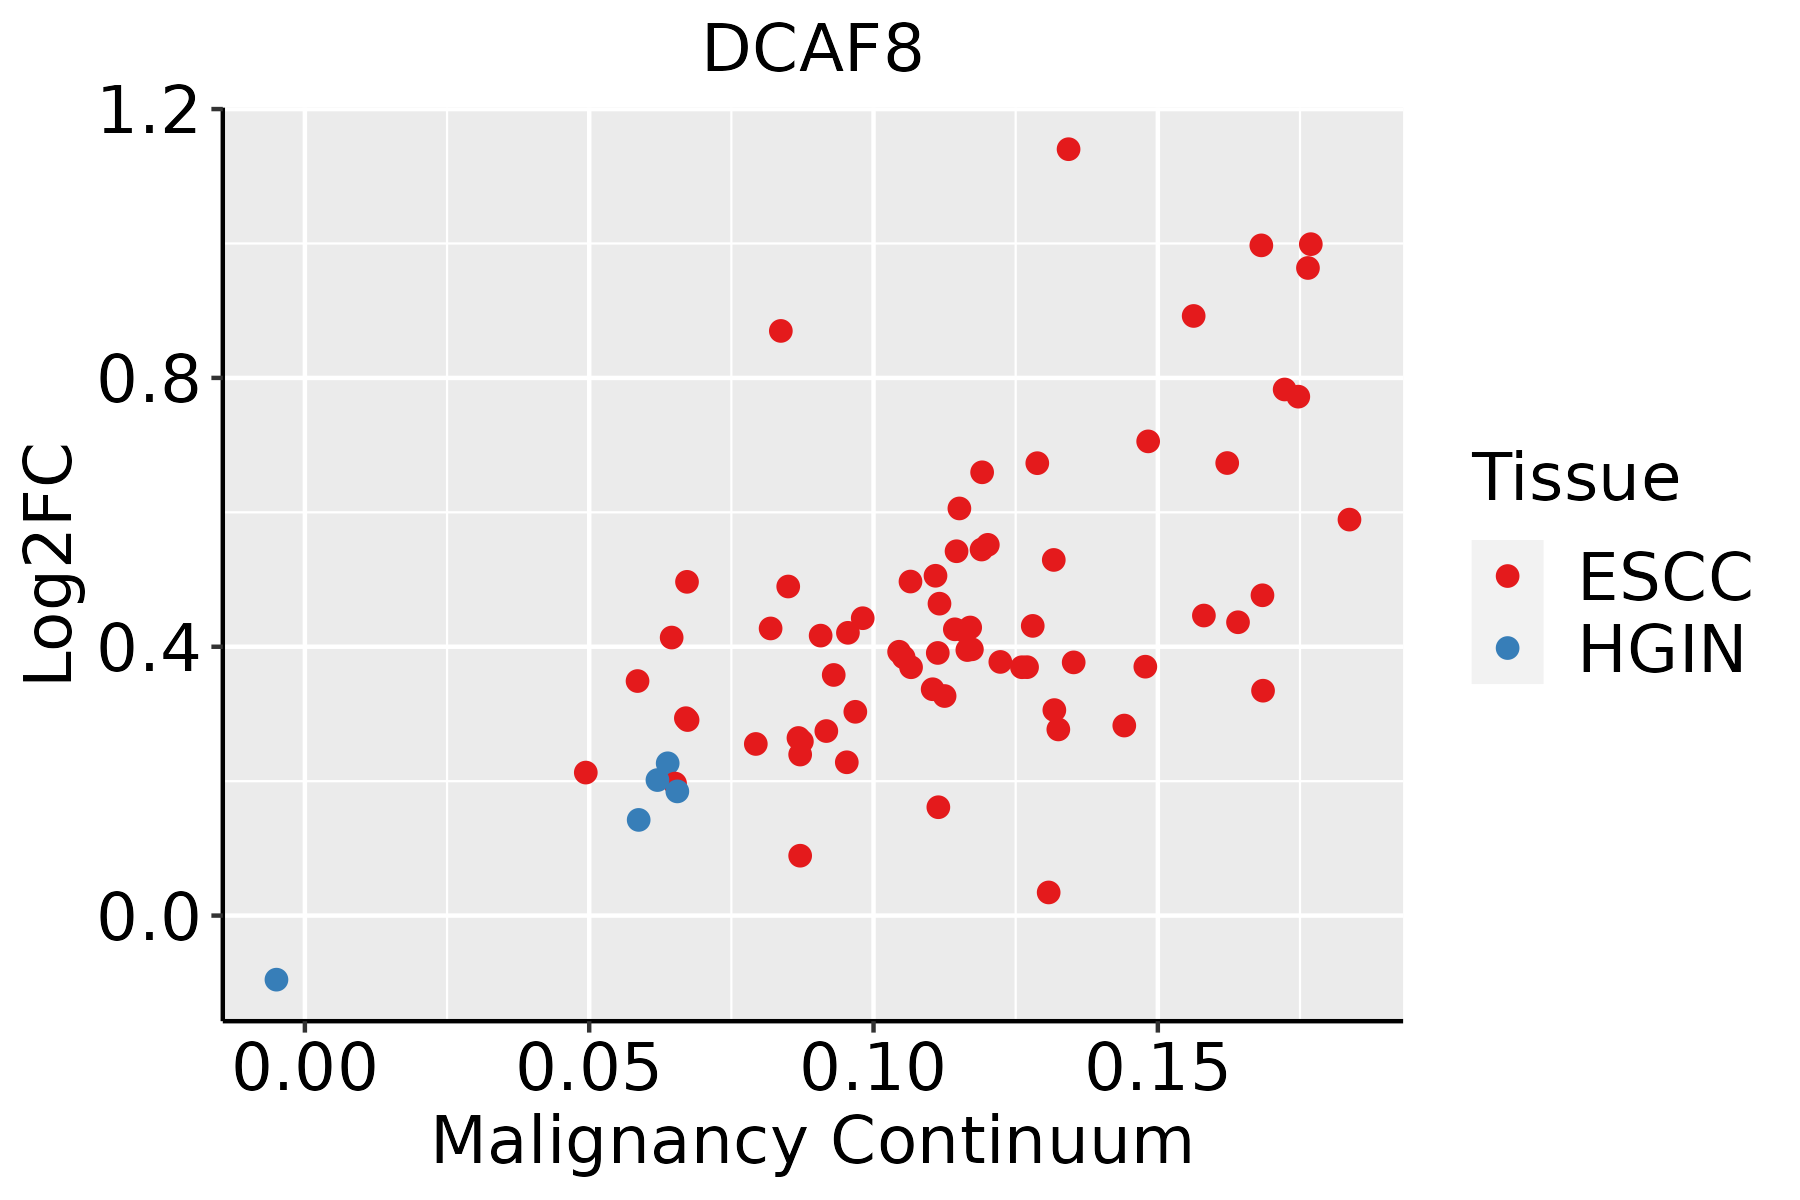 | ESCC: Esophageal squamous cell carcinoma |
| HGIN: High-grade intraepithelial neoplasias | ||
| LGIN: Low-grade intraepithelial neoplasias | ||
| Liver |  | HCC: Hepatocellular carcinoma |
| NAFLD: Non-alcoholic fatty liver disease | ||
| Oral Cavity | 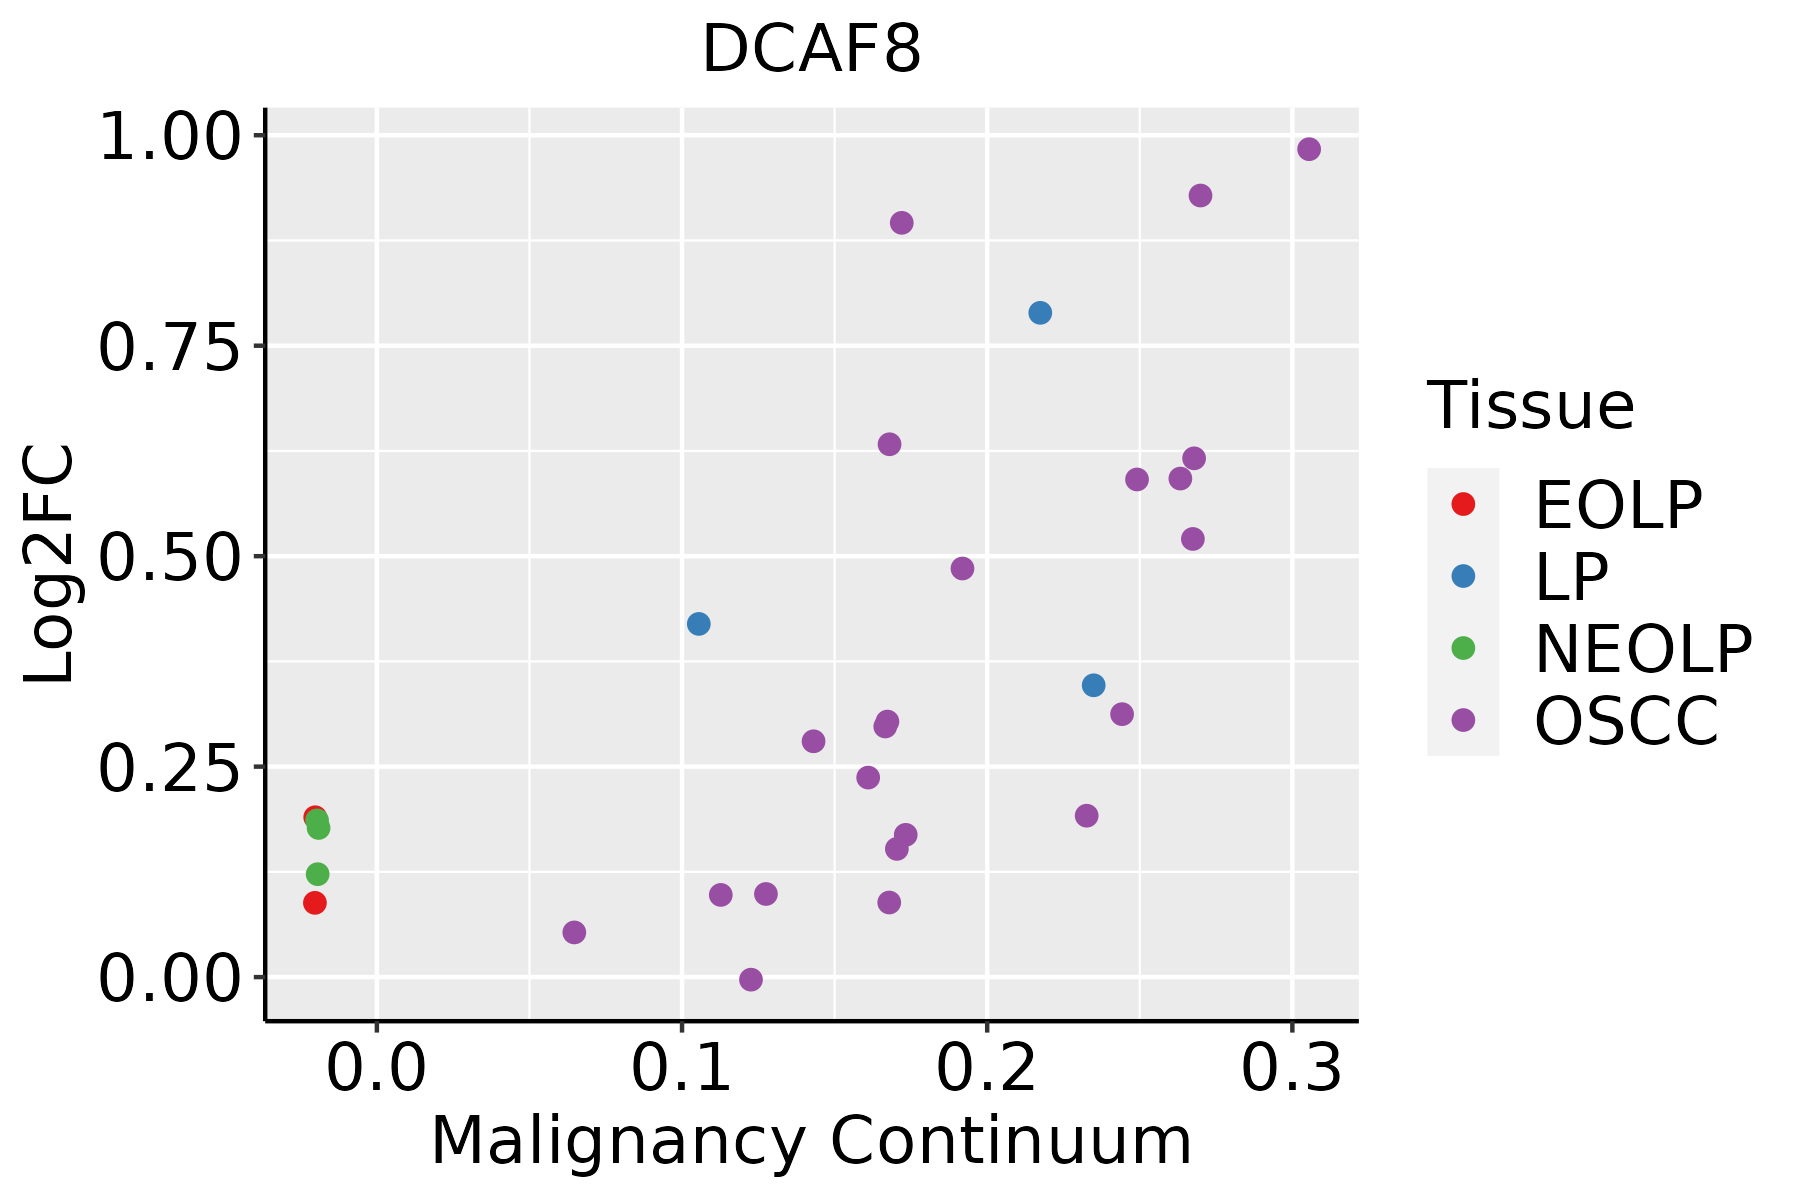 | EOLP: Erosive Oral lichen planus |
| LP: leukoplakia | ||
| NEOLP: Non-erosive oral lichen planus | ||
| OSCC: Oral squamous cell carcinoma | ||
| Thyroid | 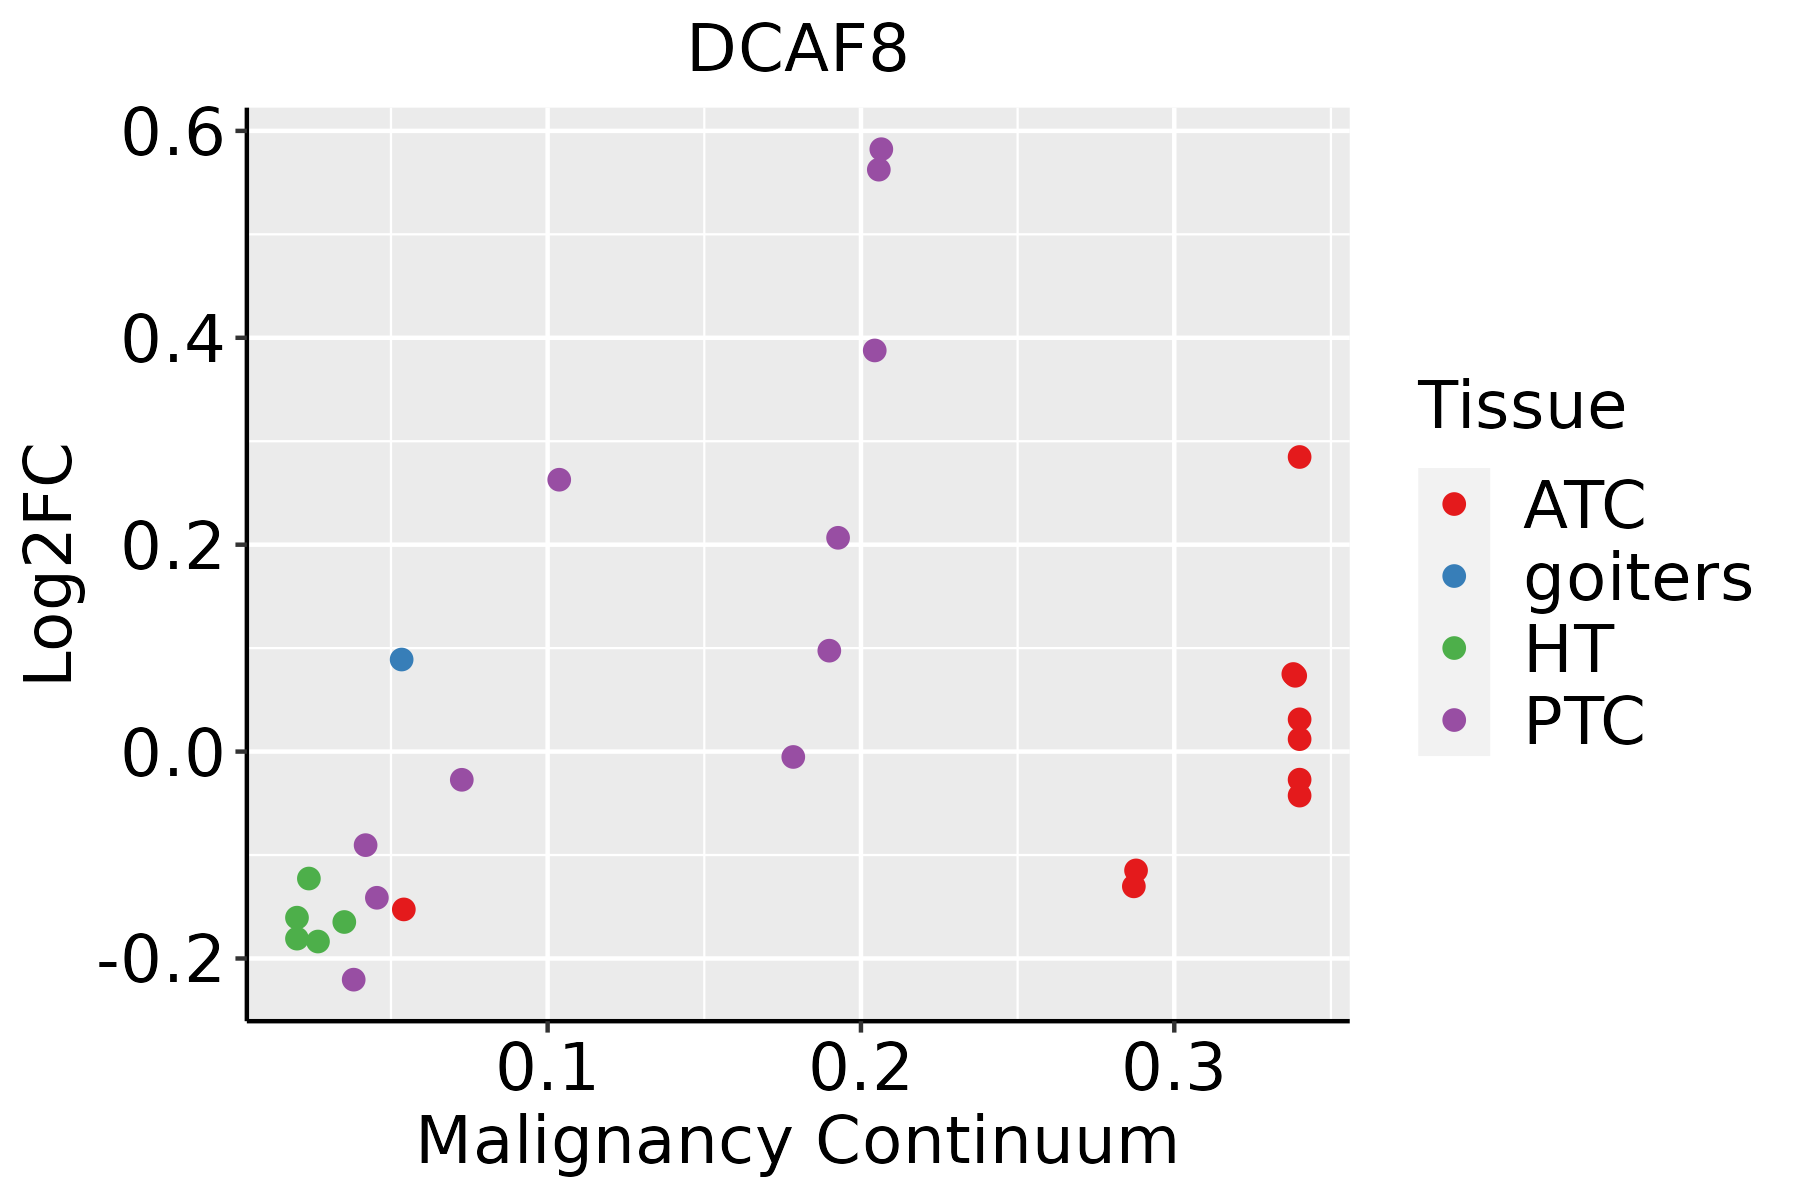 | ATC: Anaplastic thyroid cancer |
| HT: Hashimoto's thyroiditis | ||
| PTC: Papillary thyroid cancer |
| ∗log2FC in expression of this searched gene in stem-like cells from each diseased tissue sample relative to stem-like cells in normal samples in each tissue plotted against the malignancy continuum. Samples are colored based on if they are from different disease stage. |
Top |
Malignant transformation related pathway analysis |
| Find out the enriched GO biological processes and KEGG pathways involved in transition from healthy to precancer to cancer |
| Tissue | Disease Stage | Enriched GO biological Processes |
| Colorectum | AD |  |
| Colorectum | SER |  |
| Colorectum | MSS |  |
| Colorectum | MSI-H |  |
| Colorectum | FAP |  |
| ∗Top 15 enriched GO BP terms are showed in the bar plot of each disease state in each tissue. Each row represents a significant GO biological process which is colored according to the -log10(p.adjust). |
| Page: 1 2 3 4 5 6 7 8 9 |
| GO ID | Tissue | Disease Stage | Description | Gene Ratio | Bg Ratio | pvalue | p.adjust | Count |
| Page: 1 |
| Pathway ID | Tissue | Disease Stage | Description | Gene Ratio | Bg Ratio | pvalue | p.adjust | qvalue | Count |
| Page: 1 |
Top |
Cell-cell communication analysis |
| Identification of potential cell-cell interactions between two cell types and their ligand-receptor pairs for different disease states |
| Ligand | Receptor | LRpair | Pathway | Tissue | Disease Stage |
| Page: 1 |
Top |
Single-cell gene regulatory network inference analysis |
| Find out the significant the regulons (TFs) and the target genes of each regulon across cell types for different disease states |
| TF | Cell Type | Tissue | Disease Stage | Target Gene | RSS | Regulon Activity |
| ∗The dot plots of a searched regulon are shown for all cell subpopulations in each disease state of each tissue based on the regulon specific score inferred using pySCENIC and by calculating the average expression. |
| Page: 1 |
Top |
Somatic mutation of malignant transformation related genes |
| Annotation of somatic variants for genes involved in malignant transformation |
| Hugo Symbol | Variant Class | Variant Classification | dbSNP RS | HGVSc | HGVSp | HGVSp Short | SWISSPROT | BIOTYPE | SIFT | PolyPhen | Tumor Sample Barcode | Tissue | Histology | Sex | Age | Stage | Therapy Types | Drugs | Outcome |
| DCAF8 | SNV | Missense_Mutation | c.37G>C | p.Asp13His | p.D13H | Q5TAQ9 | protein_coding | deleterious_low_confidence(0.01) | probably_damaging(0.987) | TCGA-AC-A23H-01 | Breast | breast invasive carcinoma | Female | >=65 | I/II | Unknown | Unknown | PD | |
| DCAF8 | SNV | Missense_Mutation | rs147997856 | c.175N>T | p.Arg59Cys | p.R59C | Q5TAQ9 | protein_coding | tolerated(0.05) | benign(0.27) | TCGA-E2-A15R-01 | Breast | breast invasive carcinoma | Female | <65 | I/II | Chemotherapy | cyclophosphamide | SD |
| DCAF8 | SNV | Missense_Mutation | rs200043571 | c.349N>T | p.Arg117Cys | p.R117C | Q5TAQ9 | protein_coding | tolerated(0.22) | benign(0.001) | TCGA-OL-A66N-01 | Breast | breast invasive carcinoma | Female | <65 | III/IV | Unknown | Unknown | SD |
| DCAF8 | SNV | Missense_Mutation | novel | c.469G>C | p.Ala157Pro | p.A157P | Q5TAQ9 | protein_coding | deleterious(0.02) | probably_damaging(0.927) | TCGA-PL-A8LV-01 | Breast | breast invasive carcinoma | Female | <65 | III/IV | Unknown | Unknown | SD |
| DCAF8 | insertion | Nonsense_Mutation | novel | c.1654_1655insCCAAAGCCTCTTTTTGA | p.Leu552ProfsTer6 | p.L552Pfs*6 | Q5TAQ9 | protein_coding | TCGA-A2-A0D4-01 | Breast | breast invasive carcinoma | Female | <65 | I/II | Chemotherapy | adriamycin | SD | ||
| DCAF8 | insertion | In_Frame_Ins | novel | c.1626_1627insTTCCCATCCACAGCGCTGGCGAGAACCTGGGGTTGGGGC | p.Ser542_His543insPheProSerThrAlaLeuAlaArgThrTrpGlyTrpGly | p.S542_H543insFPSTALARTWGWG | Q5TAQ9 | protein_coding | TCGA-AO-A0JD-01 | Breast | breast invasive carcinoma | Female | <65 | III/IV | Chemotherapy | cyclophosphamide | SD | ||
| DCAF8 | insertion | Nonsense_Mutation | novel | c.1445_1446insTAAGGAGCATCTTTAAGAATTATT | p.Asn482_Cys483insLysGluHisLeuTerGluLeuPhe | p.N482_C483insKEHL*ELF | Q5TAQ9 | protein_coding | TCGA-AQ-A04J-01 | Breast | breast invasive carcinoma | Female | <65 | I/II | Chemotherapy | cytoxan | SD | ||
| DCAF8 | SNV | Missense_Mutation | c.956N>T | p.Ala319Val | p.A319V | Q5TAQ9 | protein_coding | deleterious(0.03) | benign(0.067) | TCGA-EA-A3HS-01 | Cervix | cervical & endocervical cancer | Female | <65 | I/II | Unknown | Unknown | SD | |
| DCAF8 | SNV | Missense_Mutation | c.1736C>T | p.Ser579Phe | p.S579F | Q5TAQ9 | protein_coding | deleterious(0) | probably_damaging(0.979) | TCGA-EA-A439-01 | Cervix | cervical & endocervical cancer | Female | <65 | I/II | Unknown | Unknown | PD | |
| DCAF8 | SNV | Missense_Mutation | c.549C>G | p.Phe183Leu | p.F183L | Q5TAQ9 | protein_coding | tolerated(0.66) | benign(0.009) | TCGA-VS-A958-01 | Cervix | cervical & endocervical cancer | Female | <65 | I/II | Chemotherapy | cisplatin | CR |
| Page: 1 2 3 4 5 6 7 |
Top |
Related drugs of malignant transformation related genes |
| Identification of chemicals and drugs interact with genes involved in malignant transfromation |
| (DGIdb 4.0) |
| Entrez ID | Symbol | Category | Interaction Types | Drug Claim Name | Drug Name | PMIDs |
| Page: 1 |

Copyright 2023-Present -The University of Texas Health Science Center at Houston |