
|
|||||
|
 | |
| |
| |
| |
| |
| |
|
Gene: DCAF6 |
Gene summary for DCAF6 |
| Gene information | Species | Human | Gene symbol | DCAF6 | Gene ID | 55827 |
| Gene name | DDB1 and CUL4 associated factor 6 | |
| Gene Alias | 1200006M05Rik | |
| Cytomap | 1q24.2 | |
| Gene Type | protein-coding | GO ID | GO:0006139 | UniProtAcc | Q58WW2 |
Top |
Malignant transformation analysis |
| Identification of the aberrant gene expression in precancerous and cancerous lesions by comparing the gene expression of stem-like cells in diseased tissues with normal stem cells |
| Entrez ID | Symbol | Replicates | Species | Organ | Tissue | Adj P-value | Log2FC | Malignancy |
| 55827 | DCAF6 | GSM4909281 | Human | Breast | IDC | 2.77e-04 | 2.62e-01 | 0.21 |
| 55827 | DCAF6 | GSM4909293 | Human | Breast | IDC | 1.49e-49 | 7.79e-01 | 0.1581 |
| 55827 | DCAF6 | GSM4909311 | Human | Breast | IDC | 1.36e-02 | -3.63e-02 | 0.1534 |
| 55827 | DCAF6 | GSM4909312 | Human | Breast | IDC | 4.04e-02 | 1.23e-01 | 0.1552 |
| 55827 | DCAF6 | GSM4909319 | Human | Breast | IDC | 7.48e-05 | -9.43e-02 | 0.1563 |
| 55827 | DCAF6 | M5 | Human | Breast | IDC | 1.07e-08 | 7.74e-01 | 0.1598 |
| 55827 | DCAF6 | NCCBC14 | Human | Breast | DCIS | 4.62e-03 | 3.20e-01 | 0.2021 |
| 55827 | DCAF6 | NCCBC5 | Human | Breast | DCIS | 1.64e-02 | -7.57e-02 | 0.2046 |
| 55827 | DCAF6 | DCIS2 | Human | Breast | DCIS | 1.72e-40 | 2.08e-01 | 0.0085 |
| 55827 | DCAF6 | CCI_1 | Human | Cervix | CC | 1.93e-11 | 1.27e+00 | 0.528 |
| 55827 | DCAF6 | CCI_2 | Human | Cervix | CC | 2.39e-04 | 7.98e-01 | 0.5249 |
| 55827 | DCAF6 | CCI_3 | Human | Cervix | CC | 5.56e-12 | 1.01e+00 | 0.516 |
| 55827 | DCAF6 | HTA11_3410_2000001011 | Human | Colorectum | AD | 6.85e-11 | -4.79e-01 | 0.0155 |
| 55827 | DCAF6 | HTA11_347_2000001011 | Human | Colorectum | AD | 7.72e-04 | 4.63e-01 | -0.1954 |
| 55827 | DCAF6 | HTA11_5212_2000001011 | Human | Colorectum | AD | 2.91e-03 | -4.39e-01 | -0.2061 |
| 55827 | DCAF6 | HTA11_7862_2000001011 | Human | Colorectum | AD | 1.25e-06 | -1.89e-01 | -0.0179 |
| 55827 | DCAF6 | HTA11_866_3004761011 | Human | Colorectum | AD | 8.65e-05 | -3.74e-01 | 0.096 |
| 55827 | DCAF6 | HTA11_99999965104_69814 | Human | Colorectum | MSS | 2.41e-07 | 6.51e-01 | 0.281 |
| 55827 | DCAF6 | HTA11_99999973899_84307 | Human | Colorectum | MSS | 2.07e-05 | -5.85e-01 | 0.2585 |
| 55827 | DCAF6 | HTA11_99999974143_84620 | Human | Colorectum | MSS | 7.78e-21 | -6.10e-01 | 0.3005 |
| Page: 1 2 3 4 5 6 7 8 9 10 |
| Tissue | Expression Dynamics | Abbreviation |
| Breast | 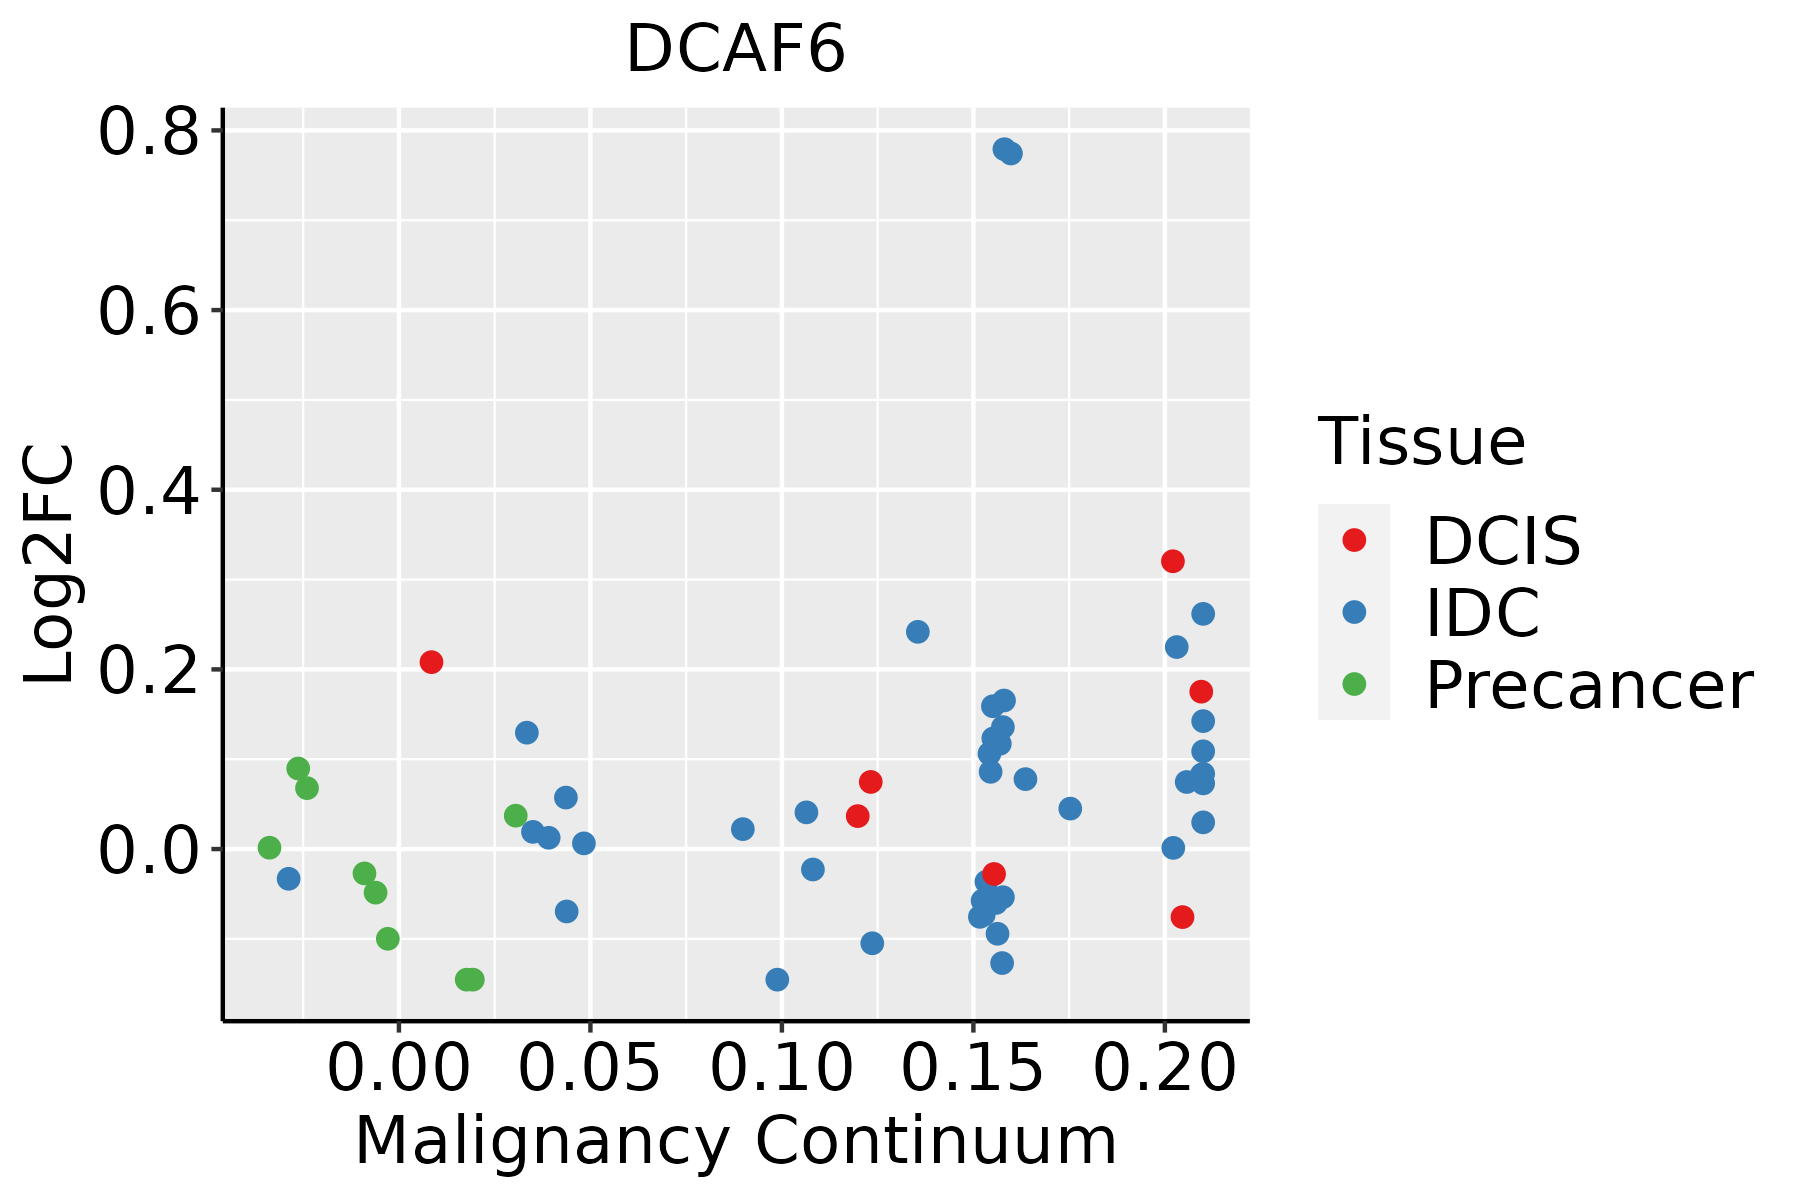 | IDC: Invasive ductal carcinoma |
| DCIS: Ductal carcinoma in situ | ||
| Precancer(BRCA1-mut): Precancerous lesion from BRCA1 mutation carriers | ||
| Cervix | 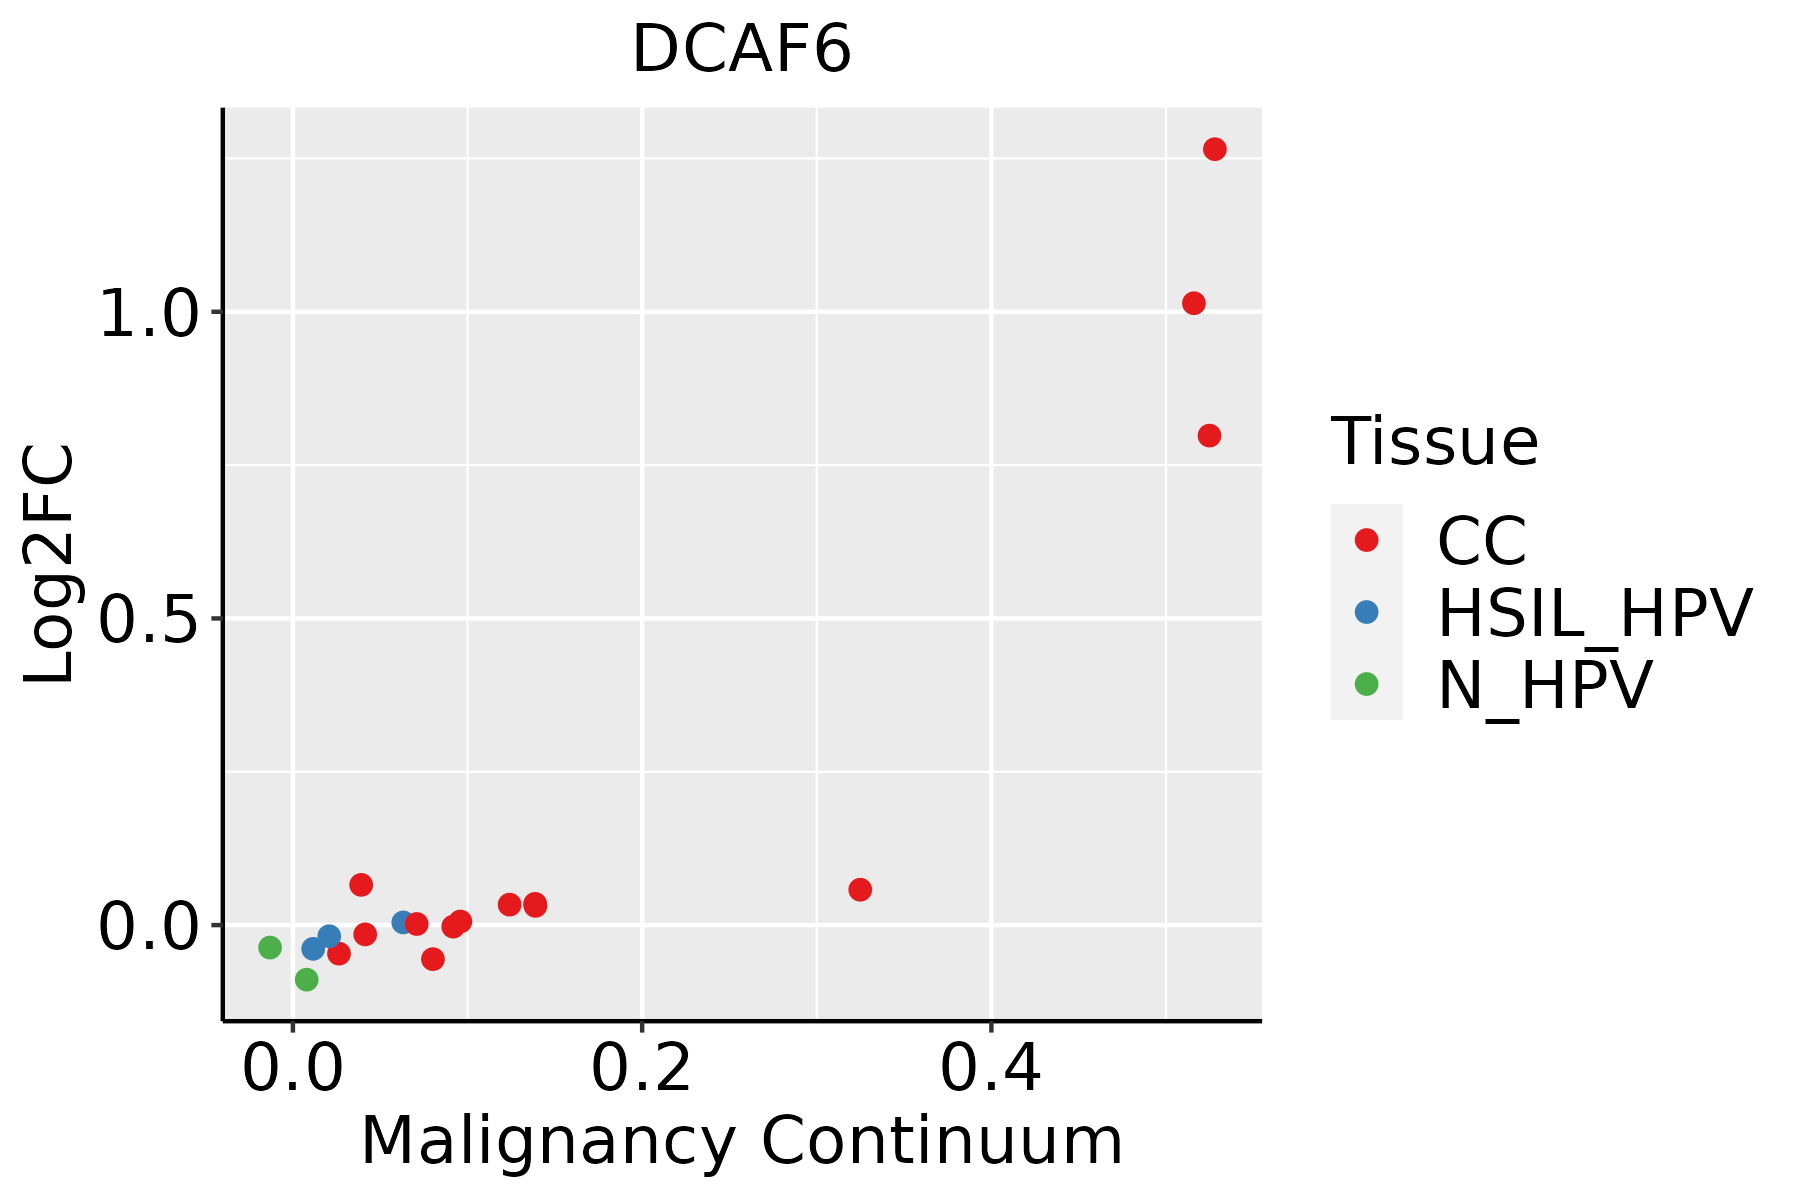 | CC: Cervix cancer |
| HSIL_HPV: HPV-infected high-grade squamous intraepithelial lesions | ||
| N_HPV: HPV-infected normal cervix | ||
| Colorectum (GSE201348) |  | FAP: Familial adenomatous polyposis |
| CRC: Colorectal cancer | ||
| Colorectum (HTA11) |  | AD: Adenomas |
| SER: Sessile serrated lesions | ||
| MSI-H: Microsatellite-high colorectal cancer | ||
| MSS: Microsatellite stable colorectal cancer | ||
| Esophagus | 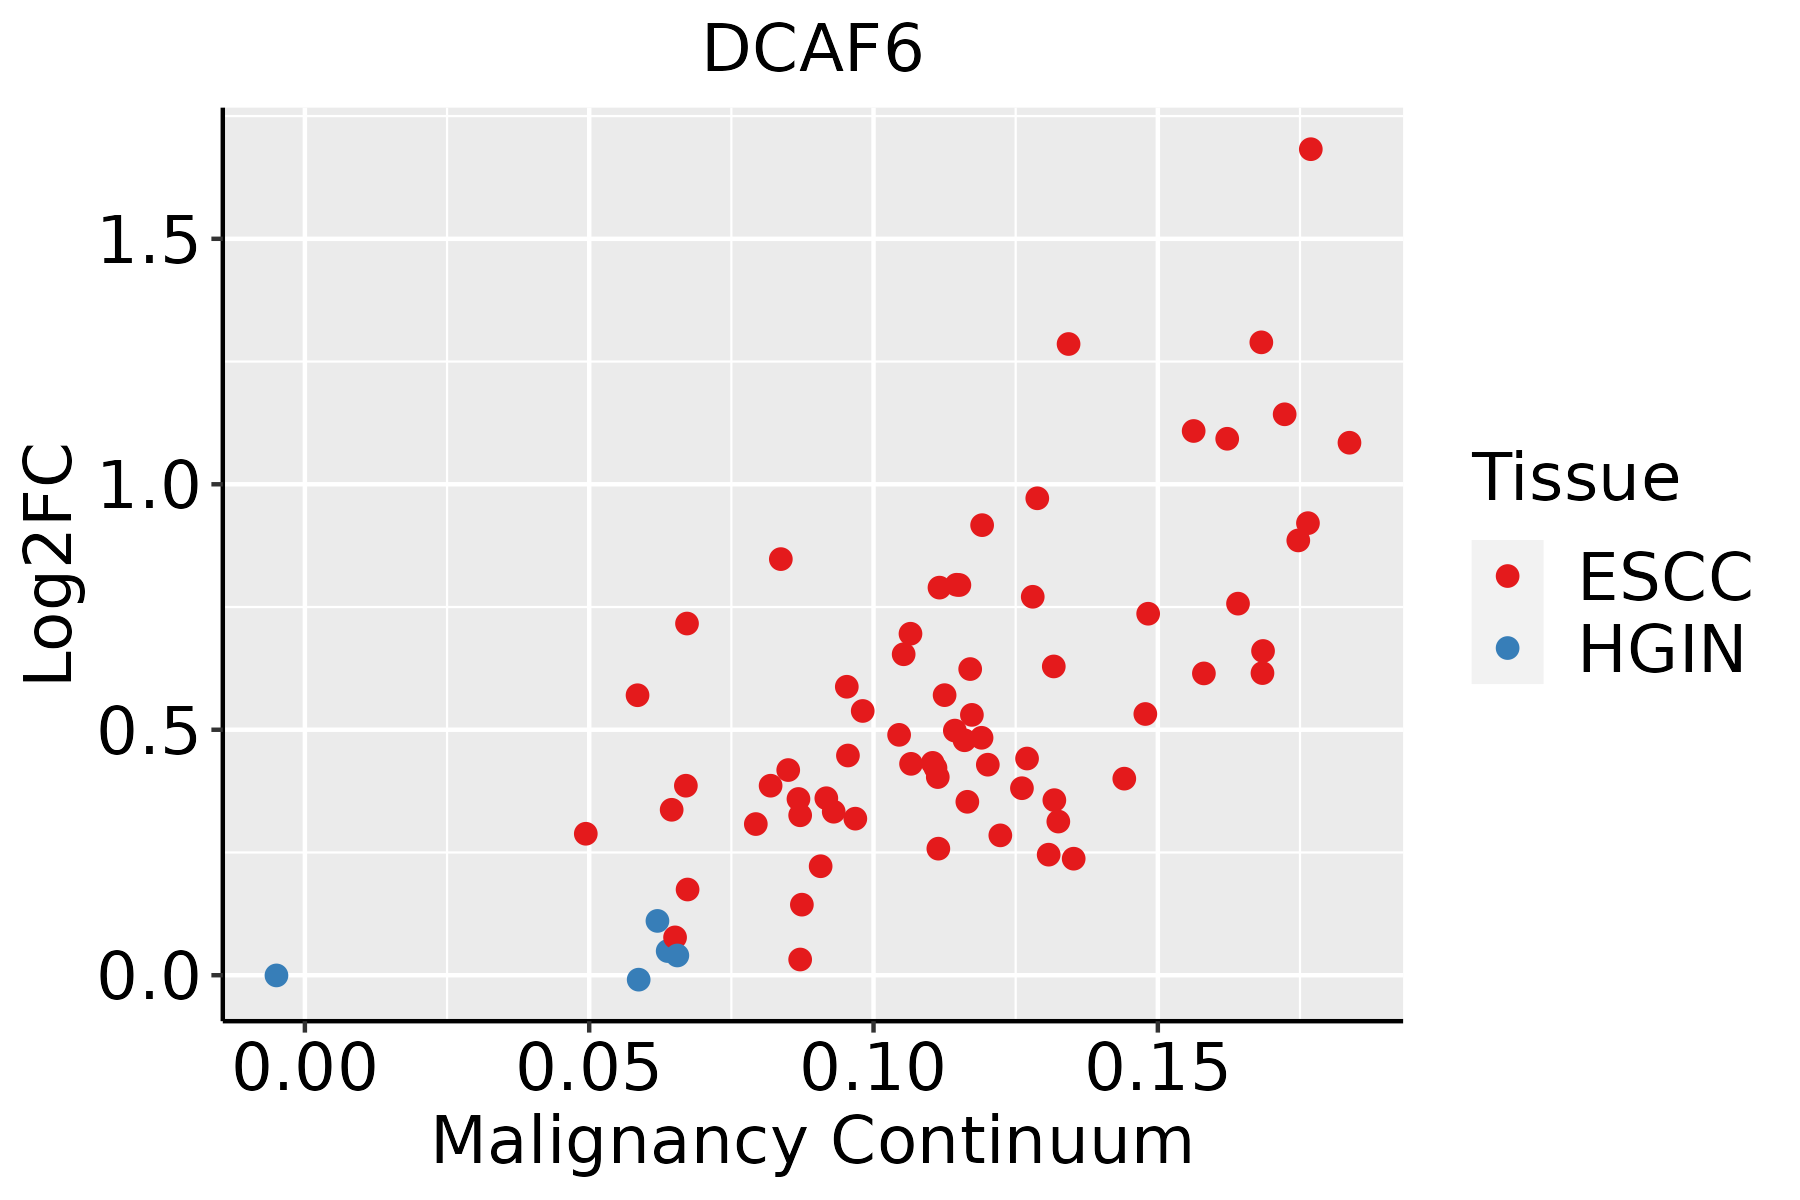 | ESCC: Esophageal squamous cell carcinoma |
| HGIN: High-grade intraepithelial neoplasias | ||
| LGIN: Low-grade intraepithelial neoplasias | ||
| Liver | 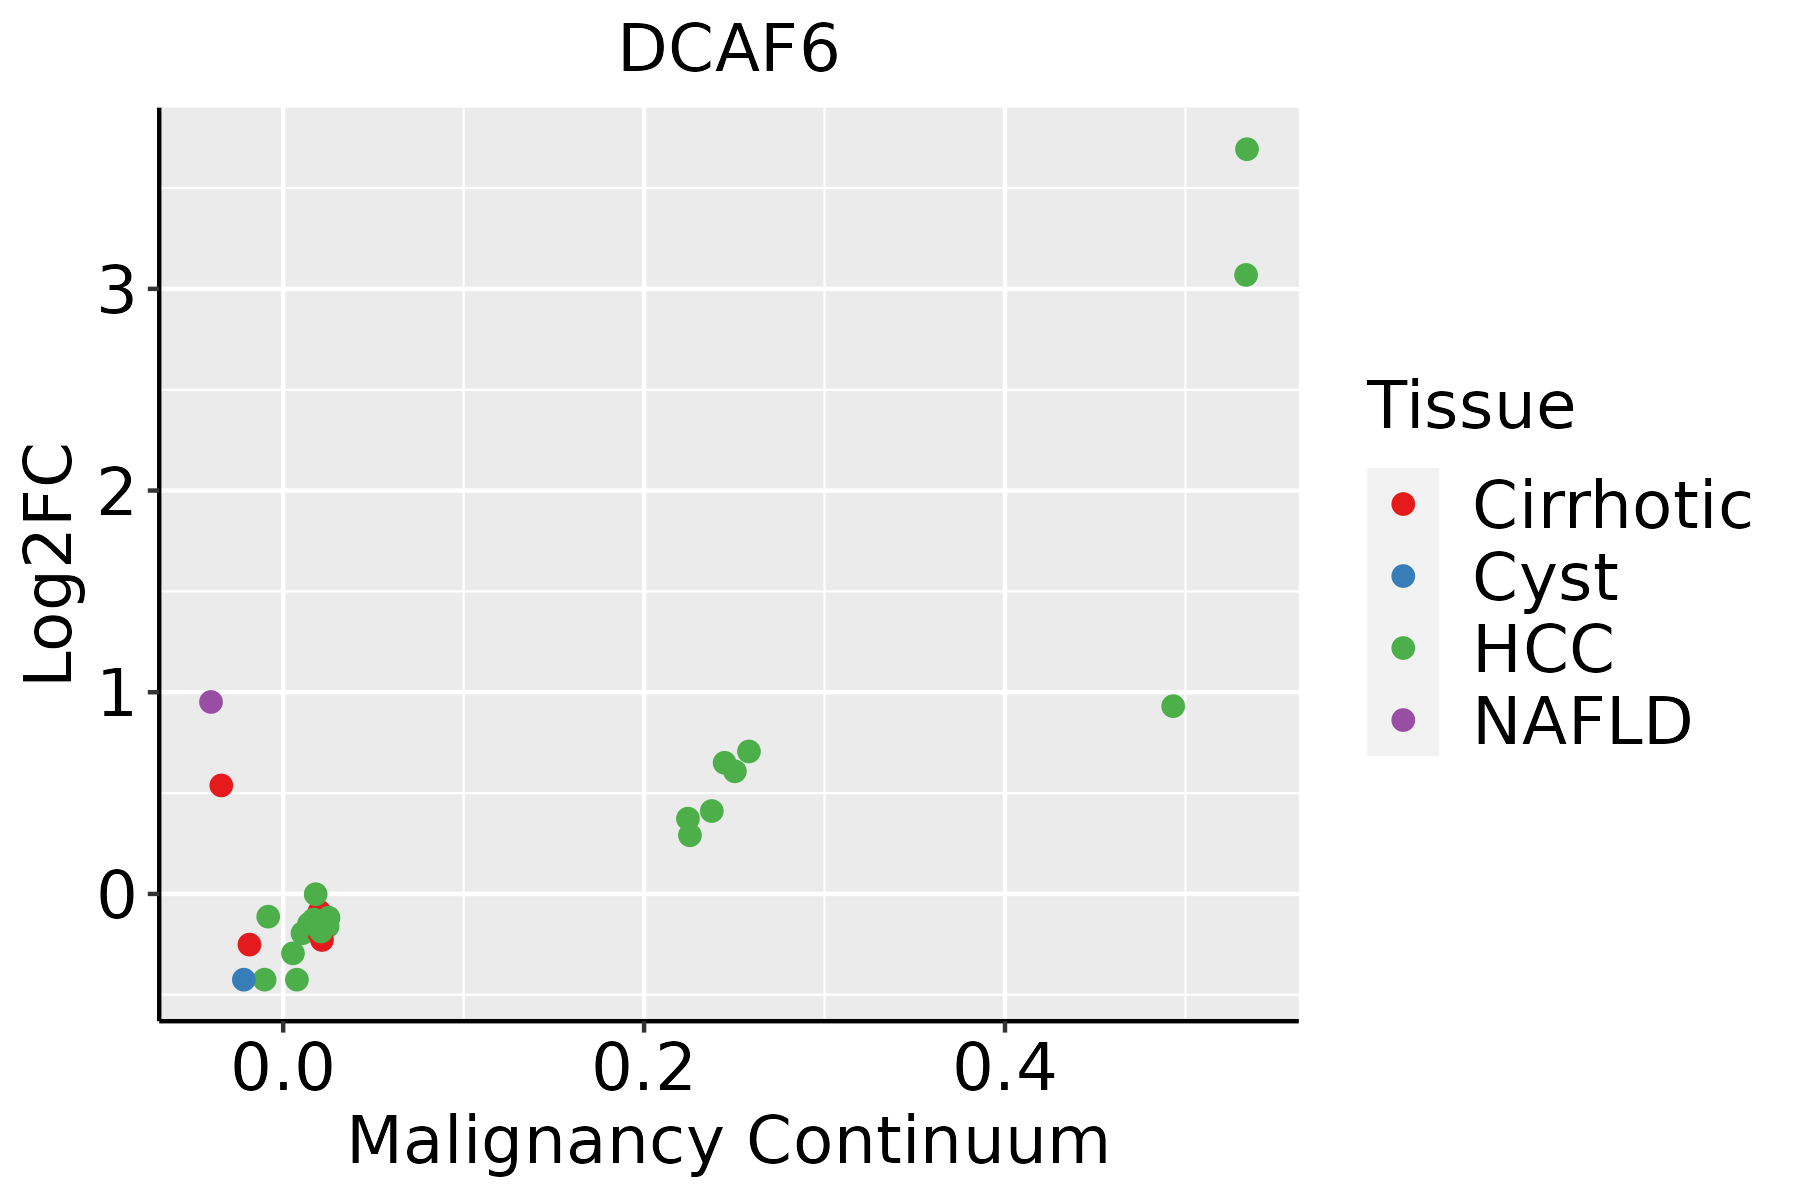 | HCC: Hepatocellular carcinoma |
| NAFLD: Non-alcoholic fatty liver disease | ||
| Lung | 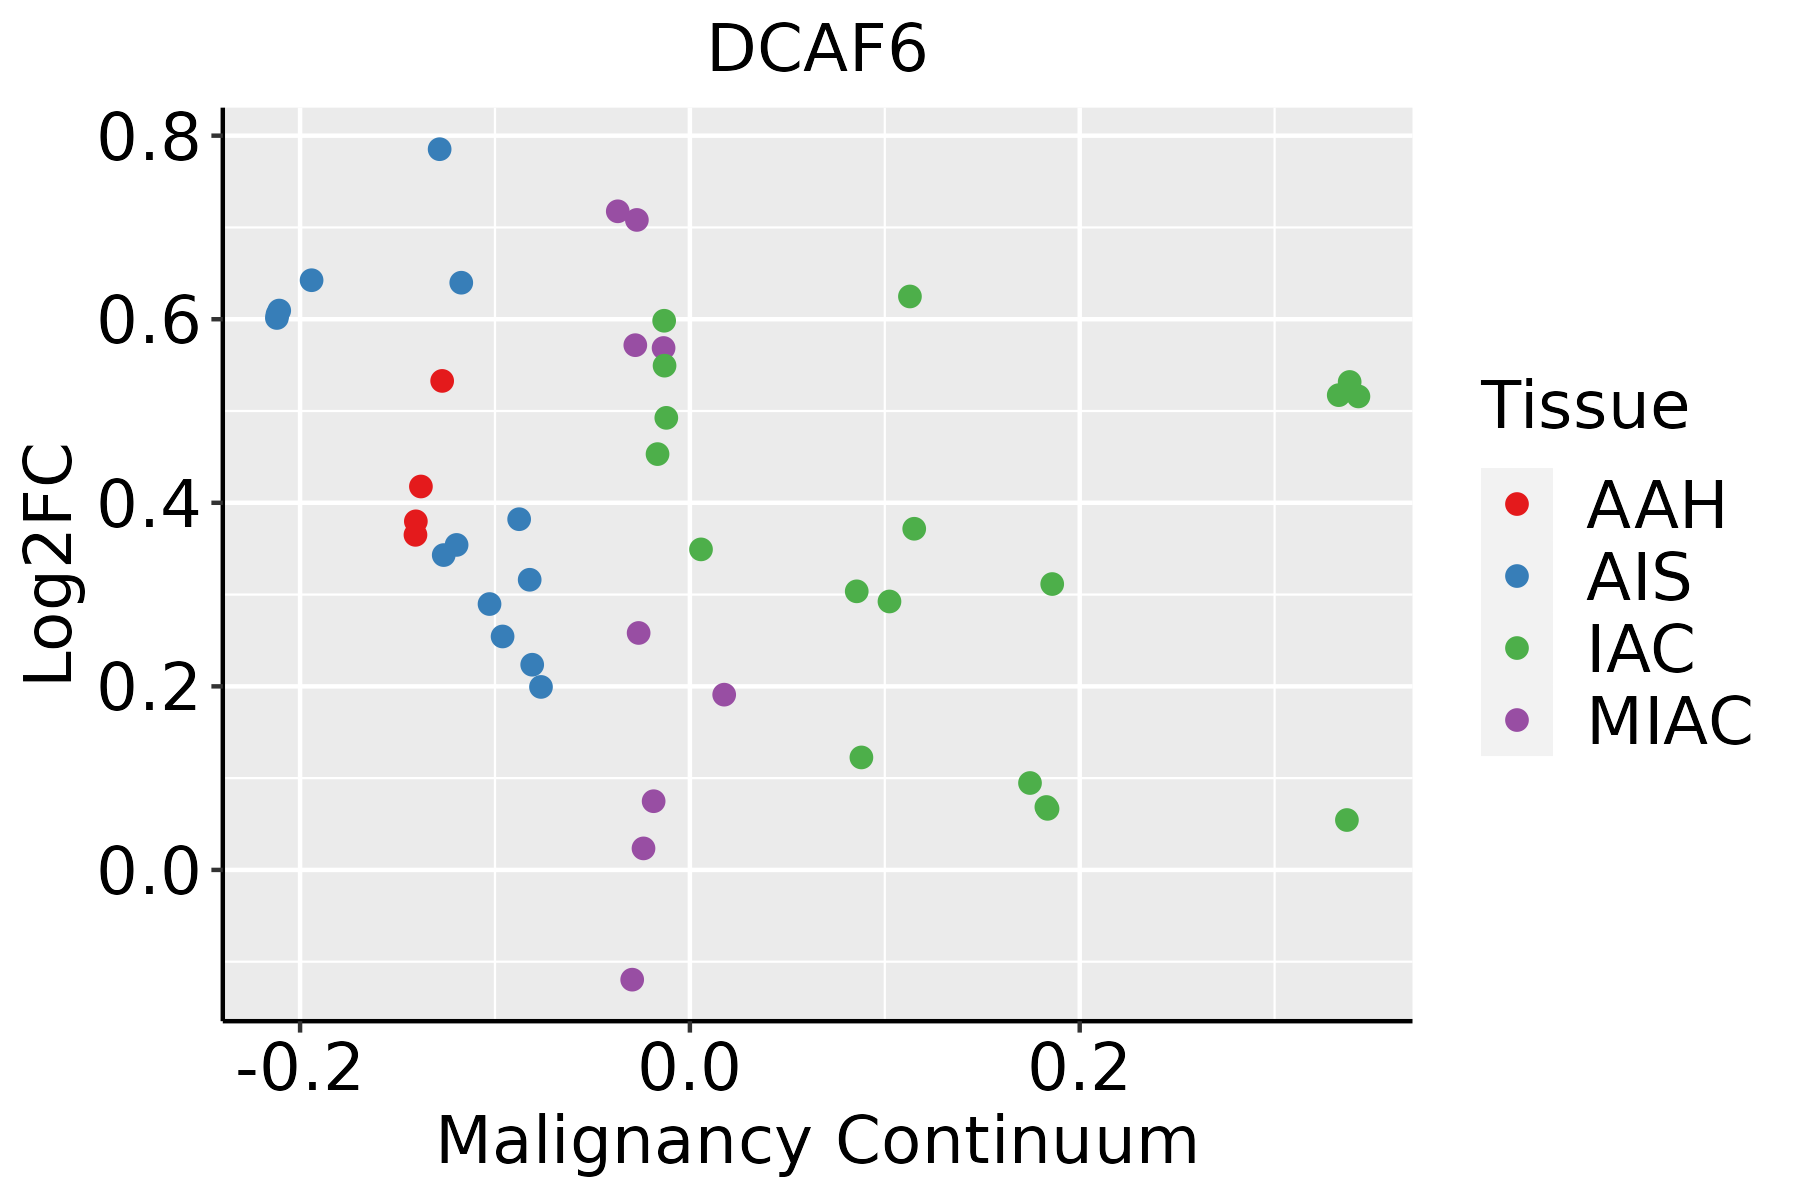 | AAH: Atypical adenomatous hyperplasia |
| AIS: Adenocarcinoma in situ | ||
| IAC: Invasive lung adenocarcinoma | ||
| MIA: Minimally invasive adenocarcinoma | ||
| Oral Cavity | 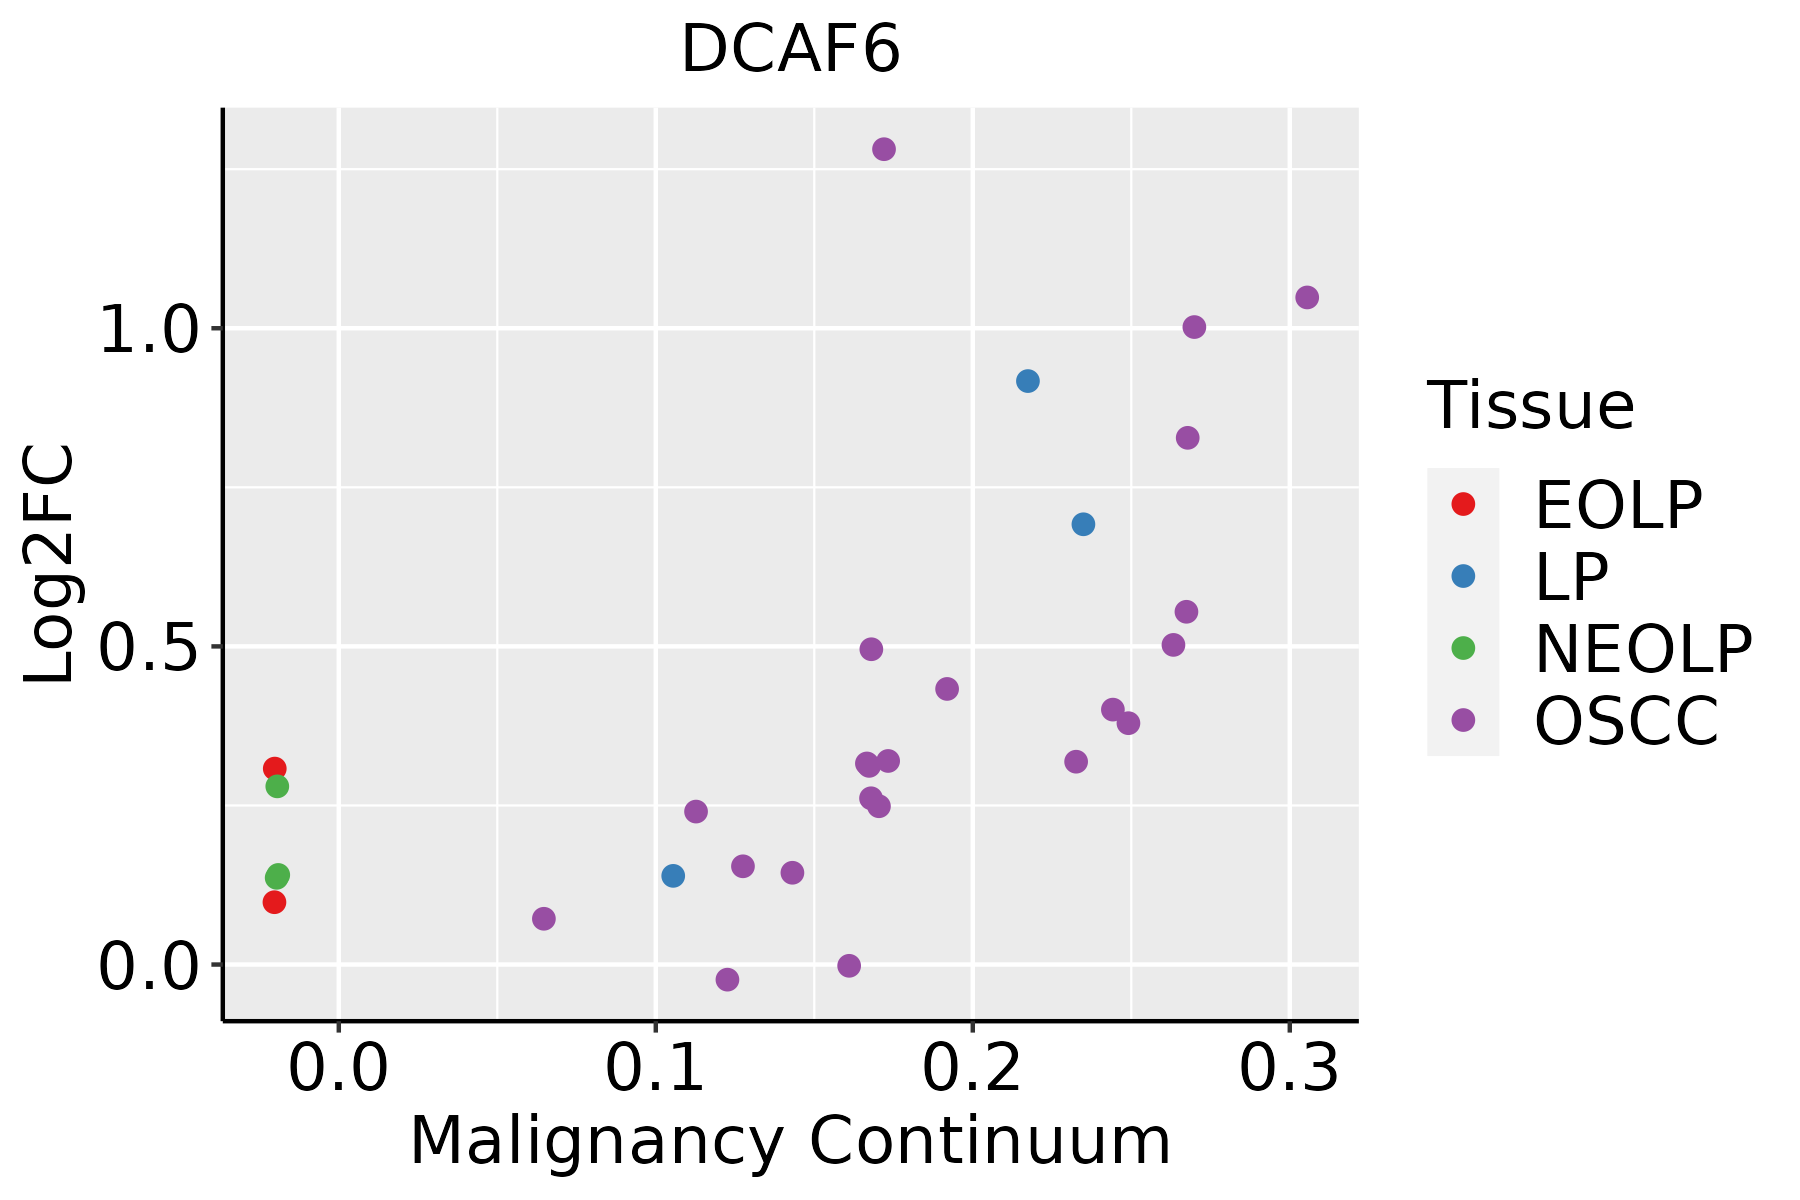 | EOLP: Erosive Oral lichen planus |
| LP: leukoplakia | ||
| NEOLP: Non-erosive oral lichen planus | ||
| OSCC: Oral squamous cell carcinoma | ||
| Prostate | 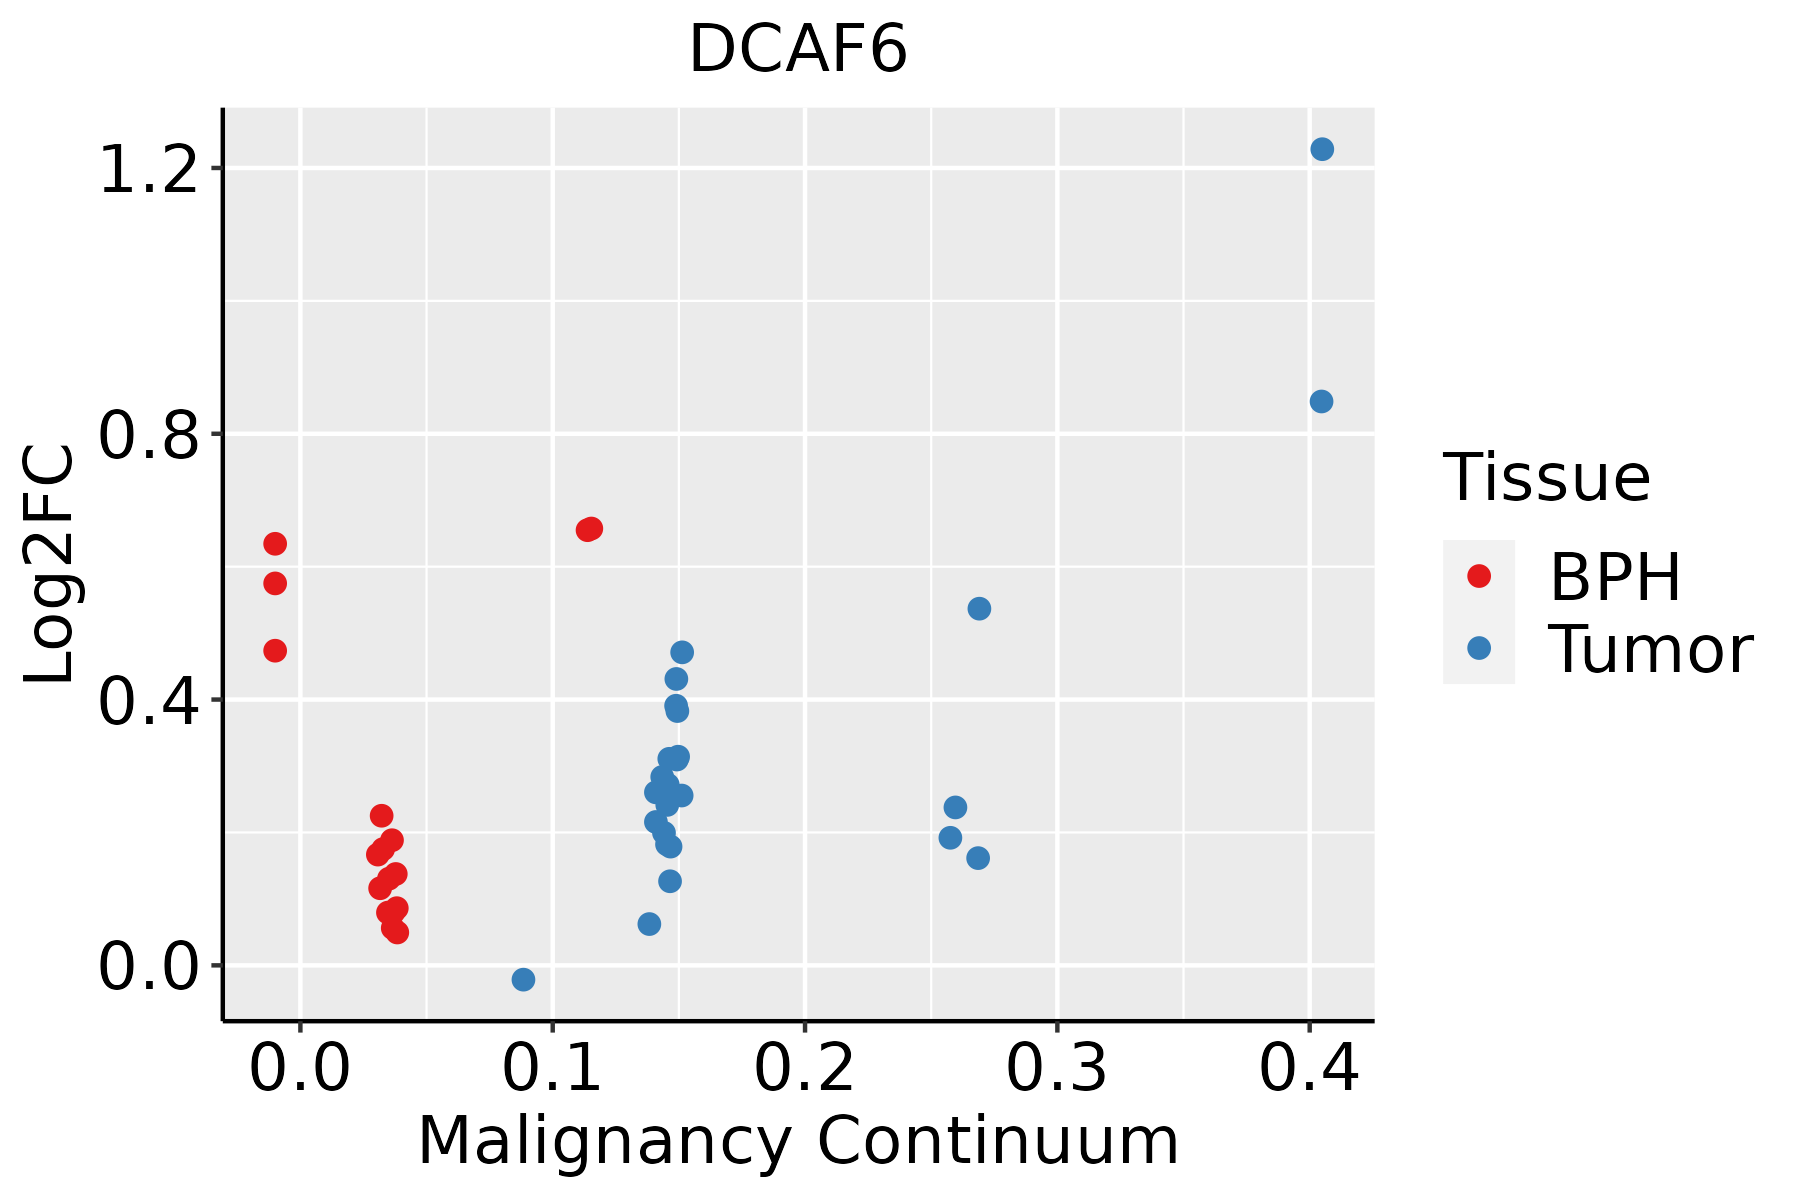 | BPH: Benign Prostatic Hyperplasia |
| Skin | 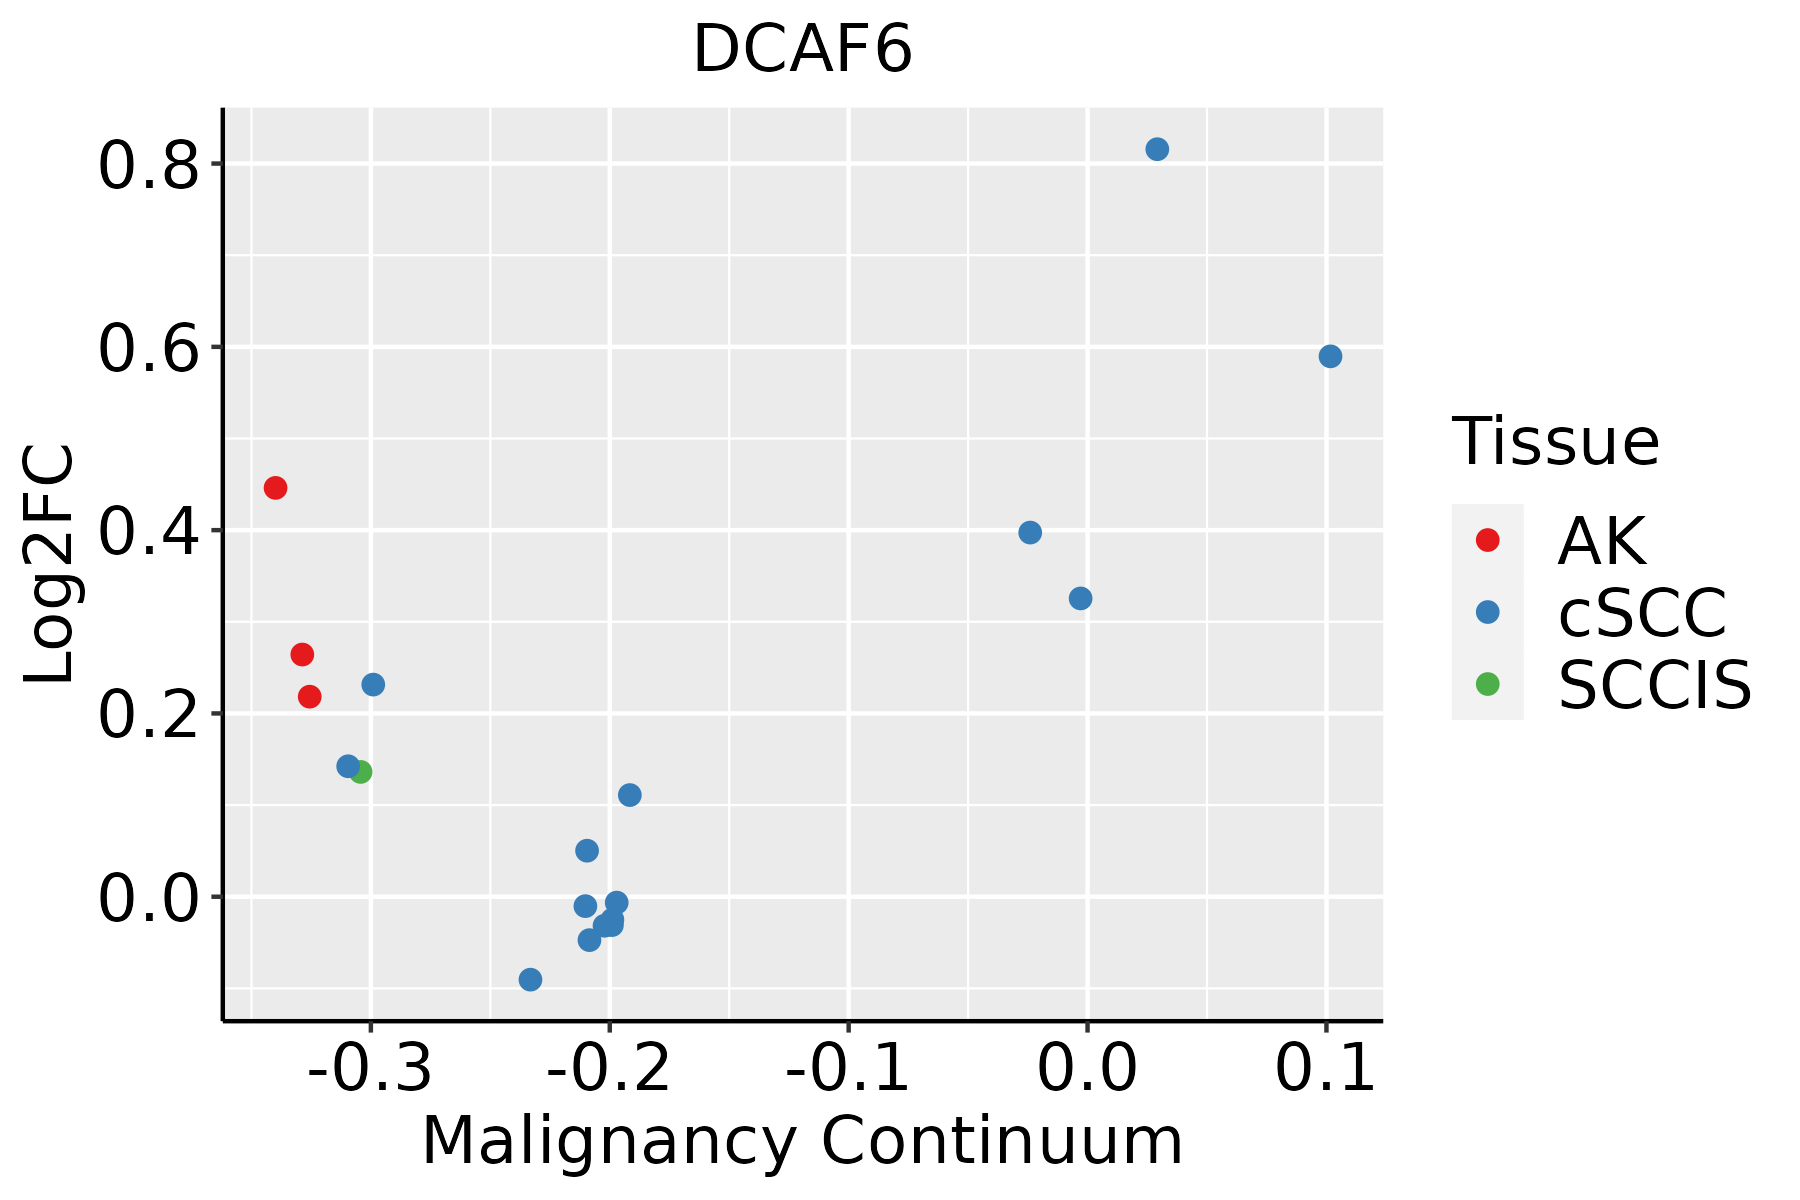 | AK: Actinic keratosis |
| cSCC: Cutaneous squamous cell carcinoma | ||
| SCCIS:squamous cell carcinoma in situ | ||
| Thyroid |  | ATC: Anaplastic thyroid cancer |
| HT: Hashimoto's thyroiditis | ||
| PTC: Papillary thyroid cancer |
| ∗log2FC in expression of this searched gene in stem-like cells from each diseased tissue sample relative to stem-like cells in normal samples in each tissue plotted against the malignancy continuum. Samples are colored based on if they are from different disease stage. |
Top |
Malignant transformation related pathway analysis |
| Find out the enriched GO biological processes and KEGG pathways involved in transition from healthy to precancer to cancer |
| Tissue | Disease Stage | Enriched GO biological Processes |
| Colorectum | AD |  |
| Colorectum | SER |  |
| Colorectum | MSS |  |
| Colorectum | MSI-H |  |
| Colorectum | FAP |  |
| ∗Top 15 enriched GO BP terms are showed in the bar plot of each disease state in each tissue. Each row represents a significant GO biological process which is colored according to the -log10(p.adjust). |
| Page: 1 2 3 4 5 6 7 8 9 |
| GO ID | Tissue | Disease Stage | Description | Gene Ratio | Bg Ratio | pvalue | p.adjust | Count |
| Page: 1 |
| Pathway ID | Tissue | Disease Stage | Description | Gene Ratio | Bg Ratio | pvalue | p.adjust | qvalue | Count |
| Page: 1 |
Top |
Cell-cell communication analysis |
| Identification of potential cell-cell interactions between two cell types and their ligand-receptor pairs for different disease states |
| Ligand | Receptor | LRpair | Pathway | Tissue | Disease Stage |
| Page: 1 |
Top |
Single-cell gene regulatory network inference analysis |
| Find out the significant the regulons (TFs) and the target genes of each regulon across cell types for different disease states |
| TF | Cell Type | Tissue | Disease Stage | Target Gene | RSS | Regulon Activity |
| ∗The dot plots of a searched regulon are shown for all cell subpopulations in each disease state of each tissue based on the regulon specific score inferred using pySCENIC and by calculating the average expression. |
| Page: 1 |
Top |
Somatic mutation of malignant transformation related genes |
| Annotation of somatic variants for genes involved in malignant transformation |
| Hugo Symbol | Variant Class | Variant Classification | dbSNP RS | HGVSc | HGVSp | HGVSp Short | SWISSPROT | BIOTYPE | SIFT | PolyPhen | Tumor Sample Barcode | Tissue | Histology | Sex | Age | Stage | Therapy Types | Drugs | Outcome |
| DCAF6 | SNV | Missense_Mutation | c.1189N>G | p.Thr397Ala | p.T397A | Q58WW2 | protein_coding | tolerated(0.17) | benign(0) | TCGA-A8-A09Z-01 | Breast | breast invasive carcinoma | Female | >=65 | I/II | Unknown | Unknown | SD | |
| DCAF6 | SNV | Missense_Mutation | novel | c.2701G>A | p.Glu901Lys | p.E901K | Q58WW2 | protein_coding | tolerated(0.09) | benign(0.266) | TCGA-AN-A046-01 | Breast | breast invasive carcinoma | Female | >=65 | I/II | Unknown | Unknown | SD |
| DCAF6 | SNV | Missense_Mutation | rs765173203 | c.584C>T | p.Thr195Met | p.T195M | Q58WW2 | protein_coding | deleterious(0.01) | probably_damaging(0.998) | TCGA-BH-A18G-01 | Breast | breast invasive carcinoma | Female | >=65 | I/II | Unknown | Unknown | SD |
| DCAF6 | SNV | Missense_Mutation | c.1258N>G | p.Gln420Glu | p.Q420E | Q58WW2 | protein_coding | tolerated_low_confidence(0.13) | benign(0.074) | TCGA-D8-A1JA-01 | Breast | breast invasive carcinoma | Female | <65 | III/IV | Chemotherapy | adriamycin | PD | |
| DCAF6 | SNV | Missense_Mutation | c.190G>A | p.Glu64Lys | p.E64K | Q58WW2 | protein_coding | deleterious(0.01) | probably_damaging(0.991) | TCGA-D8-A1JH-01 | Breast | breast invasive carcinoma | Female | <65 | I/II | Hormone Therapy | nolvadex | SD | |
| DCAF6 | SNV | Missense_Mutation | c.2393C>T | p.Pro798Leu | p.P798L | Q58WW2 | protein_coding | tolerated(0.15) | possibly_damaging(0.478) | TCGA-E2-A1L6-01 | Breast | breast invasive carcinoma | Female | <65 | I/II | Chemotherapy | cyclophosphamide | SD | |
| DCAF6 | insertion | Nonsense_Mutation | novel | c.2762_2763insAACTCTACTTTCTTA | p.Met921delinsIleThrLeuLeuSerTer | p.M921delinsITLLS* | Q58WW2 | protein_coding | TCGA-AN-A0FN-01 | Breast | breast invasive carcinoma | Female | <65 | I/II | Unknown | Unknown | SD | ||
| DCAF6 | insertion | In_Frame_Ins | novel | c.2763_2764insCAAAAGAGTTTTTTCTTTATTGGTTTC | p.Met921_Leu922insGlnLysSerPhePhePheIleGlyPhe | p.M921_L922insQKSFFFIGF | Q58WW2 | protein_coding | TCGA-AN-A0FN-01 | Breast | breast invasive carcinoma | Female | <65 | I/II | Unknown | Unknown | SD | ||
| DCAF6 | SNV | Missense_Mutation | rs745578537 | c.1244N>T | p.Ser415Phe | p.S415F | Q58WW2 | protein_coding | deleterious_low_confidence(0.01) | possibly_damaging(0.837) | TCGA-C5-A1MK-01 | Cervix | cervical & endocervical cancer | Female | >=65 | III/IV | Chemotherapy | carboplatin | PD |
| DCAF6 | SNV | Missense_Mutation | c.1258C>G | p.Gln420Glu | p.Q420E | Q58WW2 | protein_coding | tolerated_low_confidence(0.13) | benign(0.074) | TCGA-C5-A1MN-01 | Cervix | cervical & endocervical cancer | Female | <65 | III/IV | Chemotherapy | cisplatin | SD |
| Page: 1 2 3 4 5 6 7 8 9 10 11 |
Top |
Related drugs of malignant transformation related genes |
| Identification of chemicals and drugs interact with genes involved in malignant transfromation |
| (DGIdb 4.0) |
| Entrez ID | Symbol | Category | Interaction Types | Drug Claim Name | Drug Name | PMIDs |
| Page: 1 |

Copyright 2023-Present -The University of Texas Health Science Center at Houston |