
|
|||||
|
 | |
| |
| |
| |
| |
| |
|
Gene: DCAF4L2 |
Gene summary for DCAF4L2 |
| Gene information | Species | Human | Gene symbol | DCAF4L2 | Gene ID | 138009 |
| Gene name | DDB1 and CUL4 associated factor 4 like 2 | |
| Gene Alias | WDR21C | |
| Cytomap | 8q21.3 | |
| Gene Type | protein-coding | GO ID | NA | UniProtAcc | Q8NA75 |
Top |
Malignant transformation analysis |
| Identification of the aberrant gene expression in precancerous and cancerous lesions by comparing the gene expression of stem-like cells in diseased tissues with normal stem cells |
| Entrez ID | Symbol | Replicates | Species | Organ | Tissue | Adj P-value | Log2FC | Malignancy |
| 138009 | DCAF4L2 | HCC1_Meng | Human | Liver | HCC | 1.05e-05 | 2.46e-02 | 0.0246 |
| 138009 | DCAF4L2 | HCC2 | Human | Liver | HCC | 6.53e-39 | 4.82e+00 | 0.5341 |
| 138009 | DCAF4L2 | HCC5 | Human | Liver | HCC | 2.02e-03 | 1.45e+00 | 0.4932 |
| 138009 | DCAF4L2 | S014 | Human | Liver | HCC | 1.28e-54 | 1.53e+00 | 0.2254 |
| 138009 | DCAF4L2 | S015 | Human | Liver | HCC | 5.33e-45 | 1.63e+00 | 0.2375 |
| 138009 | DCAF4L2 | S016 | Human | Liver | HCC | 8.86e-55 | 1.45e+00 | 0.2243 |
| Page: 1 |
| Tissue | Expression Dynamics | Abbreviation |
| Liver | 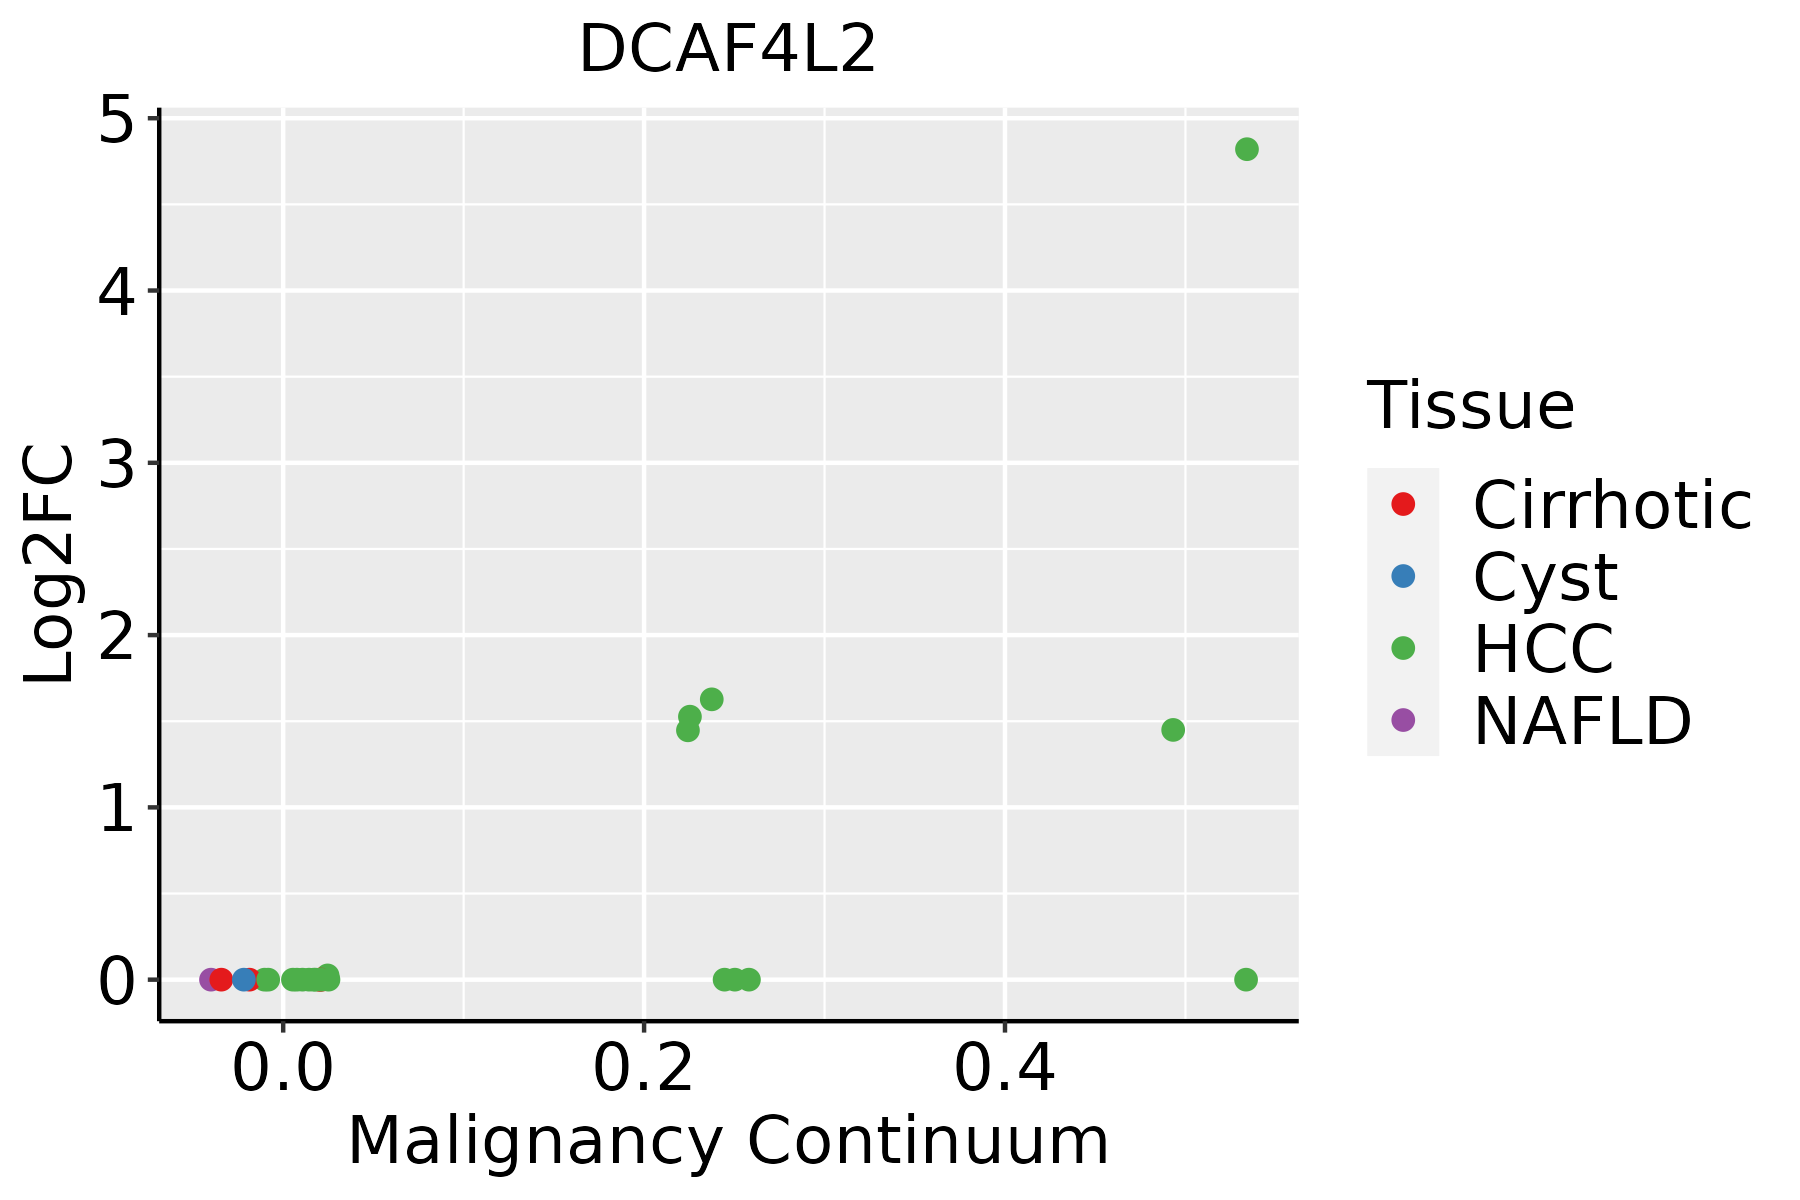 | HCC: Hepatocellular carcinoma |
| NAFLD: Non-alcoholic fatty liver disease |
| ∗log2FC in expression of this searched gene in stem-like cells from each diseased tissue sample relative to stem-like cells in normal samples in each tissue plotted against the malignancy continuum. Samples are colored based on if they are from different disease stage. |
Top |
Malignant transformation related pathway analysis |
| Find out the enriched GO biological processes and KEGG pathways involved in transition from healthy to precancer to cancer |
| Tissue | Disease Stage | Enriched GO biological Processes |
| Colorectum | AD |  |
| Colorectum | SER |  |
| Colorectum | MSS |  |
| Colorectum | MSI-H |  |
| Colorectum | FAP |  |
| ∗Top 15 enriched GO BP terms are showed in the bar plot of each disease state in each tissue. Each row represents a significant GO biological process which is colored according to the -log10(p.adjust). |
| Page: 1 2 3 4 5 6 7 8 9 |
| GO ID | Tissue | Disease Stage | Description | Gene Ratio | Bg Ratio | pvalue | p.adjust | Count |
| Page: 1 |
| Pathway ID | Tissue | Disease Stage | Description | Gene Ratio | Bg Ratio | pvalue | p.adjust | qvalue | Count |
| Page: 1 |
Top |
Cell-cell communication analysis |
| Identification of potential cell-cell interactions between two cell types and their ligand-receptor pairs for different disease states |
| Ligand | Receptor | LRpair | Pathway | Tissue | Disease Stage |
| Page: 1 |
Top |
Single-cell gene regulatory network inference analysis |
| Find out the significant the regulons (TFs) and the target genes of each regulon across cell types for different disease states |
| TF | Cell Type | Tissue | Disease Stage | Target Gene | RSS | Regulon Activity |
| ∗The dot plots of a searched regulon are shown for all cell subpopulations in each disease state of each tissue based on the regulon specific score inferred using pySCENIC and by calculating the average expression. |
| Page: 1 |
Top |
Somatic mutation of malignant transformation related genes |
| Annotation of somatic variants for genes involved in malignant transformation |
| Hugo Symbol | Variant Class | Variant Classification | dbSNP RS | HGVSc | HGVSp | HGVSp Short | SWISSPROT | BIOTYPE | SIFT | PolyPhen | Tumor Sample Barcode | Tissue | Histology | Sex | Age | Stage | Therapy Types | Drugs | Outcome |
| DCAF4L2 | SNV | Missense_Mutation | c.985G>A | p.Val329Met | p.V329M | Q8NA75 | protein_coding | deleterious(0.01) | benign(0.028) | TCGA-A2-A0D1-01 | Breast | breast invasive carcinoma | Female | >=65 | I/II | Chemotherapy | taxotere | SD | |
| DCAF4L2 | SNV | Missense_Mutation | rs369661300 | c.226N>T | p.Arg76Cys | p.R76C | Q8NA75 | protein_coding | deleterious(0) | benign(0.326) | TCGA-A8-A08B-01 | Breast | breast invasive carcinoma | Female | <65 | I/II | Chemotherapy | 5-fluorouracil | CR |
| DCAF4L2 | SNV | Missense_Mutation | c.958N>A | p.Val320Met | p.V320M | Q8NA75 | protein_coding | deleterious(0.01) | benign(0.095) | TCGA-A8-A09N-01 | Breast | breast invasive carcinoma | Female | <65 | III/IV | Unknown | Unknown | SD | |
| DCAF4L2 | SNV | Missense_Mutation | c.989N>T | p.Ala330Val | p.A330V | Q8NA75 | protein_coding | tolerated(1) | benign(0) | TCGA-AR-A0TV-01 | Breast | breast invasive carcinoma | Female | >=65 | I/II | Unknown | Unknown | SD | |
| DCAF4L2 | SNV | Missense_Mutation | c.760N>T | p.Arg254Cys | p.R254C | Q8NA75 | protein_coding | deleterious(0) | probably_damaging(0.995) | TCGA-BH-A0HA-01 | Breast | breast invasive carcinoma | Female | <65 | I/II | Unknown | Unknown | SD | |
| DCAF4L2 | SNV | Missense_Mutation | c.541C>A | p.Gln181Lys | p.Q181K | Q8NA75 | protein_coding | tolerated(1) | benign(0.006) | TCGA-C8-A131-01 | Breast | breast invasive carcinoma | Female | >=65 | III/IV | Chemotherapy | 5-fluorouracil | CR | |
| DCAF4L2 | SNV | Missense_Mutation | rs764483453 | c.587N>T | p.Ala196Val | p.A196V | Q8NA75 | protein_coding | tolerated(0.46) | benign(0.233) | TCGA-D8-A1XQ-01 | Breast | breast invasive carcinoma | Female | >=65 | I/II | Unknown | Unknown | SD |
| DCAF4L2 | SNV | Missense_Mutation | c.113G>A | p.Arg38Lys | p.R38K | Q8NA75 | protein_coding | tolerated(0.23) | benign(0) | TCGA-E2-A10C-01 | Breast | breast invasive carcinoma | Female | <65 | I/II | Chemotherapy | cytoxan | SD | |
| DCAF4L2 | SNV | Missense_Mutation | c.709N>T | p.Pro237Ser | p.P237S | Q8NA75 | protein_coding | deleterious(0.01) | probably_damaging(0.917) | TCGA-E9-A1R5-01 | Breast | breast invasive carcinoma | Female | <65 | I/II | Hormone Therapy | tamoxiphen | SD | |
| DCAF4L2 | SNV | Missense_Mutation | novel | c.716N>C | p.Leu239Pro | p.L239P | Q8NA75 | protein_coding | deleterious(0) | probably_damaging(0.999) | TCGA-EW-A1PH-01 | Breast | breast invasive carcinoma | Female | <65 | I/II | Chemotherapy | cyclophosphamide | SD |
| Page: 1 2 3 4 5 6 7 8 9 10 11 12 13 14 15 16 17 18 19 20 21 |
Top |
Related drugs of malignant transformation related genes |
| Identification of chemicals and drugs interact with genes involved in malignant transfromation |
| (DGIdb 4.0) |
| Entrez ID | Symbol | Category | Interaction Types | Drug Claim Name | Drug Name | PMIDs |
| Page: 1 |

Copyright 2023-Present -The University of Texas Health Science Center at Houston |