
|
|||||
|
 | |
| |
| |
| |
| |
| |
|
Gene: DCAF4 |
Gene summary for DCAF4 |
| Gene information | Species | Human | Gene symbol | DCAF4 | Gene ID | 26094 |
| Gene name | DDB1 and CUL4 associated factor 4 | |
| Gene Alias | WDR21 | |
| Cytomap | 14q24.2 | |
| Gene Type | protein-coding | GO ID | GO:0006464 | UniProtAcc | B2RDD6 |
Top |
Malignant transformation analysis |
| Identification of the aberrant gene expression in precancerous and cancerous lesions by comparing the gene expression of stem-like cells in diseased tissues with normal stem cells |
| Entrez ID | Symbol | Replicates | Species | Organ | Tissue | Adj P-value | Log2FC | Malignancy |
| 26094 | DCAF4 | LZE4T | Human | Esophagus | ESCC | 5.15e-07 | 1.53e-01 | 0.0811 |
| 26094 | DCAF4 | LZE24T | Human | Esophagus | ESCC | 2.29e-06 | 1.00e-01 | 0.0596 |
| 26094 | DCAF4 | P2T-E | Human | Esophagus | ESCC | 5.64e-13 | 1.51e-01 | 0.1177 |
| 26094 | DCAF4 | P4T-E | Human | Esophagus | ESCC | 2.32e-06 | 9.36e-02 | 0.1323 |
| 26094 | DCAF4 | P5T-E | Human | Esophagus | ESCC | 5.12e-07 | 6.75e-02 | 0.1327 |
| 26094 | DCAF4 | P8T-E | Human | Esophagus | ESCC | 5.28e-06 | 9.26e-02 | 0.0889 |
| 26094 | DCAF4 | P10T-E | Human | Esophagus | ESCC | 3.03e-12 | 2.15e-01 | 0.116 |
| 26094 | DCAF4 | P12T-E | Human | Esophagus | ESCC | 1.10e-12 | 1.70e-01 | 0.1122 |
| 26094 | DCAF4 | P15T-E | Human | Esophagus | ESCC | 2.04e-16 | 3.99e-01 | 0.1149 |
| 26094 | DCAF4 | P16T-E | Human | Esophagus | ESCC | 1.07e-07 | 1.36e-01 | 0.1153 |
| 26094 | DCAF4 | P20T-E | Human | Esophagus | ESCC | 5.90e-16 | 2.47e-01 | 0.1124 |
| 26094 | DCAF4 | P21T-E | Human | Esophagus | ESCC | 6.69e-08 | 1.53e-01 | 0.1617 |
| 26094 | DCAF4 | P22T-E | Human | Esophagus | ESCC | 9.17e-03 | 7.42e-02 | 0.1236 |
| 26094 | DCAF4 | P23T-E | Human | Esophagus | ESCC | 1.28e-11 | 1.79e-01 | 0.108 |
| 26094 | DCAF4 | P24T-E | Human | Esophagus | ESCC | 9.68e-06 | 1.49e-01 | 0.1287 |
| 26094 | DCAF4 | P26T-E | Human | Esophagus | ESCC | 6.83e-04 | 1.06e-01 | 0.1276 |
| 26094 | DCAF4 | P27T-E | Human | Esophagus | ESCC | 9.79e-09 | 1.84e-01 | 0.1055 |
| 26094 | DCAF4 | P28T-E | Human | Esophagus | ESCC | 1.91e-15 | 2.71e-01 | 0.1149 |
| 26094 | DCAF4 | P30T-E | Human | Esophagus | ESCC | 9.05e-11 | 3.42e-01 | 0.137 |
| 26094 | DCAF4 | P31T-E | Human | Esophagus | ESCC | 5.06e-10 | 9.50e-02 | 0.1251 |
| Page: 1 2 3 |
| Tissue | Expression Dynamics | Abbreviation |
| Esophagus | 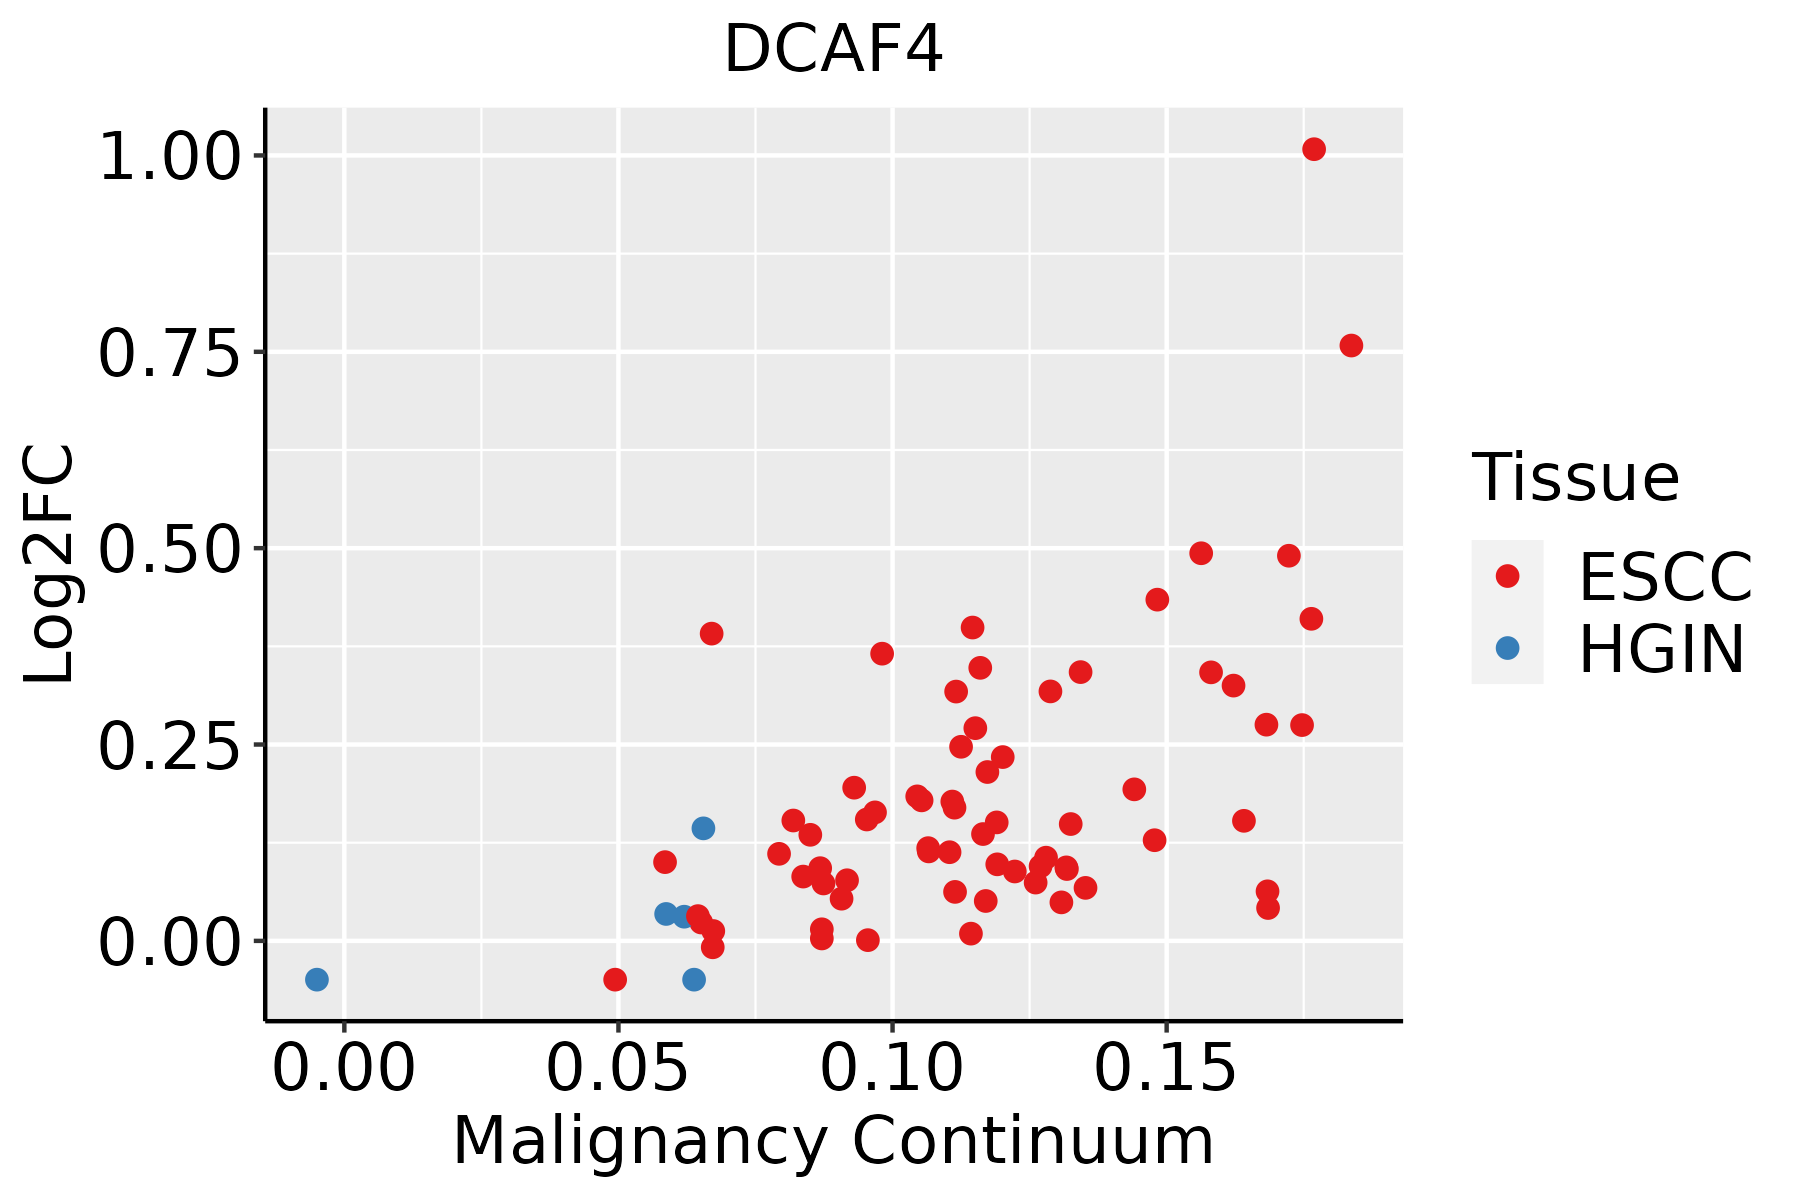 | ESCC: Esophageal squamous cell carcinoma |
| HGIN: High-grade intraepithelial neoplasias | ||
| LGIN: Low-grade intraepithelial neoplasias |
| ∗log2FC in expression of this searched gene in stem-like cells from each diseased tissue sample relative to stem-like cells in normal samples in each tissue plotted against the malignancy continuum. Samples are colored based on if they are from different disease stage. |
Top |
Malignant transformation related pathway analysis |
| Find out the enriched GO biological processes and KEGG pathways involved in transition from healthy to precancer to cancer |
| Tissue | Disease Stage | Enriched GO biological Processes |
| Colorectum | AD |  |
| Colorectum | SER |  |
| Colorectum | MSS |  |
| Colorectum | MSI-H |  |
| Colorectum | FAP |  |
| ∗Top 15 enriched GO BP terms are showed in the bar plot of each disease state in each tissue. Each row represents a significant GO biological process which is colored according to the -log10(p.adjust). |
| Page: 1 2 3 4 5 6 7 8 9 |
| GO ID | Tissue | Disease Stage | Description | Gene Ratio | Bg Ratio | pvalue | p.adjust | Count |
| Page: 1 |
| Pathway ID | Tissue | Disease Stage | Description | Gene Ratio | Bg Ratio | pvalue | p.adjust | qvalue | Count |
| Page: 1 |
Top |
Cell-cell communication analysis |
| Identification of potential cell-cell interactions between two cell types and their ligand-receptor pairs for different disease states |
| Ligand | Receptor | LRpair | Pathway | Tissue | Disease Stage |
| Page: 1 |
Top |
Single-cell gene regulatory network inference analysis |
| Find out the significant the regulons (TFs) and the target genes of each regulon across cell types for different disease states |
| TF | Cell Type | Tissue | Disease Stage | Target Gene | RSS | Regulon Activity |
| ∗The dot plots of a searched regulon are shown for all cell subpopulations in each disease state of each tissue based on the regulon specific score inferred using pySCENIC and by calculating the average expression. |
| Page: 1 |
Top |
Somatic mutation of malignant transformation related genes |
| Annotation of somatic variants for genes involved in malignant transformation |
| Hugo Symbol | Variant Class | Variant Classification | dbSNP RS | HGVSc | HGVSp | HGVSp Short | SWISSPROT | BIOTYPE | SIFT | PolyPhen | Tumor Sample Barcode | Tissue | Histology | Sex | Age | Stage | Therapy Types | Drugs | Outcome |
| DCAF4 | SNV | Missense_Mutation | novel | c.1144G>A | p.Glu382Lys | p.E382K | Q8WV16 | protein_coding | deleterious(0) | probably_damaging(0.936) | TCGA-B6-A3ZX-01 | Breast | breast invasive carcinoma | Female | <65 | III/IV | Chemotherapy | cyclophosphamide | PD |
| DCAF4 | SNV | Missense_Mutation | rs371512823 | c.448N>T | p.Arg150Cys | p.R150C | Q8WV16 | protein_coding | deleterious(0) | possibly_damaging(0.724) | TCGA-VS-A94Z-01 | Cervix | cervical & endocervical cancer | Female | <65 | I/II | Chemotherapy | cisplatin | CR |
| DCAF4 | deletion | Frame_Shift_Del | c.267delN | p.Leu91Ter | p.L91* | Q8WV16 | protein_coding | TCGA-EA-A410-01 | Cervix | cervical & endocervical cancer | Female | <65 | I/II | Unknown | Unknown | SD | |||
| DCAF4 | SNV | Missense_Mutation | c.1433N>T | p.Ala478Val | p.A478V | Q8WV16 | protein_coding | tolerated(0.5) | benign(0.005) | TCGA-AA-3855-01 | Colorectum | colon adenocarcinoma | Male | >=65 | I/II | Unknown | Unknown | SD | |
| DCAF4 | SNV | Missense_Mutation | novel | c.643N>G | p.Phe215Val | p.F215V | Q8WV16 | protein_coding | tolerated(0.47) | benign(0.053) | TCGA-AA-3949-01 | Colorectum | colon adenocarcinoma | Female | >=65 | III/IV | Unknown | Unknown | SD |
| DCAF4 | SNV | Missense_Mutation | c.21N>T | p.Gln7His | p.Q7H | Q8WV16 | protein_coding | deleterious(0.01) | benign(0) | TCGA-AA-A01R-01 | Colorectum | colon adenocarcinoma | Male | <65 | III/IV | Chemotherapy | 5-fluorouracil | PD | |
| DCAF4 | SNV | Missense_Mutation | novel | c.93N>T | p.Arg31Ser | p.R31S | Q8WV16 | protein_coding | tolerated(0.33) | probably_damaging(0.916) | TCGA-AZ-4323-01 | Colorectum | colon adenocarcinoma | Male | <65 | III/IV | Chemotherapy | oxaliplatin | PD |
| DCAF4 | SNV | Missense_Mutation | c.1424N>T | p.Ser475Phe | p.S475F | Q8WV16 | protein_coding | tolerated(0.73) | benign(0) | TCGA-CK-4951-01 | Colorectum | colon adenocarcinoma | Female | >=65 | I/II | Unknown | Unknown | PD | |
| DCAF4 | SNV | Missense_Mutation | rs139428330 | c.1411N>T | p.Arg471Trp | p.R471W | Q8WV16 | protein_coding | deleterious(0) | possibly_damaging(0.724) | TCGA-G4-6586-01 | Colorectum | colon adenocarcinoma | Female | >=65 | I/II | Unknown | Unknown | SD |
| DCAF4 | deletion | Frame_Shift_Del | c.267delN | p.Leu91Ter | p.L91* | Q8WV16 | protein_coding | TCGA-AA-3949-01 | Colorectum | colon adenocarcinoma | Female | >=65 | III/IV | Unknown | Unknown | SD |
| Page: 1 2 3 4 5 6 |
Top |
Related drugs of malignant transformation related genes |
| Identification of chemicals and drugs interact with genes involved in malignant transfromation |
| (DGIdb 4.0) |
| Entrez ID | Symbol | Category | Interaction Types | Drug Claim Name | Drug Name | PMIDs |
| 26094 | DCAF4 | NA | corticosteroids | 22366774 |
| Page: 1 |

Copyright 2023-Present -The University of Texas Health Science Center at Houston |