
|
|||||
|
 | |
| |
| |
| |
| |
| |
|
Gene: DCAF16 |
Gene summary for DCAF16 |
| Gene information | Species | Human | Gene symbol | DCAF16 | Gene ID | 54876 |
| Gene name | DDB1 and CUL4 associated factor 16 | |
| Gene Alias | C4orf30 | |
| Cytomap | 4p15.31 | |
| Gene Type | protein-coding | GO ID | GO:0006464 | UniProtAcc | Q9NXF7 |
Top |
Malignant transformation analysis |
| Identification of the aberrant gene expression in precancerous and cancerous lesions by comparing the gene expression of stem-like cells in diseased tissues with normal stem cells |
| Entrez ID | Symbol | Replicates | Species | Organ | Tissue | Adj P-value | Log2FC | Malignancy |
| 54876 | DCAF16 | LZE7T | Human | Esophagus | ESCC | 5.85e-11 | 5.66e-01 | 0.0667 |
| 54876 | DCAF16 | LZE20T | Human | Esophagus | ESCC | 1.82e-02 | 1.41e-01 | 0.0662 |
| 54876 | DCAF16 | LZE24T | Human | Esophagus | ESCC | 3.15e-09 | 2.05e-01 | 0.0596 |
| 54876 | DCAF16 | LZE21T | Human | Esophagus | ESCC | 7.27e-03 | 1.86e-01 | 0.0655 |
| 54876 | DCAF16 | P2T-E | Human | Esophagus | ESCC | 1.36e-37 | 5.96e-01 | 0.1177 |
| 54876 | DCAF16 | P4T-E | Human | Esophagus | ESCC | 1.41e-09 | 2.49e-01 | 0.1323 |
| 54876 | DCAF16 | P5T-E | Human | Esophagus | ESCC | 2.90e-09 | 1.17e-01 | 0.1327 |
| 54876 | DCAF16 | P8T-E | Human | Esophagus | ESCC | 1.69e-16 | 2.38e-01 | 0.0889 |
| 54876 | DCAF16 | P9T-E | Human | Esophagus | ESCC | 1.02e-04 | 7.49e-02 | 0.1131 |
| 54876 | DCAF16 | P10T-E | Human | Esophagus | ESCC | 3.96e-12 | 3.32e-01 | 0.116 |
| 54876 | DCAF16 | P11T-E | Human | Esophagus | ESCC | 1.61e-02 | 1.84e-01 | 0.1426 |
| 54876 | DCAF16 | P12T-E | Human | Esophagus | ESCC | 5.76e-17 | 3.18e-01 | 0.1122 |
| 54876 | DCAF16 | P15T-E | Human | Esophagus | ESCC | 5.49e-09 | 1.90e-01 | 0.1149 |
| 54876 | DCAF16 | P16T-E | Human | Esophagus | ESCC | 1.43e-14 | 3.85e-01 | 0.1153 |
| 54876 | DCAF16 | P17T-E | Human | Esophagus | ESCC | 1.54e-04 | 2.91e-01 | 0.1278 |
| 54876 | DCAF16 | P20T-E | Human | Esophagus | ESCC | 6.34e-05 | 1.89e-01 | 0.1124 |
| 54876 | DCAF16 | P21T-E | Human | Esophagus | ESCC | 1.02e-10 | 1.32e-01 | 0.1617 |
| 54876 | DCAF16 | P22T-E | Human | Esophagus | ESCC | 6.40e-13 | 2.31e-01 | 0.1236 |
| 54876 | DCAF16 | P23T-E | Human | Esophagus | ESCC | 1.57e-12 | 3.21e-01 | 0.108 |
| 54876 | DCAF16 | P24T-E | Human | Esophagus | ESCC | 2.43e-08 | 1.69e-01 | 0.1287 |
| Page: 1 2 3 |
| Tissue | Expression Dynamics | Abbreviation |
| Esophagus | 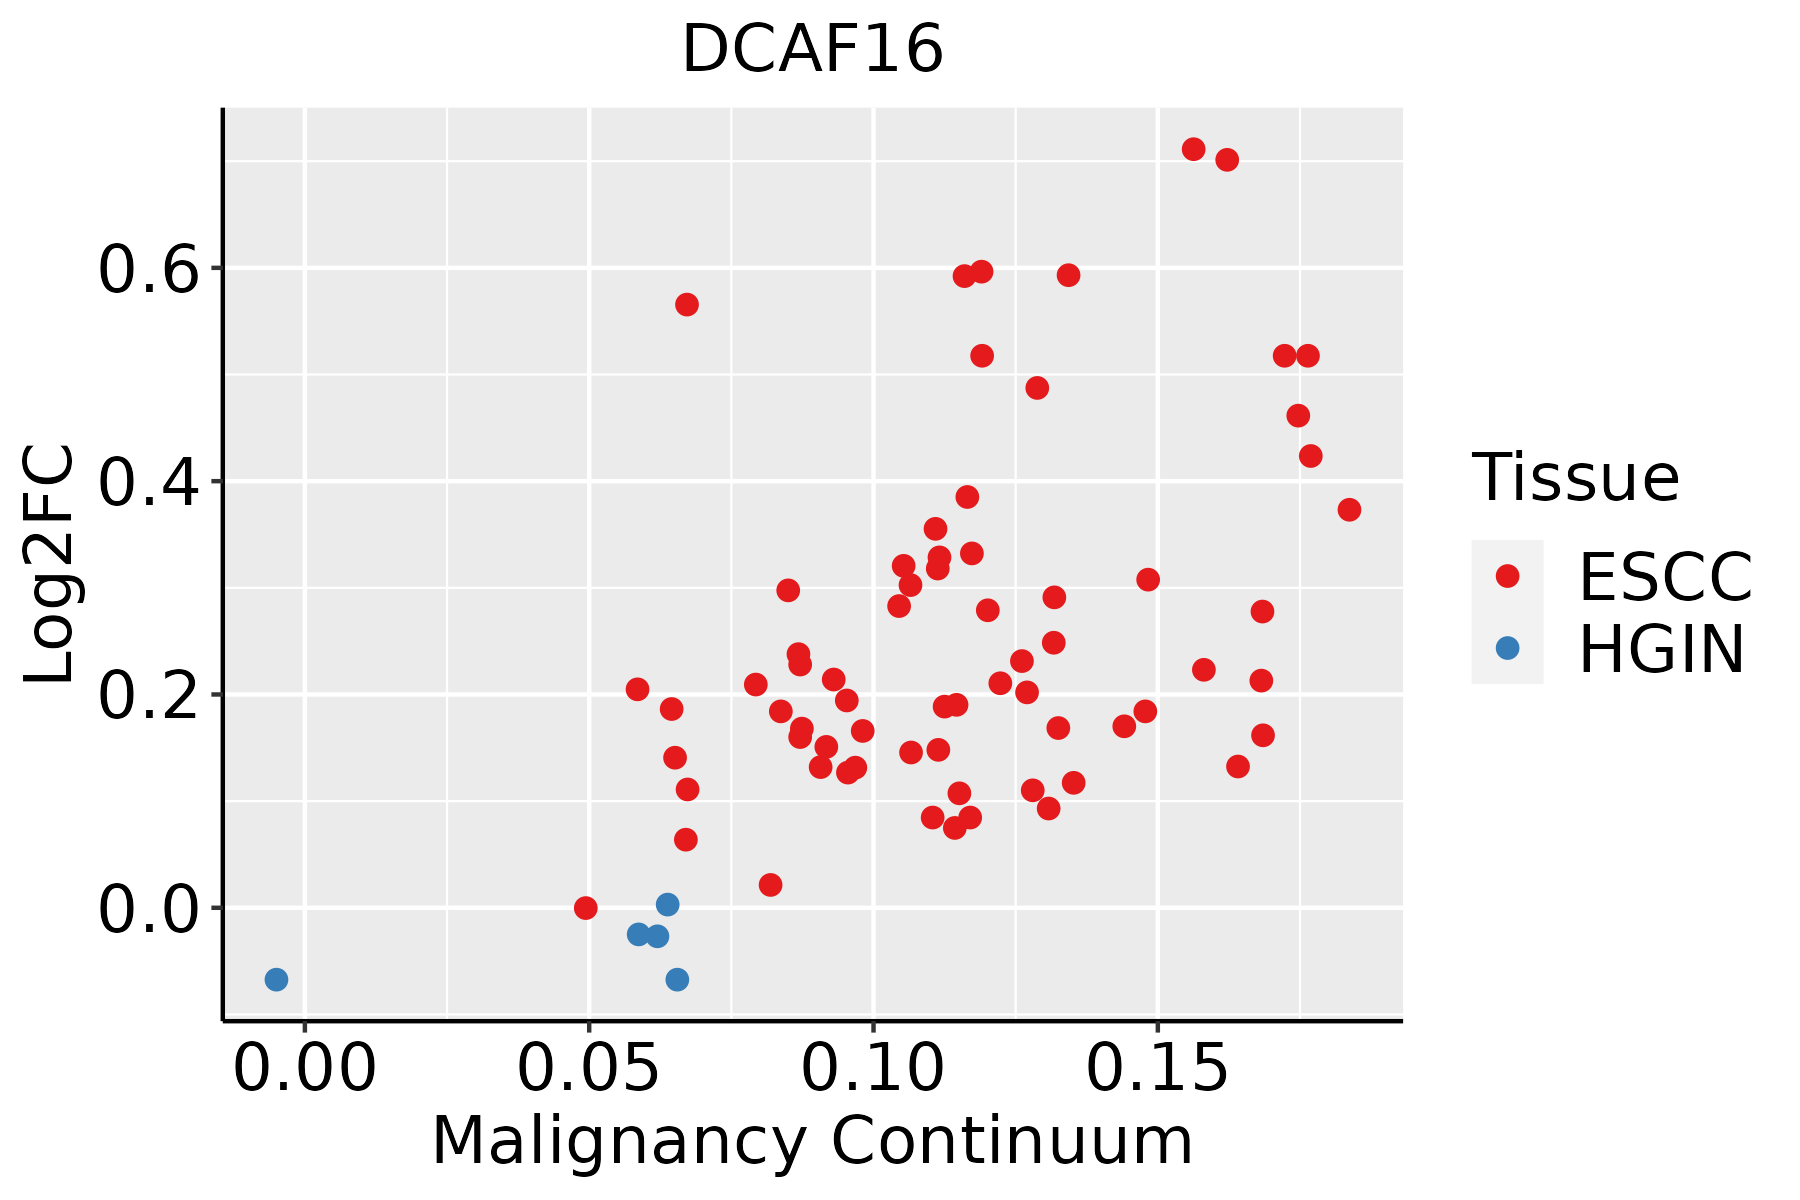 | ESCC: Esophageal squamous cell carcinoma |
| HGIN: High-grade intraepithelial neoplasias | ||
| LGIN: Low-grade intraepithelial neoplasias | ||
| Liver | 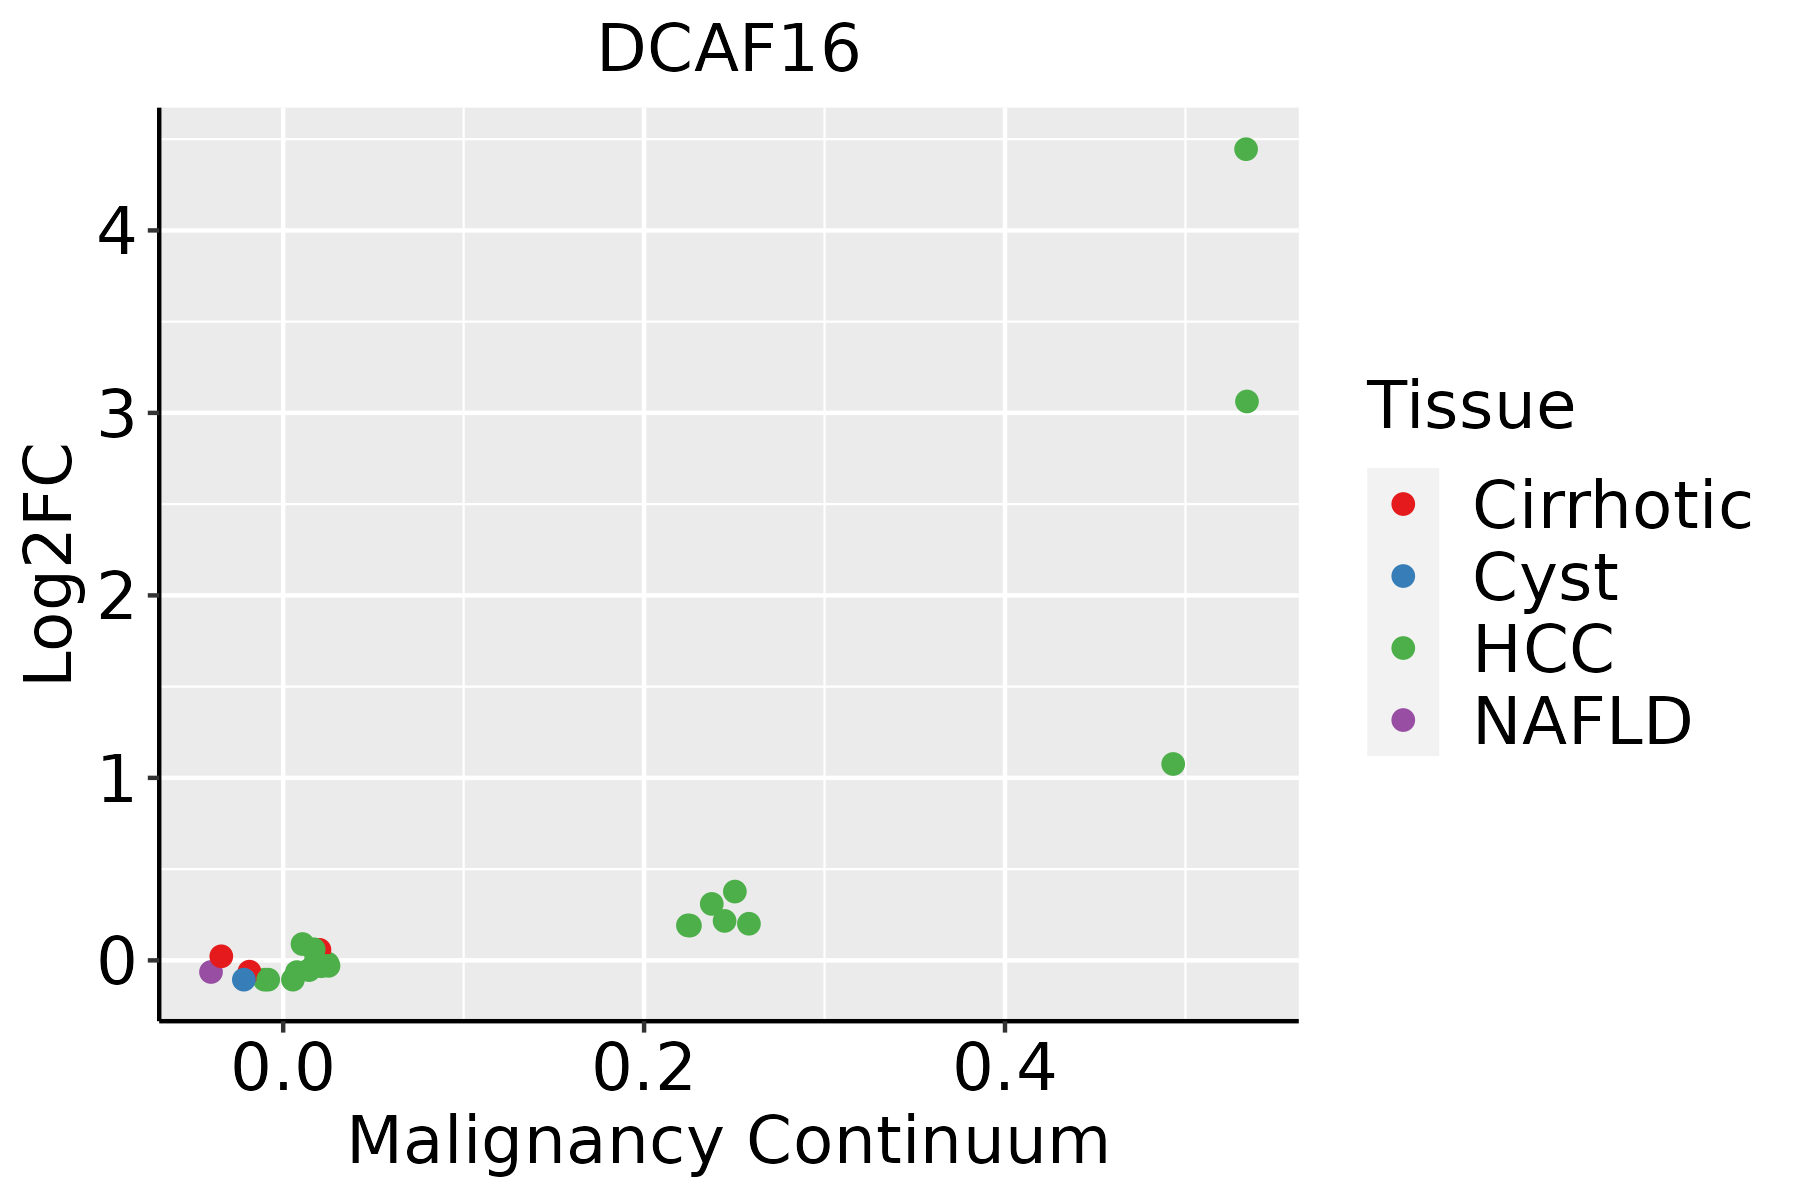 | HCC: Hepatocellular carcinoma |
| NAFLD: Non-alcoholic fatty liver disease |
| ∗log2FC in expression of this searched gene in stem-like cells from each diseased tissue sample relative to stem-like cells in normal samples in each tissue plotted against the malignancy continuum. Samples are colored based on if they are from different disease stage. |
Top |
Malignant transformation related pathway analysis |
| Find out the enriched GO biological processes and KEGG pathways involved in transition from healthy to precancer to cancer |
| Tissue | Disease Stage | Enriched GO biological Processes |
| Colorectum | AD |  |
| Colorectum | SER |  |
| Colorectum | MSS |  |
| Colorectum | MSI-H |  |
| Colorectum | FAP |  |
| ∗Top 15 enriched GO BP terms are showed in the bar plot of each disease state in each tissue. Each row represents a significant GO biological process which is colored according to the -log10(p.adjust). |
| Page: 1 2 3 4 5 6 7 8 9 |
| GO ID | Tissue | Disease Stage | Description | Gene Ratio | Bg Ratio | pvalue | p.adjust | Count |
| Page: 1 |
| Pathway ID | Tissue | Disease Stage | Description | Gene Ratio | Bg Ratio | pvalue | p.adjust | qvalue | Count |
| Page: 1 |
Top |
Cell-cell communication analysis |
| Identification of potential cell-cell interactions between two cell types and their ligand-receptor pairs for different disease states |
| Ligand | Receptor | LRpair | Pathway | Tissue | Disease Stage |
| Page: 1 |
Top |
Single-cell gene regulatory network inference analysis |
| Find out the significant the regulons (TFs) and the target genes of each regulon across cell types for different disease states |
| TF | Cell Type | Tissue | Disease Stage | Target Gene | RSS | Regulon Activity |
| ∗The dot plots of a searched regulon are shown for all cell subpopulations in each disease state of each tissue based on the regulon specific score inferred using pySCENIC and by calculating the average expression. |
| Page: 1 |
Top |
Somatic mutation of malignant transformation related genes |
| Annotation of somatic variants for genes involved in malignant transformation |
| Hugo Symbol | Variant Class | Variant Classification | dbSNP RS | HGVSc | HGVSp | HGVSp Short | SWISSPROT | BIOTYPE | SIFT | PolyPhen | Tumor Sample Barcode | Tissue | Histology | Sex | Age | Stage | Therapy Types | Drugs | Outcome |
| DCAF16 | insertion | Nonsense_Mutation | novel | c.489_490insCAGTCTCAAAAAAAAAAAAGGAGAATTAGTTAAGG | p.Glu164GlnfsTer11 | p.E164Qfs*11 | Q9NXF7 | protein_coding | TCGA-A7-A0D9-01 | Breast | breast invasive carcinoma | Female | <65 | I/II | Chemotherapy | taxotere | SD | ||
| DCAF16 | SNV | Missense_Mutation | novel | c.407N>A | p.Arg136Lys | p.R136K | Q9NXF7 | protein_coding | deleterious_low_confidence(0) | possibly_damaging(0.866) | TCGA-VS-A8EL-01 | Cervix | cervical & endocervical cancer | Female | <65 | I/II | Chemotherapy | cisplatin | CR |
| DCAF16 | SNV | Missense_Mutation | novel | c.148N>C | p.Glu50Gln | p.E50Q | Q9NXF7 | protein_coding | tolerated_low_confidence(0.05) | benign(0.026) | TCGA-ZJ-AAXU-01 | Cervix | cervical & endocervical cancer | Female | <65 | I/II | Unknown | Unknown | SD |
| DCAF16 | SNV | Missense_Mutation | c.310N>A | p.Val104Ile | p.V104I | Q9NXF7 | protein_coding | tolerated_low_confidence(0.1) | benign(0.046) | TCGA-A6-6653-01 | Colorectum | colon adenocarcinoma | Male | >=65 | I/II | Unknown | Unknown | SD | |
| DCAF16 | SNV | Missense_Mutation | c.412C>G | p.His138Asp | p.H138D | Q9NXF7 | protein_coding | tolerated_low_confidence(0.22) | benign(0) | TCGA-AA-A02E-01 | Colorectum | colon adenocarcinoma | Female | >=65 | III/IV | Unknown | Unknown | PD | |
| DCAF16 | SNV | Missense_Mutation | novel | c.608A>G | p.Asp203Gly | p.D203G | Q9NXF7 | protein_coding | tolerated_low_confidence(0.33) | benign(0) | TCGA-A5-A0G2-01 | Endometrium | uterine corpus endometrioid carcinoma | Female | <65 | III/IV | Unknown | Unknown | SD |
| DCAF16 | SNV | Missense_Mutation | rs748599565 | c.272G>A | p.Arg91Gln | p.R91Q | Q9NXF7 | protein_coding | tolerated_low_confidence(0.71) | benign(0) | TCGA-A5-A0G2-01 | Endometrium | uterine corpus endometrioid carcinoma | Female | <65 | III/IV | Unknown | Unknown | SD |
| DCAF16 | SNV | Missense_Mutation | novel | c.86N>A | p.Ser29Tyr | p.S29Y | Q9NXF7 | protein_coding | tolerated_low_confidence(1) | benign(0.015) | TCGA-AJ-A3EK-01 | Endometrium | uterine corpus endometrioid carcinoma | Female | <65 | I/II | Chemotherapy | carboplatin | CR |
| DCAF16 | SNV | Missense_Mutation | novel | c.419N>A | p.Thr140Asn | p.T140N | Q9NXF7 | protein_coding | deleterious_low_confidence(0.02) | benign(0.012) | TCGA-AP-A059-01 | Endometrium | uterine corpus endometrioid carcinoma | Female | >=65 | I/II | Unknown | Unknown | SD |
| DCAF16 | SNV | Missense_Mutation | rs755844762 | c.143C>T | p.Pro48Leu | p.P48L | Q9NXF7 | protein_coding | tolerated_low_confidence(0.72) | benign(0) | TCGA-AX-A06F-01 | Endometrium | uterine corpus endometrioid carcinoma | Female | <65 | III/IV | Chemotherapy | carboplatin | SD |
| Page: 1 2 3 |
Top |
Related drugs of malignant transformation related genes |
| Identification of chemicals and drugs interact with genes involved in malignant transfromation |
| (DGIdb 4.0) |
| Entrez ID | Symbol | Category | Interaction Types | Drug Claim Name | Drug Name | PMIDs |
| Page: 1 |

Copyright 2023-Present -The University of Texas Health Science Center at Houston |