
|
|||||
|
 | |
| |
| |
| |
| |
| |
|
Gene: DCAF13 |
Gene summary for DCAF13 |
| Gene information | Species | Human | Gene symbol | DCAF13 | Gene ID | 25879 |
| Gene name | DDB1 and CUL4 associated factor 13 | |
| Gene Alias | GM83 | |
| Cytomap | 8q22.3 | |
| Gene Type | protein-coding | GO ID | GO:0000462 | UniProtAcc | A0A087WT20 |
Top |
Malignant transformation analysis |
| Identification of the aberrant gene expression in precancerous and cancerous lesions by comparing the gene expression of stem-like cells in diseased tissues with normal stem cells |
| Entrez ID | Symbol | Replicates | Species | Organ | Tissue | Adj P-value | Log2FC | Malignancy |
| 25879 | DCAF13 | EEC-subject1 | Human | Endometrium | EEC | 1.09e-03 | -1.10e-01 | -0.2682 |
| 25879 | DCAF13 | EEC-subject2 | Human | Endometrium | EEC | 7.27e-03 | -1.20e-01 | -0.2607 |
| 25879 | DCAF13 | EEC-subject3 | Human | Endometrium | EEC | 1.74e-09 | -1.47e-01 | -0.2525 |
| 25879 | DCAF13 | EEC-subject4 | Human | Endometrium | EEC | 1.70e-02 | -1.47e-02 | -0.2571 |
| 25879 | DCAF13 | GSM5276934 | Human | Endometrium | EEC | 6.89e-19 | 4.98e-01 | -0.0913 |
| 25879 | DCAF13 | GSM5276937 | Human | Endometrium | EEC | 1.72e-31 | 6.90e-01 | -0.0897 |
| 25879 | DCAF13 | GSM6177620_NYU_UCEC1_lib1_lib1 | Human | Endometrium | EEC | 3.90e-13 | -1.78e-01 | -0.1869 |
| 25879 | DCAF13 | GSM6177620_NYU_UCEC1_lib2_lib2 | Human | Endometrium | EEC | 2.10e-13 | -1.26e-01 | -0.1875 |
| 25879 | DCAF13 | GSM6177620_NYU_UCEC1_lib3_lib3 | Human | Endometrium | EEC | 8.23e-21 | -8.95e-02 | -0.1883 |
| 25879 | DCAF13 | GSM6177621_NYU_UCEC2_lib1_lib1 | Human | Endometrium | EEC | 4.27e-11 | 3.41e-02 | -0.1934 |
| 25879 | DCAF13 | GSM6177622_NYU_UCEC3_lib1_lib1 | Human | Endometrium | EEC | 1.18e-21 | -1.07e-01 | -0.1917 |
| 25879 | DCAF13 | GSM6177622_NYU_UCEC3_lib2_lib2 | Human | Endometrium | EEC | 6.69e-23 | -1.07e-01 | -0.1916 |
| 25879 | DCAF13 | LZE2T | Human | Esophagus | ESCC | 1.87e-05 | 1.30e+00 | 0.082 |
| 25879 | DCAF13 | LZE4T | Human | Esophagus | ESCC | 3.69e-24 | 5.75e-01 | 0.0811 |
| 25879 | DCAF13 | LZE7T | Human | Esophagus | ESCC | 2.29e-10 | 3.76e-01 | 0.0667 |
| 25879 | DCAF13 | LZE8T | Human | Esophagus | ESCC | 1.10e-07 | 2.55e-01 | 0.067 |
| 25879 | DCAF13 | LZE20T | Human | Esophagus | ESCC | 1.90e-08 | 1.26e-01 | 0.0662 |
| 25879 | DCAF13 | LZE22T | Human | Esophagus | ESCC | 3.33e-02 | 4.79e-01 | 0.068 |
| 25879 | DCAF13 | LZE24T | Human | Esophagus | ESCC | 2.44e-17 | 5.49e-01 | 0.0596 |
| 25879 | DCAF13 | LZE21T | Human | Esophagus | ESCC | 7.80e-07 | 3.88e-01 | 0.0655 |
| Page: 1 2 3 4 5 6 7 |
| Tissue | Expression Dynamics | Abbreviation |
| Endometrium | 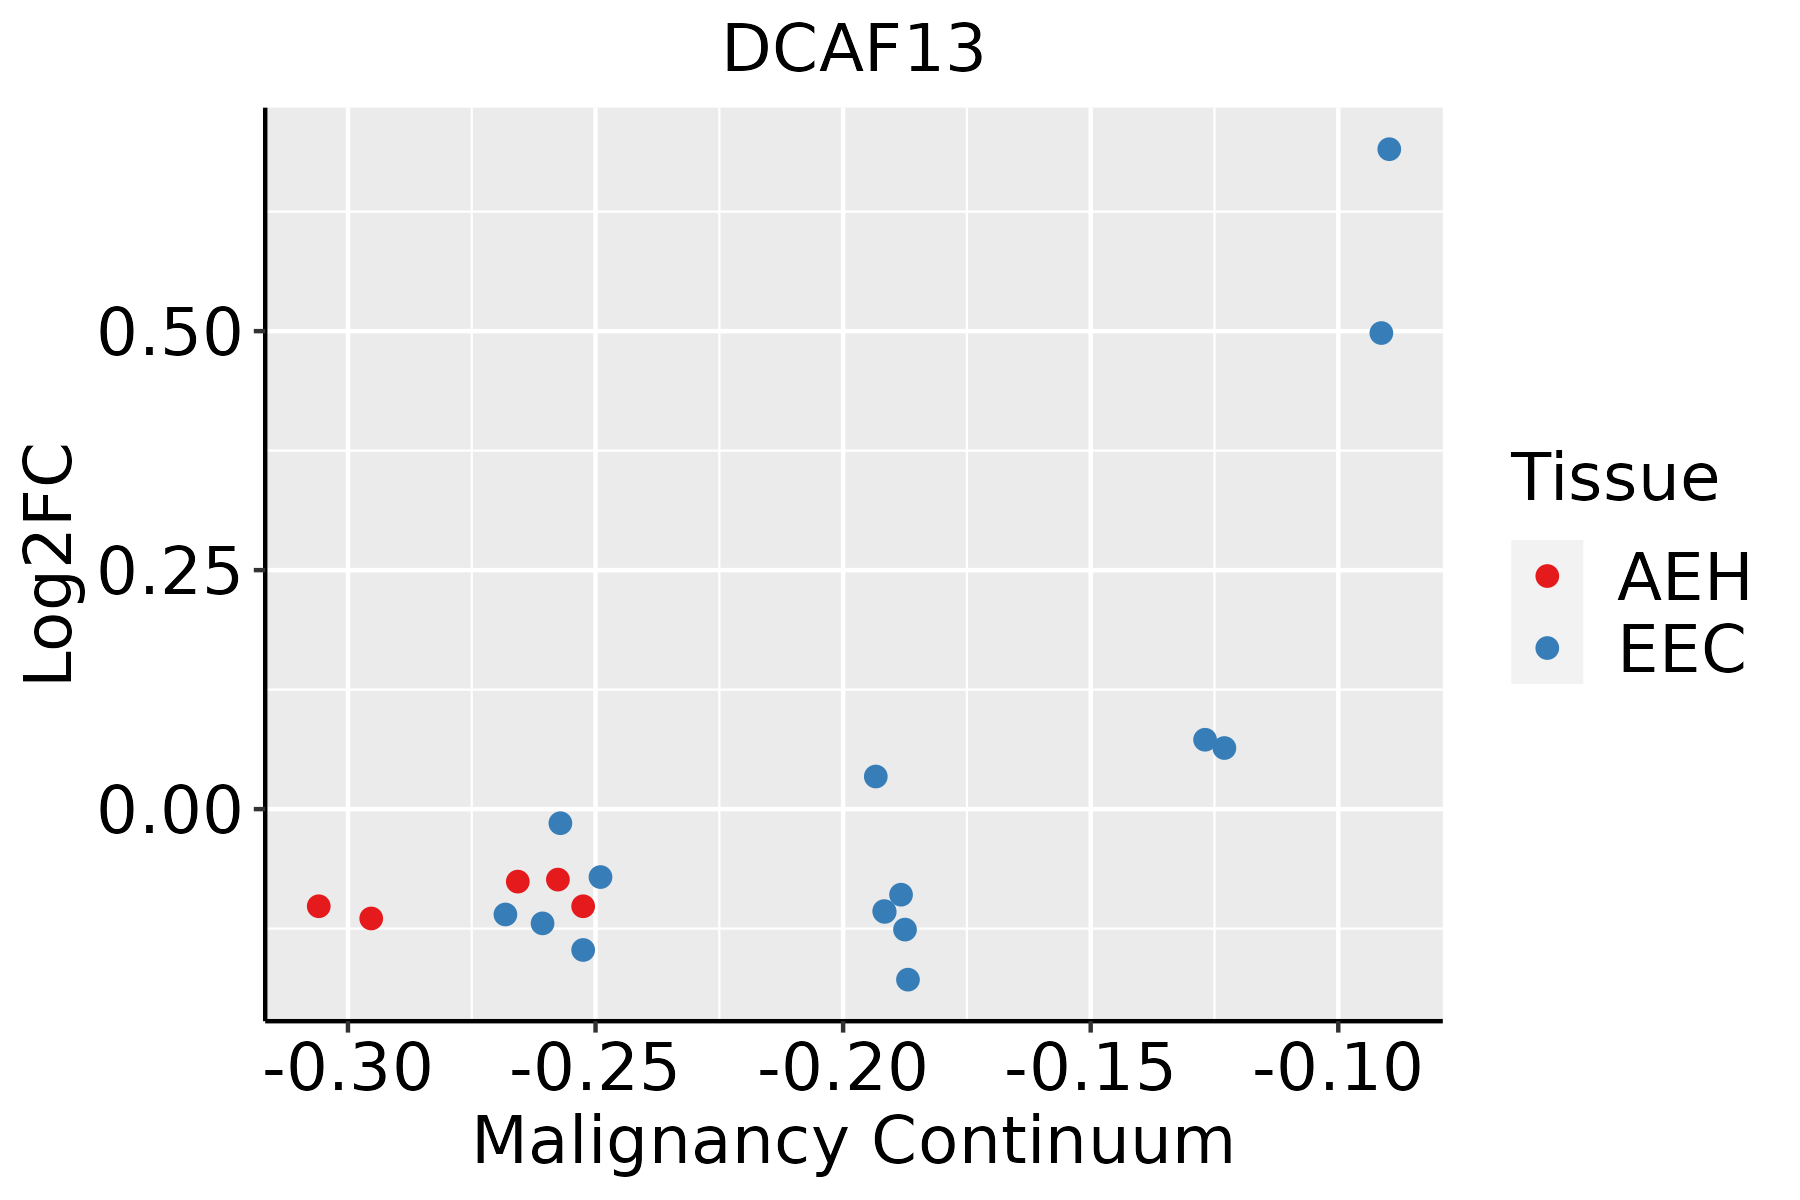 | AEH: Atypical endometrial hyperplasia |
| EEC: Endometrioid Cancer | ||
| Esophagus | 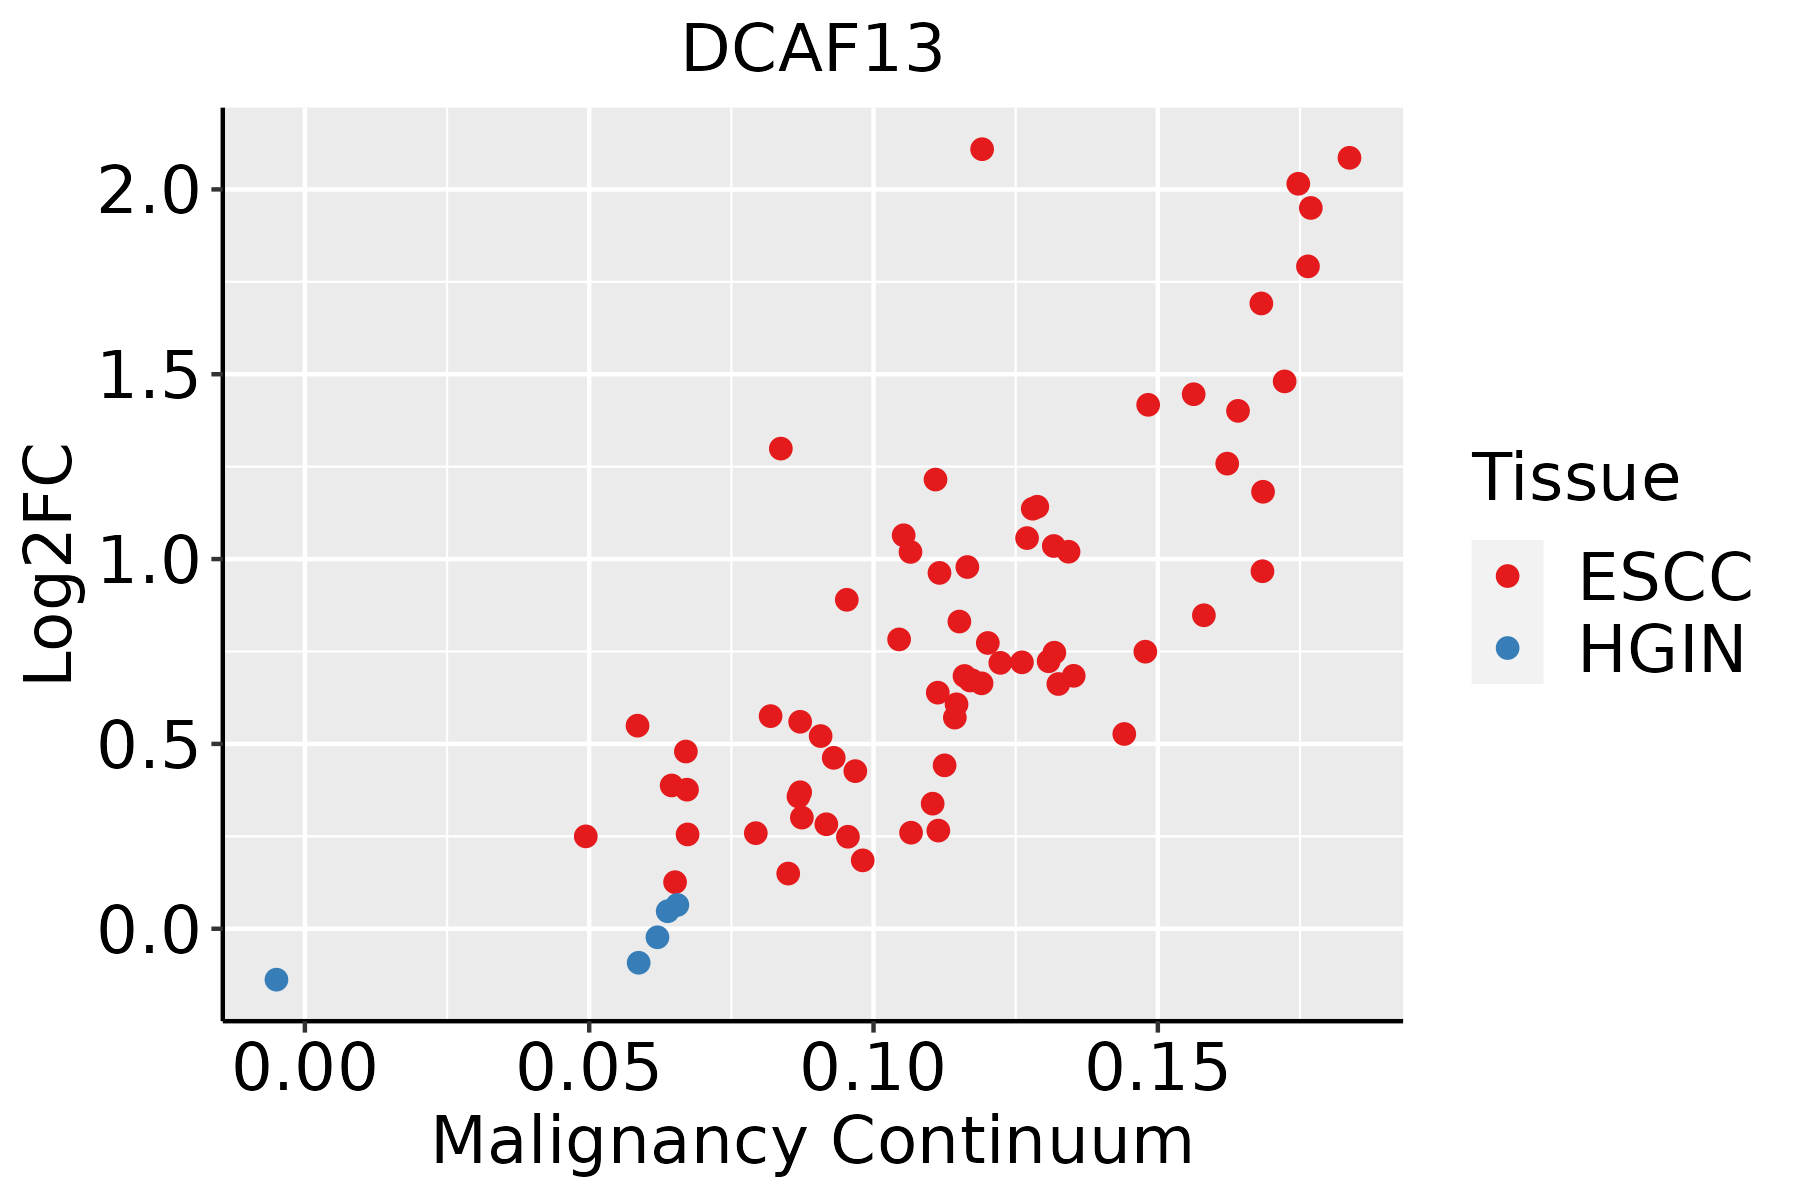 | ESCC: Esophageal squamous cell carcinoma |
| HGIN: High-grade intraepithelial neoplasias | ||
| LGIN: Low-grade intraepithelial neoplasias | ||
| Liver |  | HCC: Hepatocellular carcinoma |
| NAFLD: Non-alcoholic fatty liver disease | ||
| Oral Cavity |  | EOLP: Erosive Oral lichen planus |
| LP: leukoplakia | ||
| NEOLP: Non-erosive oral lichen planus | ||
| OSCC: Oral squamous cell carcinoma | ||
| Prostate |  | BPH: Benign Prostatic Hyperplasia |
| Skin | 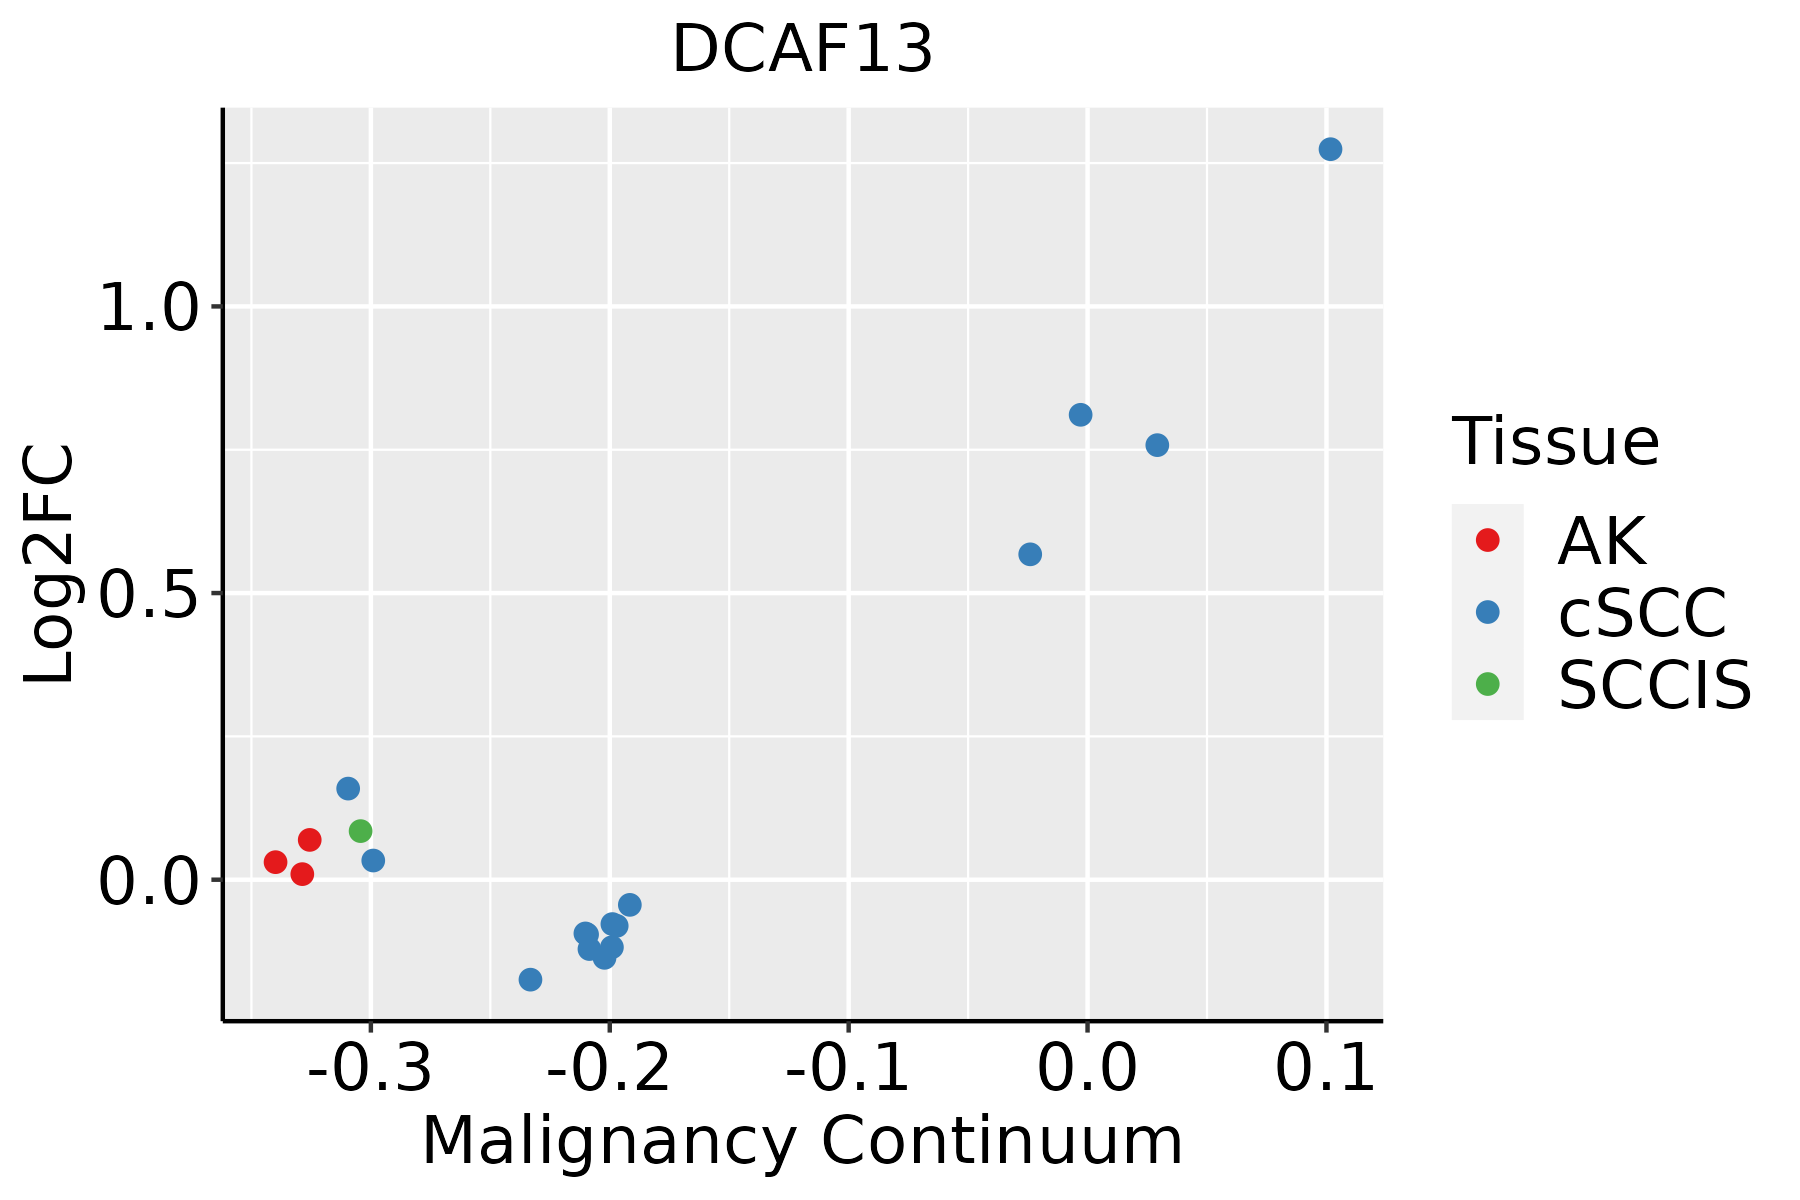 | AK: Actinic keratosis |
| cSCC: Cutaneous squamous cell carcinoma | ||
| SCCIS:squamous cell carcinoma in situ | ||
| Thyroid | 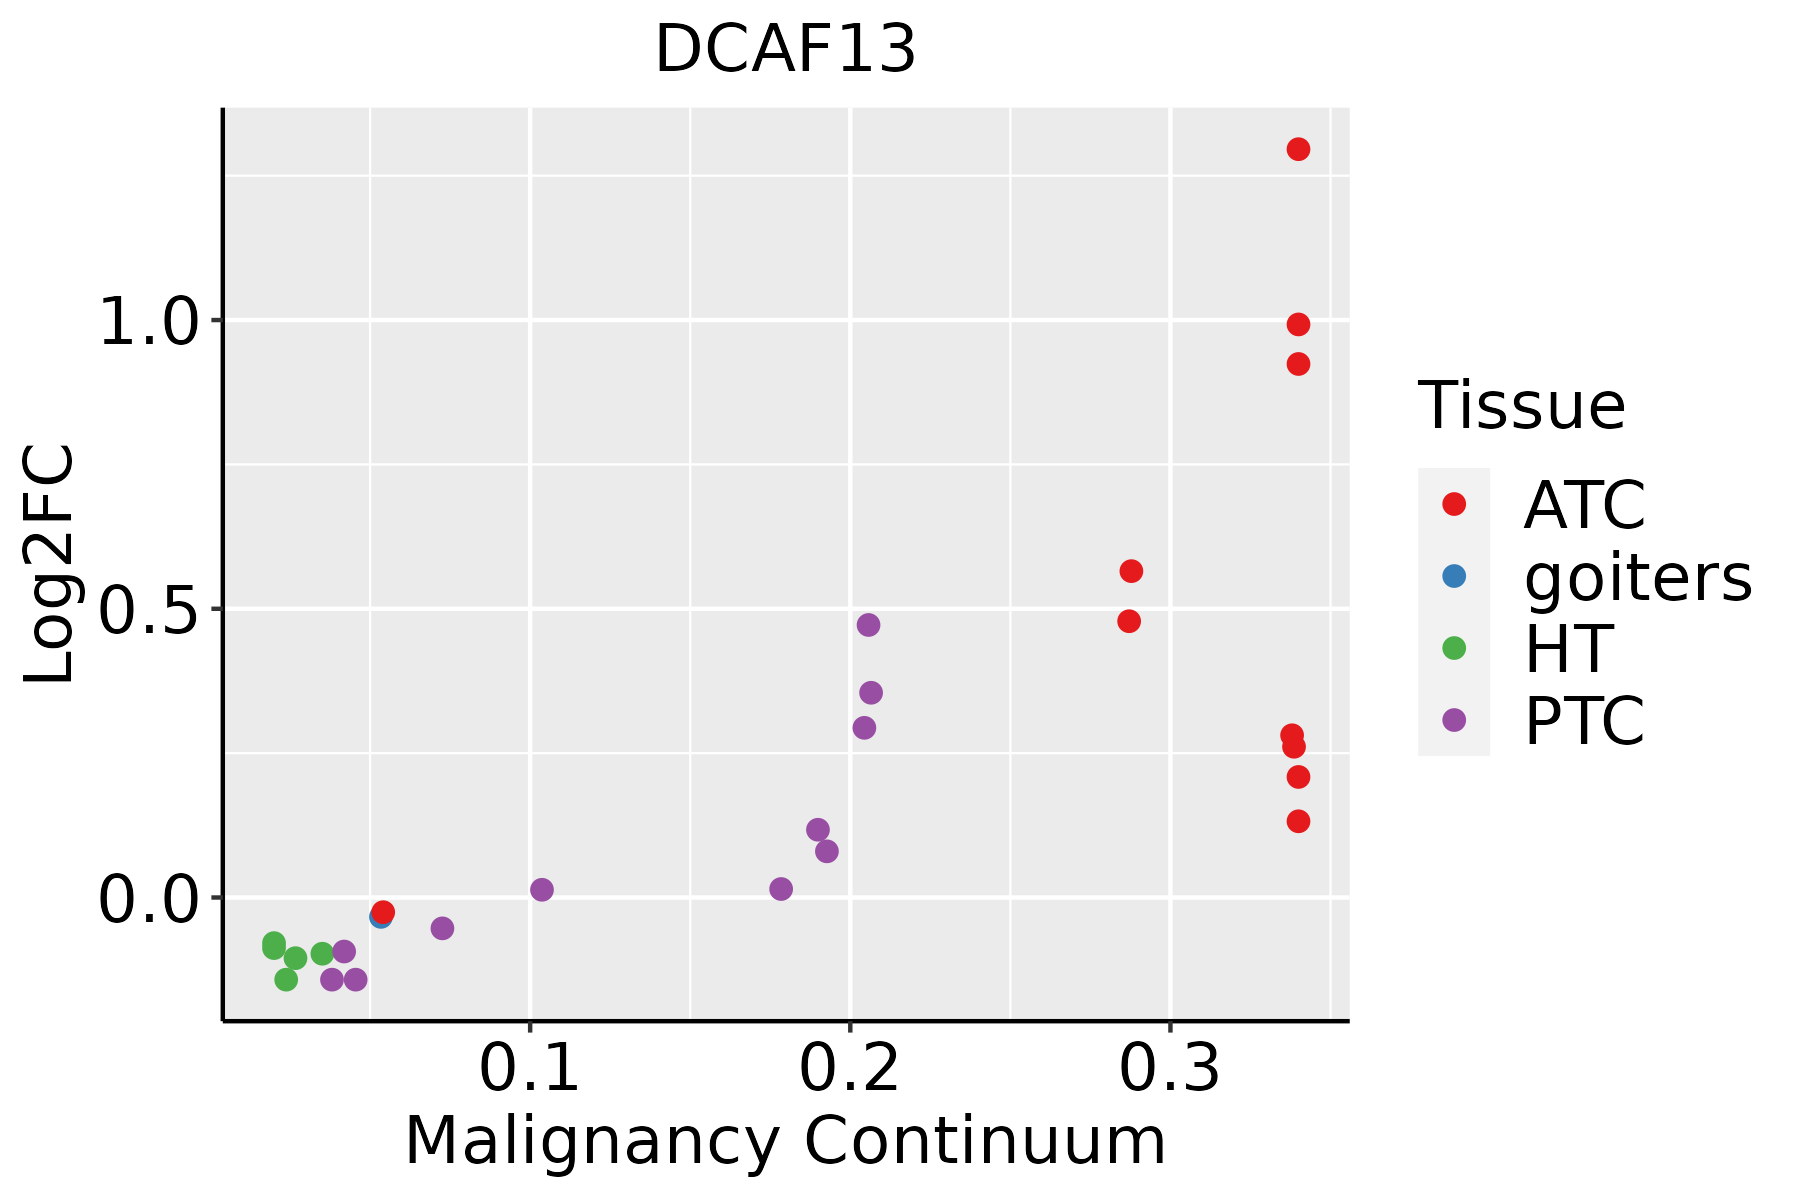 | ATC: Anaplastic thyroid cancer |
| HT: Hashimoto's thyroiditis | ||
| PTC: Papillary thyroid cancer |
| ∗log2FC in expression of this searched gene in stem-like cells from each diseased tissue sample relative to stem-like cells in normal samples in each tissue plotted against the malignancy continuum. Samples are colored based on if they are from different disease stage. |
Top |
Malignant transformation related pathway analysis |
| Find out the enriched GO biological processes and KEGG pathways involved in transition from healthy to precancer to cancer |
| Tissue | Disease Stage | Enriched GO biological Processes |
| Colorectum | AD |  |
| Colorectum | SER |  |
| Colorectum | MSS |  |
| Colorectum | MSI-H |  |
| Colorectum | FAP |  |
| ∗Top 15 enriched GO BP terms are showed in the bar plot of each disease state in each tissue. Each row represents a significant GO biological process which is colored according to the -log10(p.adjust). |
| Page: 1 2 3 4 5 6 7 8 9 |
| GO ID | Tissue | Disease Stage | Description | Gene Ratio | Bg Ratio | pvalue | p.adjust | Count |
| GO:002261317 | Endometrium | EEC | ribonucleoprotein complex biogenesis | 108/2168 | 463/18723 | 4.60e-13 | 9.86e-11 | 108 |
| GO:004225417 | Endometrium | EEC | ribosome biogenesis | 68/2168 | 299/18723 | 2.90e-08 | 1.68e-06 | 68 |
| GO:004227417 | Endometrium | EEC | ribosomal small subunit biogenesis | 23/2168 | 73/18723 | 4.56e-06 | 1.15e-04 | 23 |
| GO:000636416 | Endometrium | EEC | rRNA processing | 48/2168 | 225/18723 | 1.88e-05 | 3.50e-04 | 48 |
| GO:001607216 | Endometrium | EEC | rRNA metabolic process | 49/2168 | 236/18723 | 3.27e-05 | 5.62e-04 | 49 |
| GO:003447012 | Endometrium | EEC | ncRNA processing | 63/2168 | 395/18723 | 5.20e-03 | 3.26e-02 | 63 |
| GO:0022613111 | Esophagus | ESCC | ribonucleoprotein complex biogenesis | 365/8552 | 463/18723 | 1.74e-49 | 1.11e-45 | 365 |
| GO:0042254111 | Esophagus | ESCC | ribosome biogenesis | 252/8552 | 299/18723 | 3.27e-44 | 1.04e-40 | 252 |
| GO:003447015 | Esophagus | ESCC | ncRNA processing | 300/8552 | 395/18723 | 3.09e-35 | 3.26e-32 | 300 |
| GO:0016072110 | Esophagus | ESCC | rRNA metabolic process | 197/8552 | 236/18723 | 1.31e-33 | 1.18e-30 | 197 |
| GO:0006364110 | Esophagus | ESCC | rRNA processing | 189/8552 | 225/18723 | 4.88e-33 | 3.87e-30 | 189 |
| GO:003466012 | Esophagus | ESCC | ncRNA metabolic process | 346/8552 | 485/18723 | 4.35e-31 | 2.51e-28 | 346 |
| GO:0042274111 | Esophagus | ESCC | ribosomal small subunit biogenesis | 67/8552 | 73/18723 | 6.62e-17 | 5.38e-15 | 67 |
| GO:00304904 | Esophagus | ESCC | maturation of SSU-rRNA | 45/8552 | 50/18723 | 5.07e-11 | 1.63e-09 | 45 |
| GO:00004623 | Esophagus | ESCC | maturation of SSU-rRNA from tricistronic rRNA transcript (SSU-rRNA, 5.8S rRNA, LSU-rRNA) | 32/8552 | 37/18723 | 2.96e-07 | 4.23e-06 | 32 |
| GO:002261312 | Liver | Cirrhotic | ribonucleoprotein complex biogenesis | 231/4634 | 463/18723 | 3.28e-32 | 6.86e-29 | 231 |
| GO:004225412 | Liver | Cirrhotic | ribosome biogenesis | 154/4634 | 299/18723 | 1.18e-23 | 6.72e-21 | 154 |
| GO:000636412 | Liver | Cirrhotic | rRNA processing | 115/4634 | 225/18723 | 1.12e-17 | 1.64e-15 | 115 |
| GO:00160724 | Liver | Cirrhotic | rRNA metabolic process | 119/4634 | 236/18723 | 1.19e-17 | 1.70e-15 | 119 |
| GO:00344701 | Liver | Cirrhotic | ncRNA processing | 158/4634 | 395/18723 | 1.09e-11 | 6.96e-10 | 158 |
| Page: 1 2 3 4 5 |
| Pathway ID | Tissue | Disease Stage | Description | Gene Ratio | Bg Ratio | pvalue | p.adjust | qvalue | Count |
| Page: 1 |
Top |
Cell-cell communication analysis |
| Identification of potential cell-cell interactions between two cell types and their ligand-receptor pairs for different disease states |
| Ligand | Receptor | LRpair | Pathway | Tissue | Disease Stage |
| Page: 1 |
Top |
Single-cell gene regulatory network inference analysis |
| Find out the significant the regulons (TFs) and the target genes of each regulon across cell types for different disease states |
| TF | Cell Type | Tissue | Disease Stage | Target Gene | RSS | Regulon Activity |
| ∗The dot plots of a searched regulon are shown for all cell subpopulations in each disease state of each tissue based on the regulon specific score inferred using pySCENIC and by calculating the average expression. |
| Page: 1 |
Top |
Somatic mutation of malignant transformation related genes |
| Annotation of somatic variants for genes involved in malignant transformation |
| Hugo Symbol | Variant Class | Variant Classification | dbSNP RS | HGVSc | HGVSp | HGVSp Short | SWISSPROT | BIOTYPE | SIFT | PolyPhen | Tumor Sample Barcode | Tissue | Histology | Sex | Age | Stage | Therapy Types | Drugs | Outcome |
| DCAF13 | SNV | Missense_Mutation | c.1426N>G | p.Arg476Gly | p.R476G | protein_coding | deleterious(0) | benign(0.368) | TCGA-A8-A08R-01 | Breast | breast invasive carcinoma | Female | <65 | I/II | Unknown | Unknown | SD | ||
| DCAF13 | SNV | Missense_Mutation | c.1376N>A | p.Arg459Gln | p.R459Q | protein_coding | deleterious(0) | possibly_damaging(0.691) | TCGA-AN-A046-01 | Breast | breast invasive carcinoma | Female | >=65 | I/II | Unknown | Unknown | SD | ||
| DCAF13 | SNV | Missense_Mutation | novel | c.1784N>G | p.Val595Gly | p.V595G | protein_coding | deleterious(0.02) | probably_damaging(0.996) | TCGA-AN-A04A-01 | Breast | breast invasive carcinoma | Female | <65 | III/IV | Unknown | Unknown | SD | |
| DCAF13 | SNV | Missense_Mutation | c.835N>C | p.Val279Leu | p.V279L | protein_coding | tolerated(0.05) | benign(0.192) | TCGA-GM-A2DB-01 | Breast | breast invasive carcinoma | Female | <65 | I/II | Chemotherapy | taxol | CR | ||
| DCAF13 | deletion | In_Frame_Del | c.617_631delNNNNNNNNNNNNNNN | p.Lys208_Ala212del | p.K208_A212del | protein_coding | TCGA-AN-A0XN-01 | Breast | breast invasive carcinoma | Female | >=65 | III/IV | Unknown | Unknown | SD | ||||
| DCAF13 | SNV | Missense_Mutation | rs762435482 | c.428N>G | p.Ser143Trp | p.S143W | protein_coding | deleterious_low_confidence(0) | benign(0.001) | TCGA-C5-A8YQ-01 | Cervix | cervical & endocervical cancer | Female | >=65 | I/II | Chemotherapy | cisplatin | PD | |
| DCAF13 | SNV | Missense_Mutation | c.1460C>G | p.Ser487Cys | p.S487C | protein_coding | tolerated(0.19) | possibly_damaging(0.79) | TCGA-EK-A3GJ-01 | Cervix | cervical & endocervical cancer | Female | <65 | I/II | Unknown | Unknown | SD | ||
| DCAF13 | SNV | Missense_Mutation | c.212N>G | p.Ser71Trp | p.S71W | protein_coding | deleterious_low_confidence(0) | benign(0.009) | TCGA-Q1-A73P-01 | Cervix | cervical & endocervical cancer | Female | <65 | I/II | Unknown | Unknown | SD | ||
| DCAF13 | SNV | Missense_Mutation | c.166G>A | p.Ala56Thr | p.A56T | protein_coding | benign(0.005) | TCGA-AA-3815-01 | Colorectum | colon adenocarcinoma | Female | >=65 | I/II | Unknown | Unknown | SD | |||
| DCAF13 | SNV | Missense_Mutation | rs761547809 | c.1505N>A | p.Arg502His | p.R502H | protein_coding | deleterious(0) | probably_damaging(0.955) | TCGA-AA-3977-01 | Colorectum | colon adenocarcinoma | Male | >=65 | I/II | Unknown | Unknown | SD |
| Page: 1 2 3 4 5 6 7 8 9 |
Top |
Related drugs of malignant transformation related genes |
| Identification of chemicals and drugs interact with genes involved in malignant transfromation |
| (DGIdb 4.0) |
| Entrez ID | Symbol | Category | Interaction Types | Drug Claim Name | Drug Name | PMIDs |
| Page: 1 |

Copyright 2023-Present -The University of Texas Health Science Center at Houston |