
|
|||||
|
 | |
| |
| |
| |
| |
| |
|
Gene: DCAF1 |
Gene summary for DCAF1 |
| Gene information | Species | Human | Gene symbol | DCAF1 | Gene ID | 9730 |
| Gene name | DDB1 and CUL4 associated factor 1 | |
| Gene Alias | RIP | |
| Cytomap | 3p21.2 | |
| Gene Type | protein-coding | GO ID | GO:0000122 | UniProtAcc | Q9Y4B6 |
Top |
Malignant transformation analysis |
| Identification of the aberrant gene expression in precancerous and cancerous lesions by comparing the gene expression of stem-like cells in diseased tissues with normal stem cells |
| Entrez ID | Symbol | Replicates | Species | Organ | Tissue | Adj P-value | Log2FC | Malignancy |
| 9730 | DCAF1 | AEH-subject1 | Human | Endometrium | AEH | 1.88e-08 | 1.86e-01 | -0.3059 |
| 9730 | DCAF1 | AEH-subject2 | Human | Endometrium | AEH | 4.40e-03 | 1.37e-01 | -0.2525 |
| 9730 | DCAF1 | AEH-subject3 | Human | Endometrium | AEH | 1.75e-04 | 1.36e-01 | -0.2576 |
| 9730 | DCAF1 | AEH-subject4 | Human | Endometrium | AEH | 5.35e-06 | 1.85e-01 | -0.2657 |
| 9730 | DCAF1 | AEH-subject5 | Human | Endometrium | AEH | 1.85e-09 | 2.10e-01 | -0.2953 |
| 9730 | DCAF1 | EEC-subject1 | Human | Endometrium | EEC | 4.07e-08 | 2.09e-01 | -0.2682 |
| 9730 | DCAF1 | EEC-subject2 | Human | Endometrium | EEC | 1.75e-04 | 1.40e-01 | -0.2607 |
| 9730 | DCAF1 | EEC-subject3 | Human | Endometrium | EEC | 8.53e-06 | 1.44e-01 | -0.2525 |
| 9730 | DCAF1 | EEC-subject4 | Human | Endometrium | EEC | 8.23e-05 | 1.57e-01 | -0.2571 |
| 9730 | DCAF1 | EEC-subject5 | Human | Endometrium | EEC | 8.53e-06 | 1.37e-01 | -0.249 |
| 9730 | DCAF1 | GSM5276935 | Human | Endometrium | EEC | 1.56e-02 | 9.00e-02 | -0.123 |
| 9730 | DCAF1 | GSM6177621_NYU_UCEC2_lib1_lib1 | Human | Endometrium | EEC | 4.06e-07 | 3.15e-01 | -0.1934 |
| 9730 | DCAF1 | GSM6177623_NYU_UCEC3_Vis | Human | Endometrium | EEC | 3.71e-04 | 1.69e-01 | -0.1269 |
| Page: 1 |
| Tissue | Expression Dynamics | Abbreviation |
| Endometrium | 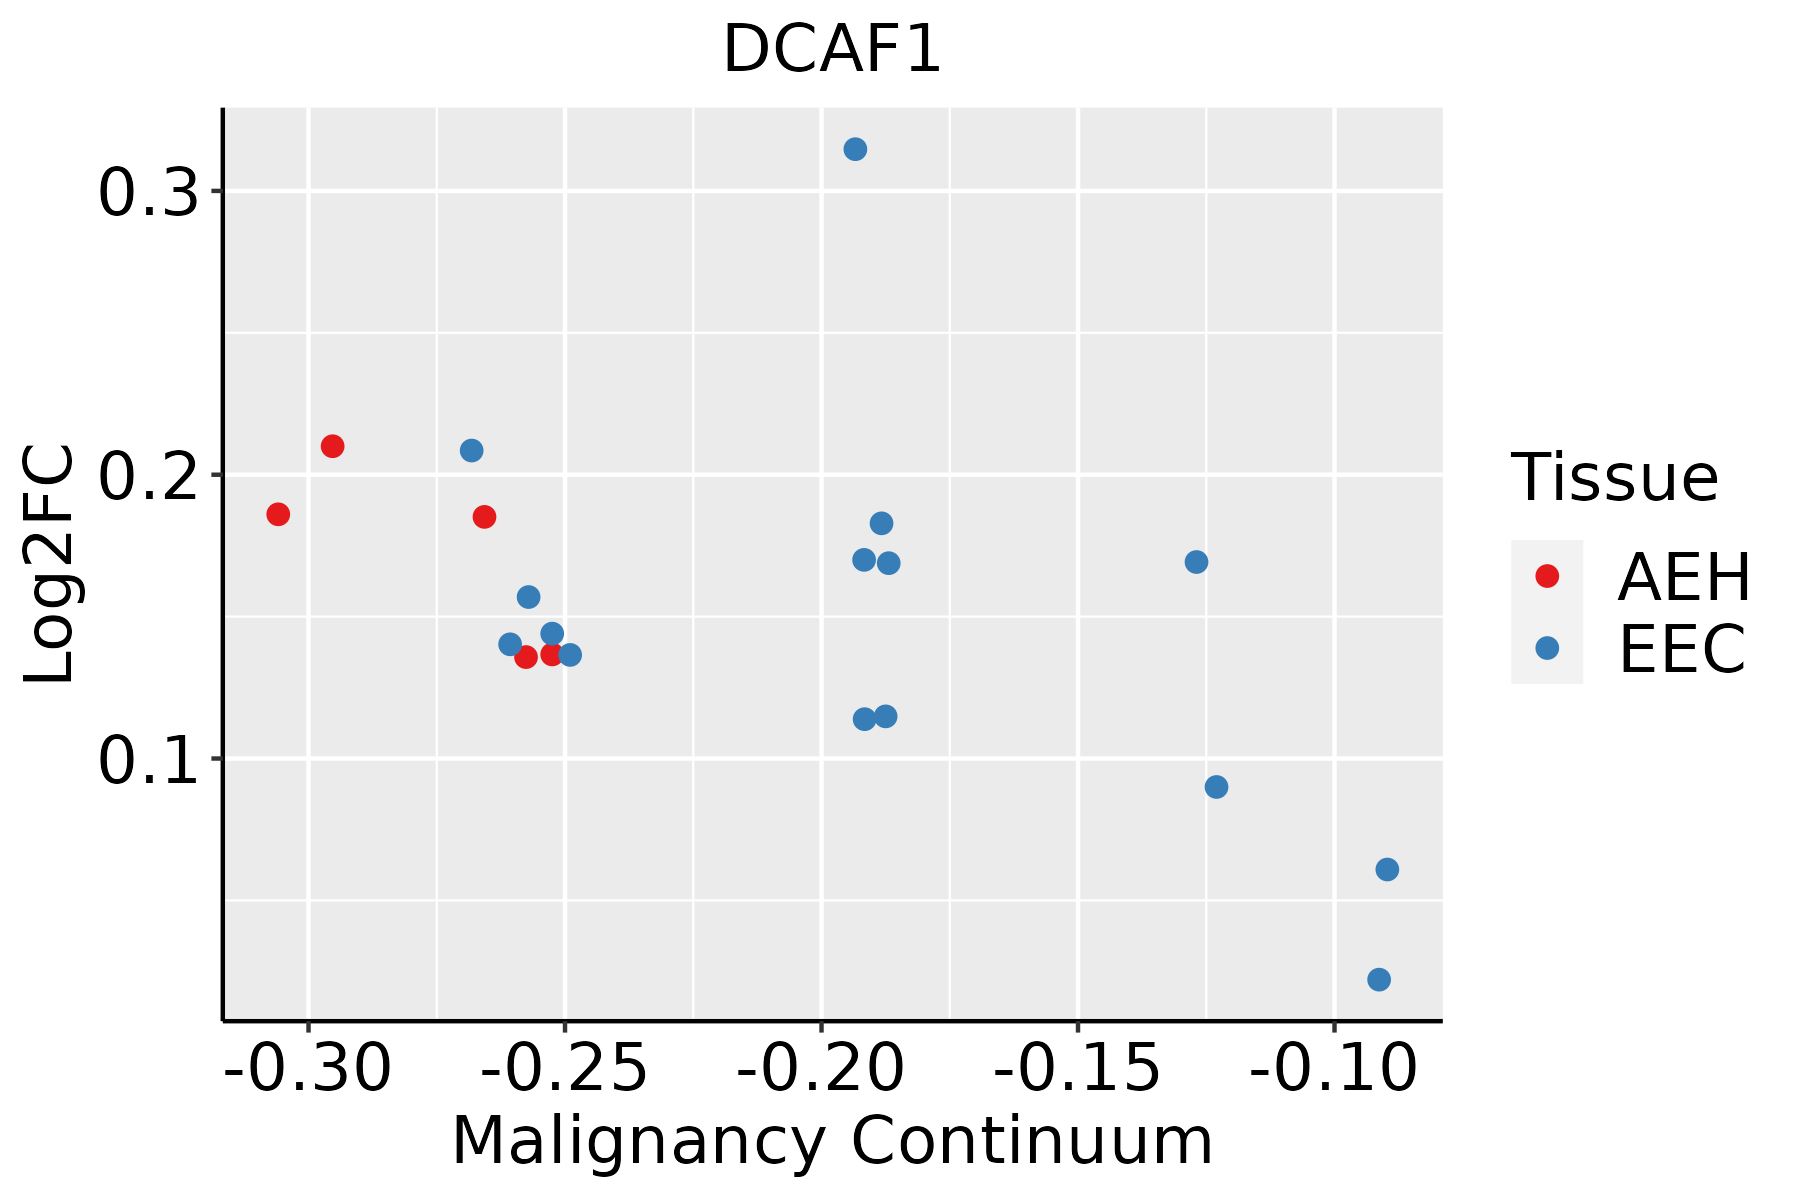 | AEH: Atypical endometrial hyperplasia |
| EEC: Endometrioid Cancer |
| ∗log2FC in expression of this searched gene in stem-like cells from each diseased tissue sample relative to stem-like cells in normal samples in each tissue plotted against the malignancy continuum. Samples are colored based on if they are from different disease stage. |
Top |
Malignant transformation related pathway analysis |
| Find out the enriched GO biological processes and KEGG pathways involved in transition from healthy to precancer to cancer |
| Tissue | Disease Stage | Enriched GO biological Processes |
| Colorectum | AD |  |
| Colorectum | SER |  |
| Colorectum | MSS |  |
| Colorectum | MSI-H |  |
| Colorectum | FAP |  |
| ∗Top 15 enriched GO BP terms are showed in the bar plot of each disease state in each tissue. Each row represents a significant GO biological process which is colored according to the -log10(p.adjust). |
| Page: 1 2 3 4 5 6 7 8 9 |
| GO ID | Tissue | Disease Stage | Description | Gene Ratio | Bg Ratio | pvalue | p.adjust | Count |
| GO:0010498 | Colorectum | AD | proteasomal protein catabolic process | 174/3918 | 490/18723 | 3.18e-14 | 7.66e-12 | 174 |
| GO:0043161 | Colorectum | AD | proteasome-mediated ubiquitin-dependent protein catabolic process | 141/3918 | 412/18723 | 1.77e-10 | 1.68e-08 | 141 |
| GO:00104981 | Colorectum | SER | proteasomal protein catabolic process | 132/2897 | 490/18723 | 3.08e-11 | 5.55e-09 | 132 |
| GO:00431611 | Colorectum | SER | proteasome-mediated ubiquitin-dependent protein catabolic process | 105/2897 | 412/18723 | 7.48e-08 | 4.70e-06 | 105 |
| GO:00104982 | Colorectum | MSS | proteasomal protein catabolic process | 157/3467 | 490/18723 | 2.39e-13 | 5.25e-11 | 157 |
| GO:00431612 | Colorectum | MSS | proteasome-mediated ubiquitin-dependent protein catabolic process | 127/3467 | 412/18723 | 7.70e-10 | 6.32e-08 | 127 |
| GO:00104983 | Colorectum | MSI-H | proteasomal protein catabolic process | 71/1319 | 490/18723 | 4.67e-09 | 6.03e-07 | 71 |
| GO:00431613 | Colorectum | MSI-H | proteasome-mediated ubiquitin-dependent protein catabolic process | 53/1319 | 412/18723 | 1.51e-05 | 6.62e-04 | 53 |
| GO:00181077 | Endometrium | AEH | peptidyl-threonine phosphorylation | 24/2100 | 116/18723 | 2.14e-03 | 1.65e-02 | 24 |
| GO:00182107 | Endometrium | AEH | peptidyl-threonine modification | 25/2100 | 125/18723 | 2.84e-03 | 2.04e-02 | 25 |
| GO:002261317 | Endometrium | EEC | ribonucleoprotein complex biogenesis | 108/2168 | 463/18723 | 4.60e-13 | 9.86e-11 | 108 |
| GO:004225417 | Endometrium | EEC | ribosome biogenesis | 68/2168 | 299/18723 | 2.90e-08 | 1.68e-06 | 68 |
| GO:004227417 | Endometrium | EEC | ribosomal small subunit biogenesis | 23/2168 | 73/18723 | 4.56e-06 | 1.15e-04 | 23 |
| GO:000636416 | Endometrium | EEC | rRNA processing | 48/2168 | 225/18723 | 1.88e-05 | 3.50e-04 | 48 |
| GO:001607216 | Endometrium | EEC | rRNA metabolic process | 49/2168 | 236/18723 | 3.27e-05 | 5.62e-04 | 49 |
| GO:001821013 | Endometrium | EEC | peptidyl-threonine modification | 28/2168 | 125/18723 | 4.23e-04 | 4.42e-03 | 28 |
| GO:001810713 | Endometrium | EEC | peptidyl-threonine phosphorylation | 26/2168 | 116/18723 | 6.60e-04 | 6.37e-03 | 26 |
| GO:003447012 | Endometrium | EEC | ncRNA processing | 63/2168 | 395/18723 | 5.20e-03 | 3.26e-02 | 63 |
| GO:0022613111 | Esophagus | ESCC | ribonucleoprotein complex biogenesis | 365/8552 | 463/18723 | 1.74e-49 | 1.11e-45 | 365 |
| GO:0042254111 | Esophagus | ESCC | ribosome biogenesis | 252/8552 | 299/18723 | 3.27e-44 | 1.04e-40 | 252 |
| Page: 1 2 3 4 5 6 7 |
| Pathway ID | Tissue | Disease Stage | Description | Gene Ratio | Bg Ratio | pvalue | p.adjust | qvalue | Count |
| hsa0517018 | Endometrium | AEH | Human immunodeficiency virus 1 infection | 43/1197 | 212/8465 | 8.19e-03 | 4.22e-02 | 3.09e-02 | 43 |
| hsa0517019 | Endometrium | AEH | Human immunodeficiency virus 1 infection | 43/1197 | 212/8465 | 8.19e-03 | 4.22e-02 | 3.09e-02 | 43 |
| hsa0517025 | Endometrium | EEC | Human immunodeficiency virus 1 infection | 44/1237 | 212/8465 | 8.86e-03 | 4.05e-02 | 3.02e-02 | 44 |
| hsa0517035 | Endometrium | EEC | Human immunodeficiency virus 1 infection | 44/1237 | 212/8465 | 8.86e-03 | 4.05e-02 | 3.02e-02 | 44 |
| Page: 1 |
Top |
Cell-cell communication analysis |
| Identification of potential cell-cell interactions between two cell types and their ligand-receptor pairs for different disease states |
| Ligand | Receptor | LRpair | Pathway | Tissue | Disease Stage |
| Page: 1 |
Top |
Single-cell gene regulatory network inference analysis |
| Find out the significant the regulons (TFs) and the target genes of each regulon across cell types for different disease states |
| TF | Cell Type | Tissue | Disease Stage | Target Gene | RSS | Regulon Activity |
| ∗The dot plots of a searched regulon are shown for all cell subpopulations in each disease state of each tissue based on the regulon specific score inferred using pySCENIC and by calculating the average expression. |
| Page: 1 |
Top |
Somatic mutation of malignant transformation related genes |
| Annotation of somatic variants for genes involved in malignant transformation |
| Hugo Symbol | Variant Class | Variant Classification | dbSNP RS | HGVSc | HGVSp | HGVSp Short | SWISSPROT | BIOTYPE | SIFT | PolyPhen | Tumor Sample Barcode | Tissue | Histology | Sex | Age | Stage | Therapy Types | Drugs | Outcome |
| DCAF1 | SNV | Missense_Mutation | novel | c.1693N>T | p.His565Tyr | p.H565Y | Q9Y4B6 | protein_coding | deleterious(0.04) | benign(0.275) | TCGA-A2-A4RW-01 | Breast | breast invasive carcinoma | Female | <65 | III/IV | Unknown | Unknown | SD |
| DCAF1 | SNV | Missense_Mutation | c.3955N>A | p.Asp1319Asn | p.D1319N | Q9Y4B6 | protein_coding | tolerated(0.12) | probably_damaging(0.976) | TCGA-AC-A23H-01 | Breast | breast invasive carcinoma | Female | >=65 | I/II | Unknown | Unknown | PD | |
| DCAF1 | SNV | Missense_Mutation | c.861N>G | p.Phe287Leu | p.F287L | Q9Y4B6 | protein_coding | tolerated(0.68) | probably_damaging(0.943) | TCGA-AC-A23H-01 | Breast | breast invasive carcinoma | Female | >=65 | I/II | Unknown | Unknown | PD | |
| DCAF1 | SNV | Missense_Mutation | c.3260N>T | p.Arg1087Leu | p.R1087L | Q9Y4B6 | protein_coding | deleterious(0) | possibly_damaging(0.577) | TCGA-AC-A3QQ-01 | Breast | breast invasive carcinoma | Female | <65 | I/II | Unknown | Unknown | SD | |
| DCAF1 | SNV | Missense_Mutation | novel | c.3259N>T | p.Arg1087Trp | p.R1087W | Q9Y4B6 | protein_coding | deleterious(0) | probably_damaging(0.942) | TCGA-AC-A3QQ-01 | Breast | breast invasive carcinoma | Female | <65 | I/II | Unknown | Unknown | SD |
| DCAF1 | SNV | Missense_Mutation | c.4436N>T | p.Asp1479Val | p.D1479V | Q9Y4B6 | protein_coding | tolerated_low_confidence(0.08) | probably_damaging(0.994) | TCGA-AR-A24H-01 | Breast | breast invasive carcinoma | Female | >=65 | I/II | Hormone Therapy | tamoxiphen | SD | |
| DCAF1 | SNV | Missense_Mutation | c.2060N>G | p.Asn687Ser | p.N687S | Q9Y4B6 | protein_coding | deleterious(0.01) | probably_damaging(0.969) | TCGA-D8-A1XM-01 | Breast | breast invasive carcinoma | Female | <65 | I/II | Unknown | Unknown | SD | |
| DCAF1 | SNV | Missense_Mutation | novel | c.821A>G | p.Asp274Gly | p.D274G | Q9Y4B6 | protein_coding | tolerated(0.25) | benign(0) | TCGA-D8-A73W-01 | Breast | breast invasive carcinoma | Female | >=65 | III/IV | Hormone Therapy | tamoxiphen | PD |
| DCAF1 | SNV | Missense_Mutation | c.3658N>A | p.Ala1220Thr | p.A1220T | Q9Y4B6 | protein_coding | tolerated(0.14) | probably_damaging(0.987) | TCGA-EW-A1IZ-01 | Breast | breast invasive carcinoma | Female | <65 | III/IV | Chemotherapy | taxotere | SD | |
| DCAF1 | SNV | Missense_Mutation | novel | c.2396N>A | p.Arg799His | p.R799H | Q9Y4B6 | protein_coding | deleterious(0) | probably_damaging(0.989) | TCGA-LL-A740-01 | Breast | breast invasive carcinoma | Female | <65 | I/II | Chemotherapy | adriamycin | CR |
| Page: 1 2 3 4 5 6 7 8 9 10 11 12 13 14 15 16 |
Top |
Related drugs of malignant transformation related genes |
| Identification of chemicals and drugs interact with genes involved in malignant transfromation |
| (DGIdb 4.0) |
| Entrez ID | Symbol | Category | Interaction Types | Drug Claim Name | Drug Name | PMIDs |
| Page: 1 |

Copyright 2023-Present -The University of Texas Health Science Center at Houston |