| Tissue | Expression Dynamics | Abbreviation |
| Esophagus | 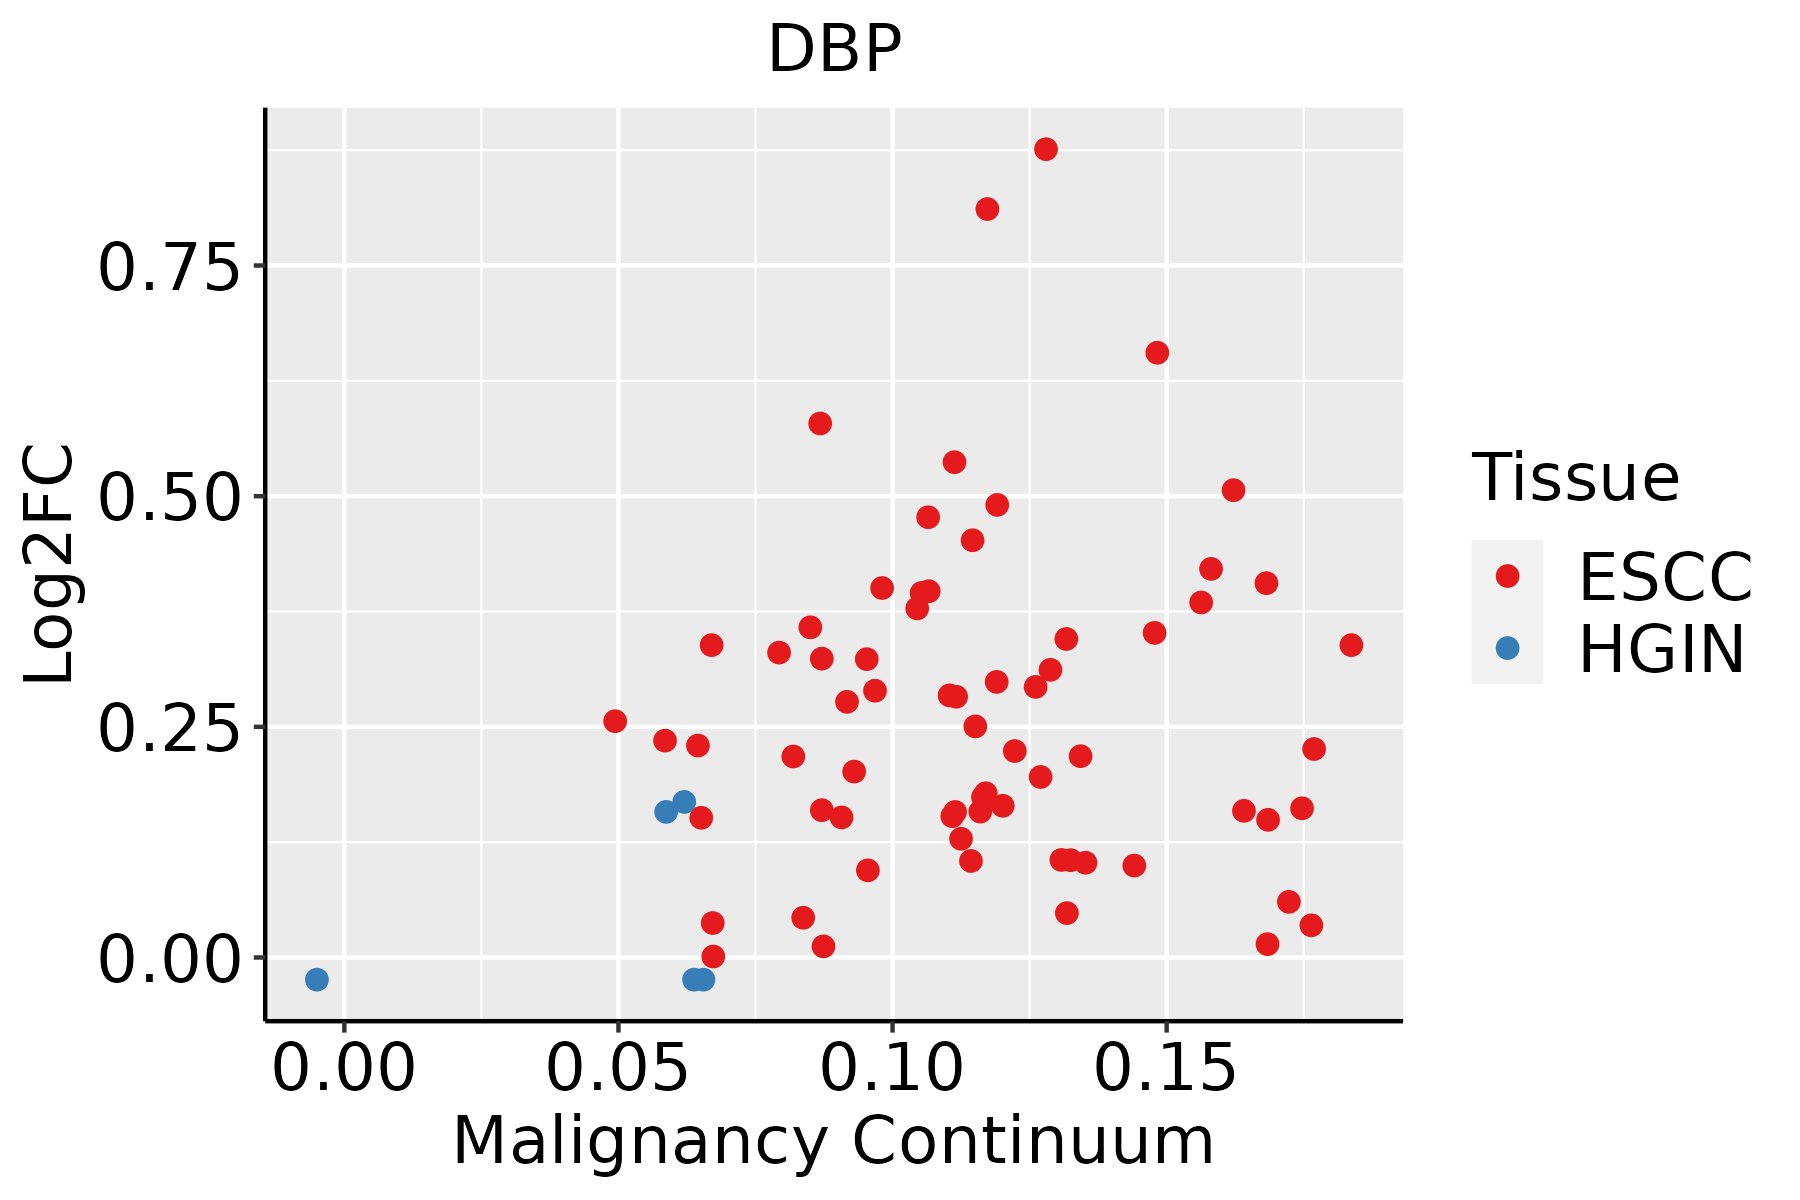 | ESCC: Esophageal squamous cell carcinoma |
| HGIN: High-grade intraepithelial neoplasias |
| LGIN: Low-grade intraepithelial neoplasias |
| Oral Cavity | 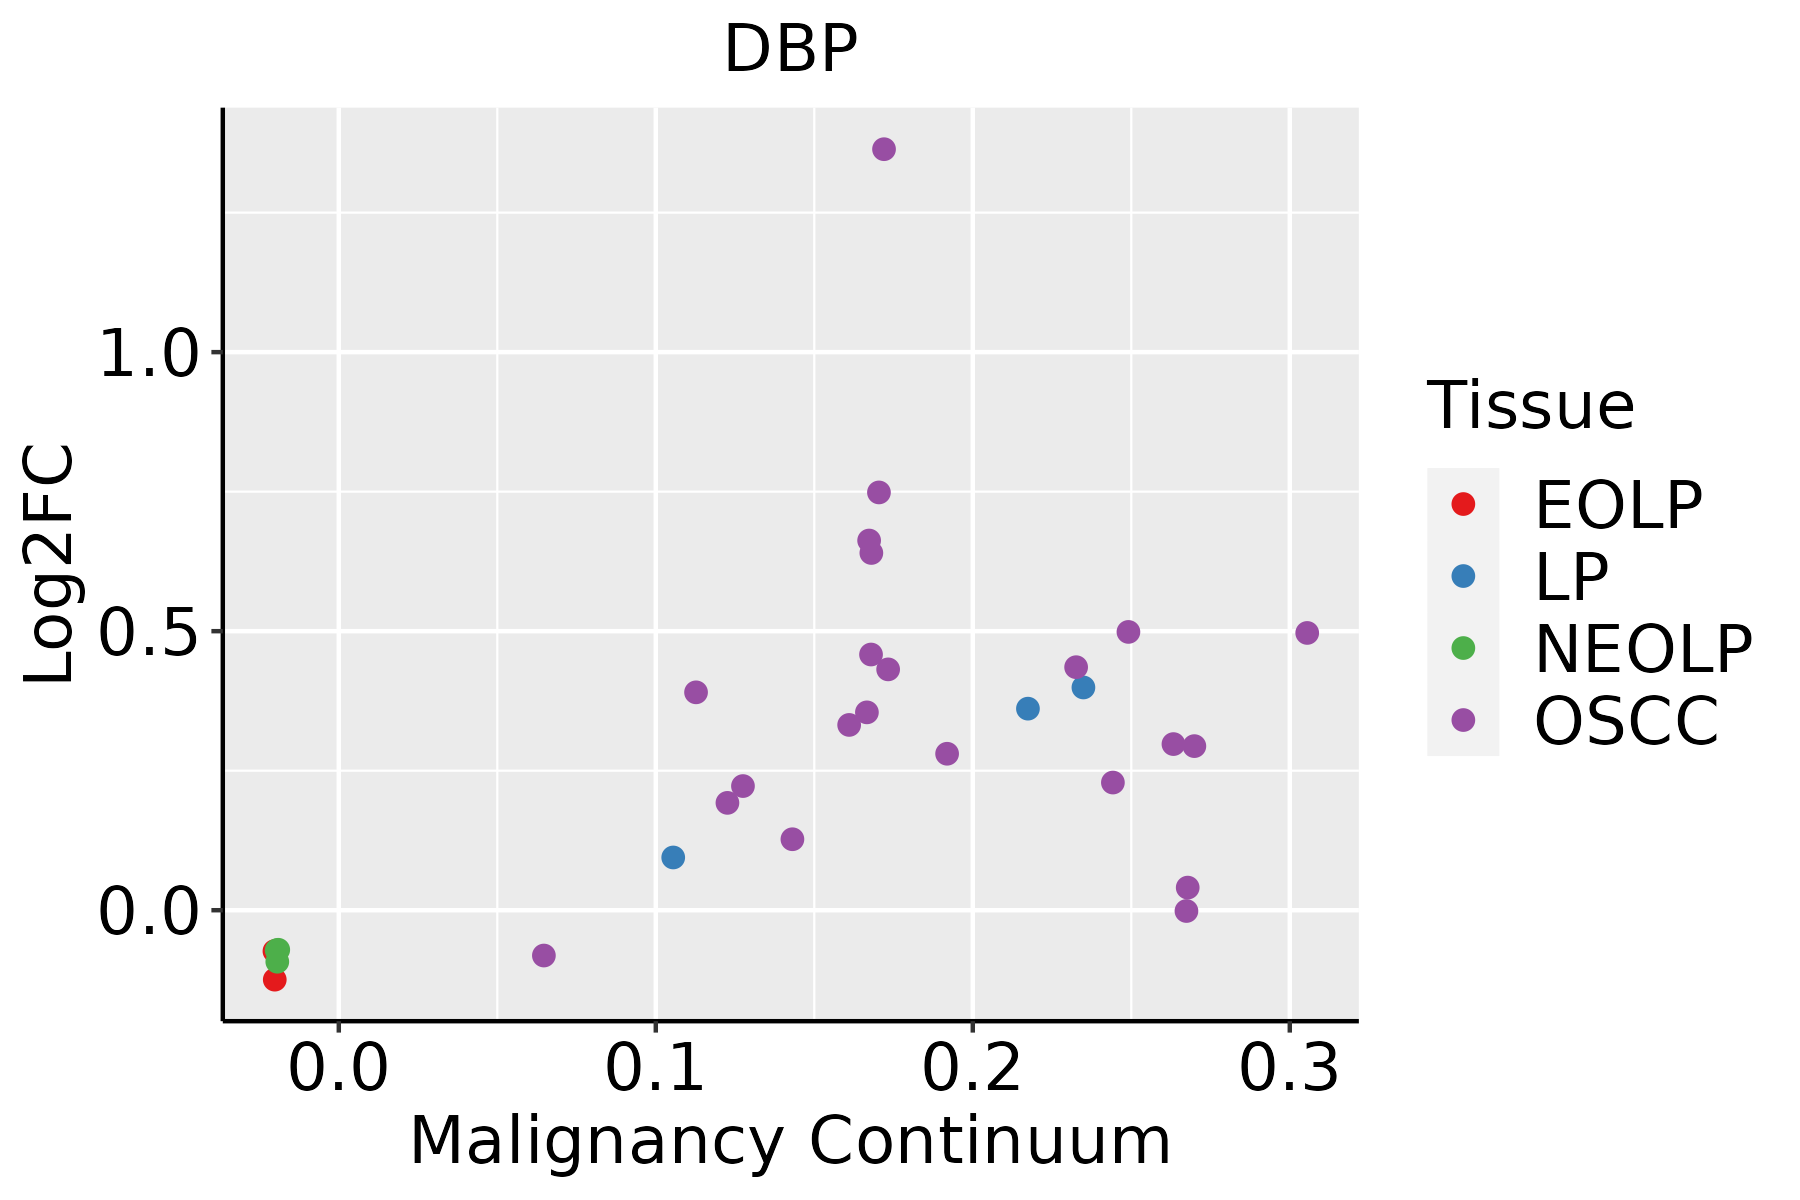 | EOLP: Erosive Oral lichen planus |
| LP: leukoplakia |
| NEOLP: Non-erosive oral lichen planus |
| OSCC: Oral squamous cell carcinoma |
| Skin | 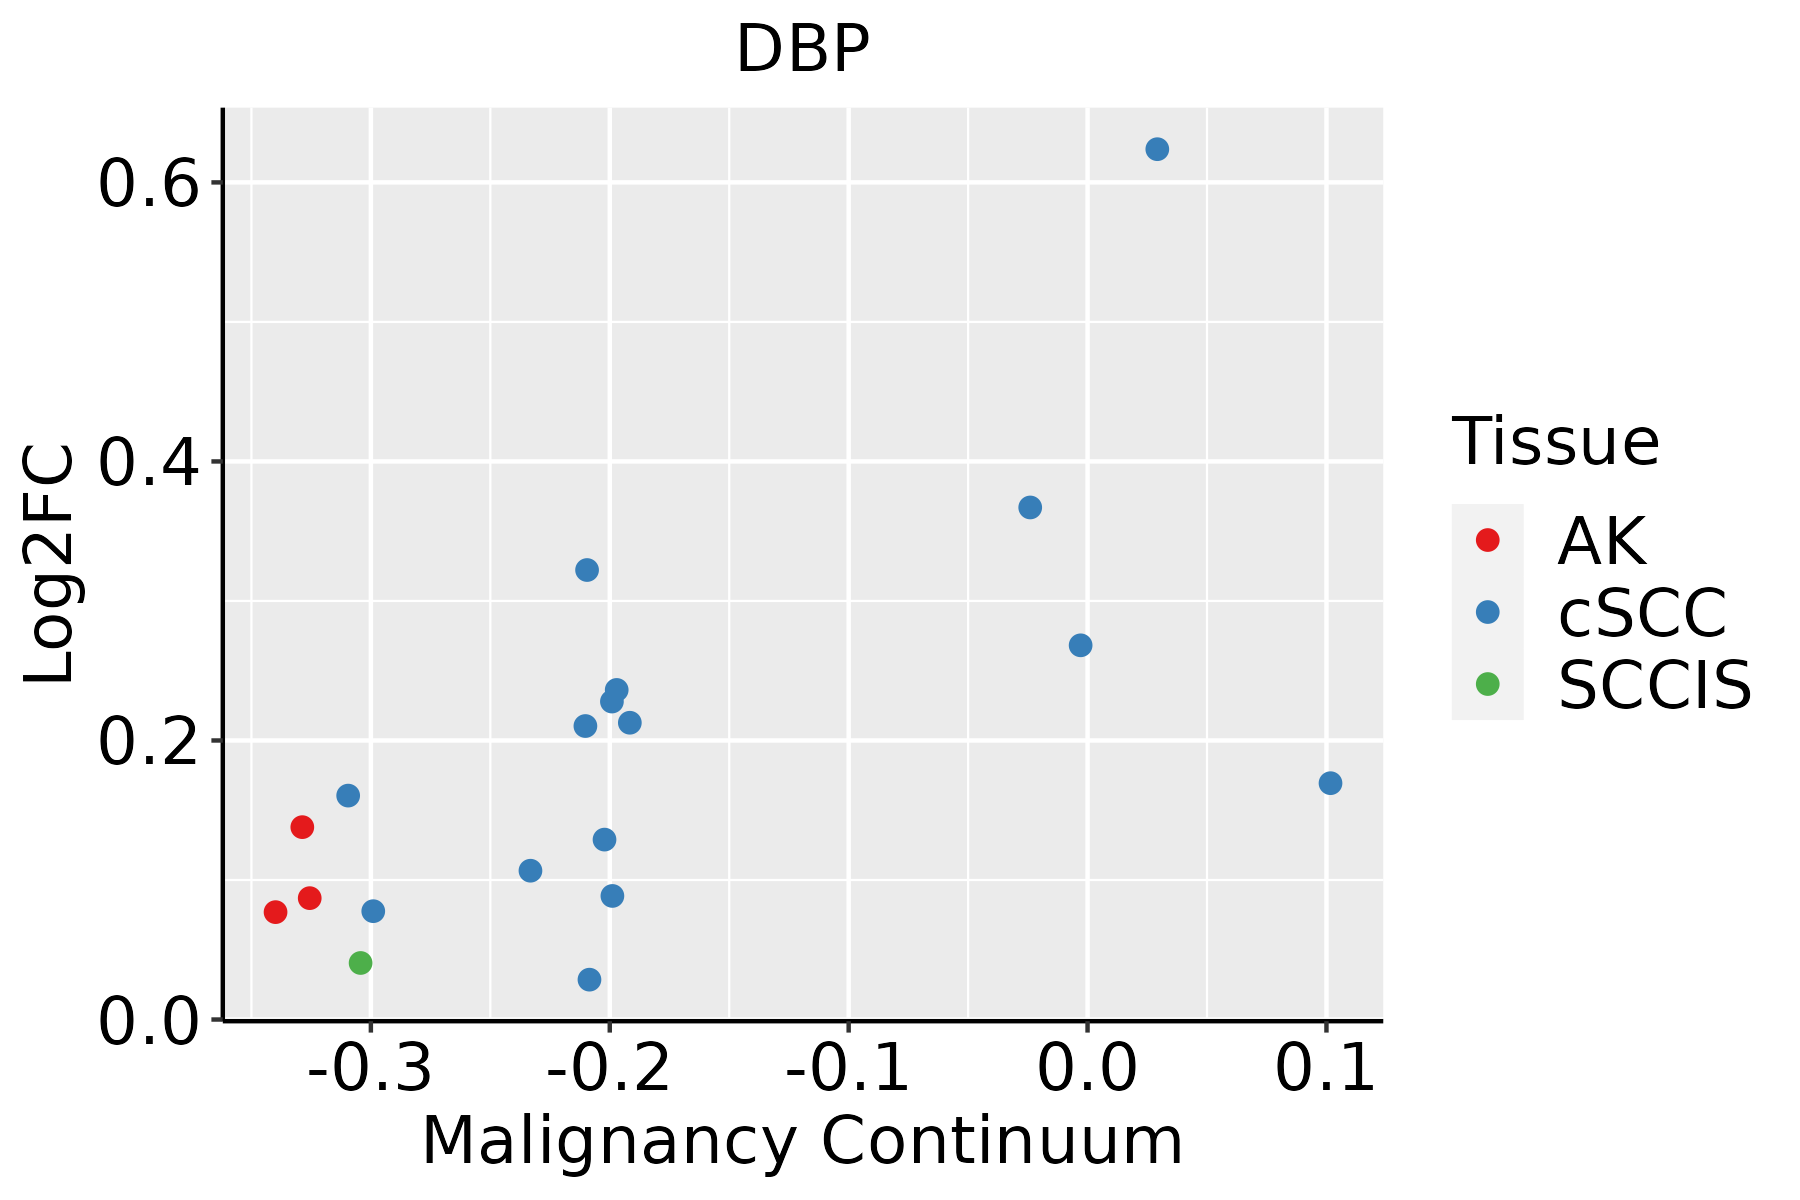 | AK: Actinic keratosis |
| cSCC: Cutaneous squamous cell carcinoma |
| SCCIS:squamous cell carcinoma in situ |
| Thyroid | 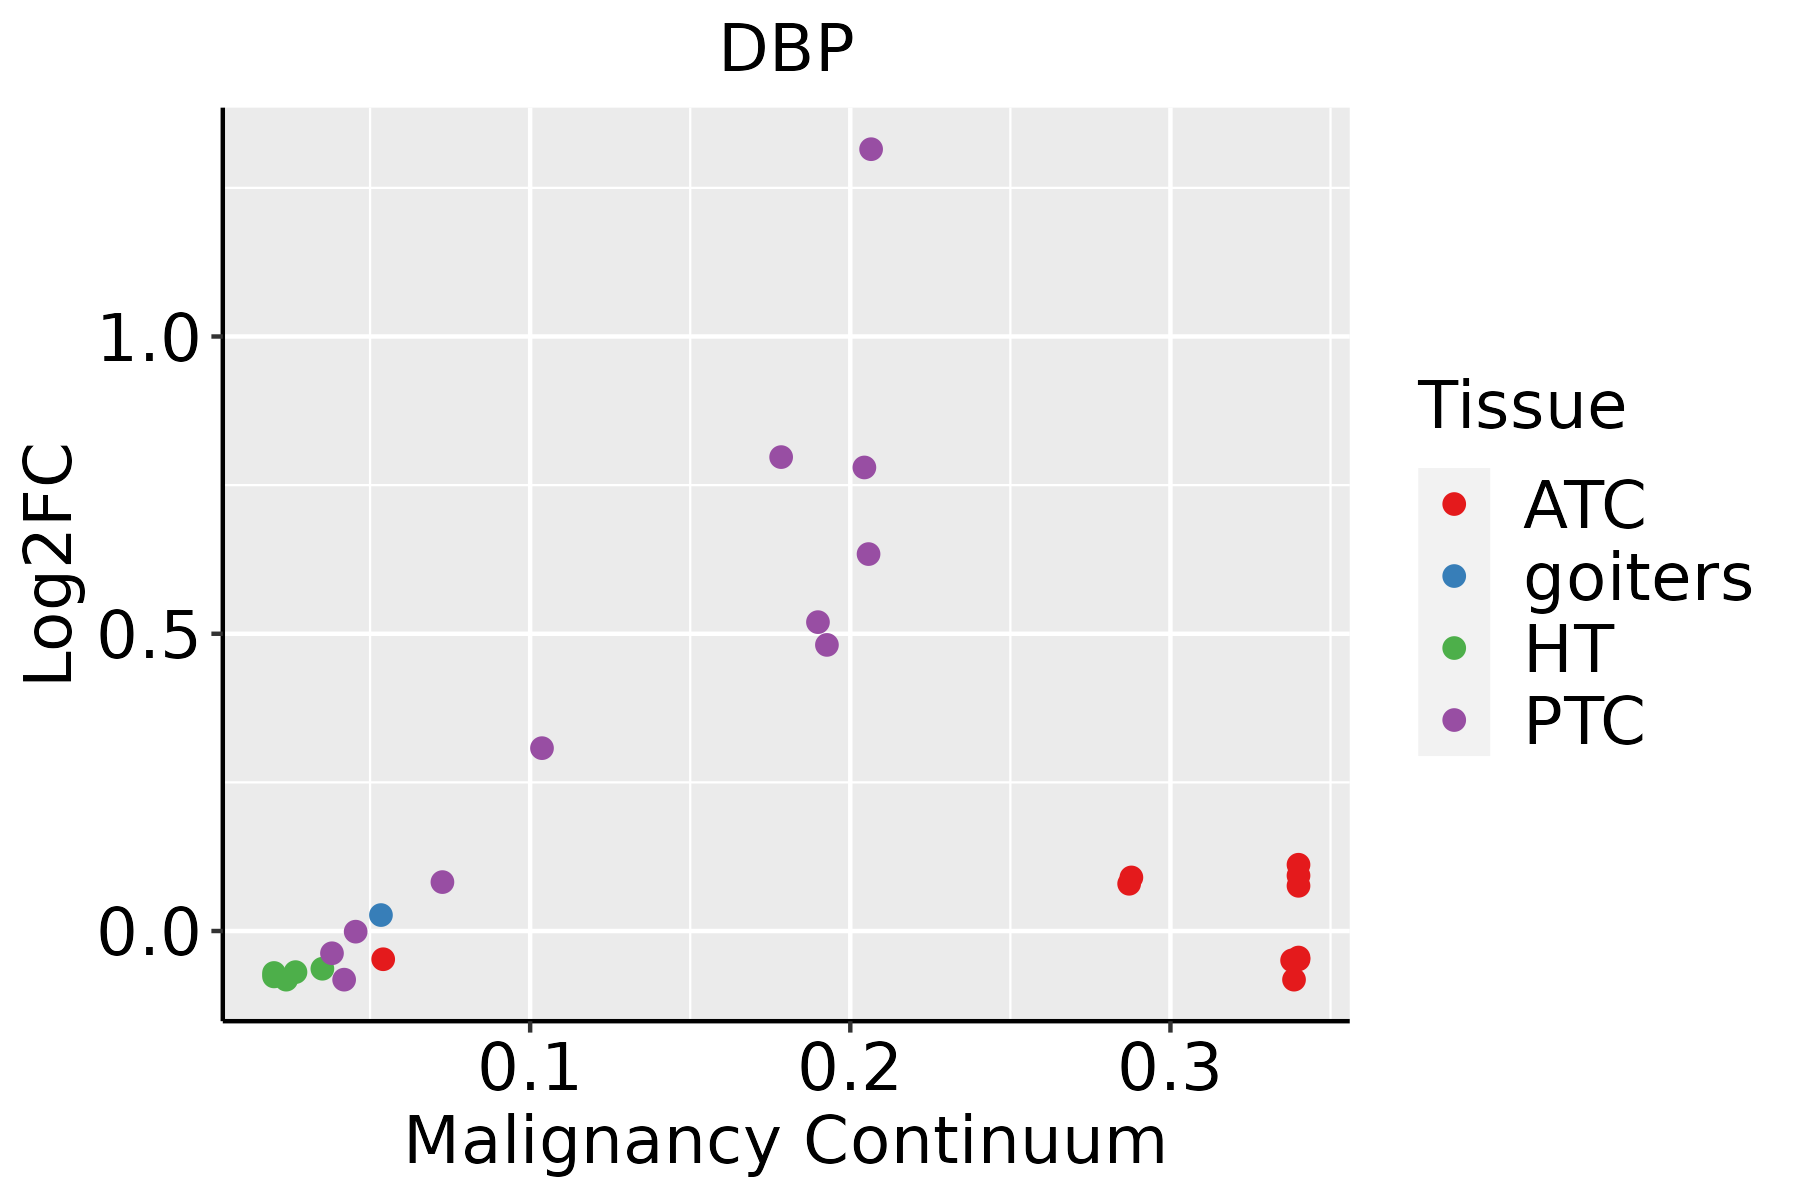 | ATC: Anaplastic thyroid cancer |
| HT: Hashimoto's thyroiditis |
| PTC: Papillary thyroid cancer |
| GO ID | Tissue | Disease Stage | Description | Gene Ratio | Bg Ratio | pvalue | p.adjust | Count |
| GO:0016032 | Colorectum | AD | viral process | 168/3918 | 415/18723 | 4.67e-20 | 3.66e-17 | 168 |
| GO:0008380 | Colorectum | AD | RNA splicing | 169/3918 | 434/18723 | 3.59e-18 | 2.04e-15 | 169 |
| GO:0009896 | Colorectum | AD | positive regulation of catabolic process | 180/3918 | 492/18723 | 4.33e-16 | 1.94e-13 | 180 |
| GO:1903311 | Colorectum | AD | regulation of mRNA metabolic process | 117/3918 | 288/18723 | 1.69e-14 | 4.23e-12 | 117 |
| GO:0031331 | Colorectum | AD | positive regulation of cellular catabolic process | 156/3918 | 427/18723 | 4.68e-14 | 1.05e-11 | 156 |
| GO:0009895 | Colorectum | AD | negative regulation of catabolic process | 124/3918 | 320/18723 | 1.66e-13 | 3.35e-11 | 124 |
| GO:1903829 | Colorectum | AD | positive regulation of cellular protein localization | 110/3918 | 276/18723 | 4.58e-13 | 8.44e-11 | 110 |
| GO:0031330 | Colorectum | AD | negative regulation of cellular catabolic process | 104/3918 | 262/18723 | 2.66e-12 | 3.96e-10 | 104 |
| GO:0072594 | Colorectum | AD | establishment of protein localization to organelle | 148/3918 | 422/18723 | 7.95e-12 | 1.04e-09 | 148 |
| GO:0031647 | Colorectum | AD | regulation of protein stability | 108/3918 | 298/18723 | 6.33e-10 | 5.08e-08 | 108 |
| GO:0006401 | Colorectum | AD | RNA catabolic process | 102/3918 | 278/18723 | 8.64e-10 | 6.76e-08 | 102 |
| GO:1904951 | Colorectum | AD | positive regulation of establishment of protein localization | 112/3918 | 319/18723 | 2.55e-09 | 1.80e-07 | 112 |
| GO:0044270 | Colorectum | AD | cellular nitrogen compound catabolic process | 147/3918 | 451/18723 | 3.35e-09 | 2.23e-07 | 147 |
| GO:0046700 | Colorectum | AD | heterocycle catabolic process | 145/3918 | 445/18723 | 4.37e-09 | 2.84e-07 | 145 |
| GO:0006402 | Colorectum | AD | mRNA catabolic process | 87/3918 | 232/18723 | 4.40e-09 | 2.84e-07 | 87 |
| GO:0051222 | Colorectum | AD | positive regulation of protein transport | 106/3918 | 303/18723 | 8.45e-09 | 5.08e-07 | 106 |
| GO:0034655 | Colorectum | AD | nucleobase-containing compound catabolic process | 133/3918 | 407/18723 | 1.56e-08 | 9.12e-07 | 133 |
| GO:0019439 | Colorectum | AD | aromatic compound catabolic process | 146/3918 | 467/18723 | 7.48e-08 | 3.84e-06 | 146 |
| GO:1901361 | Colorectum | AD | organic cyclic compound catabolic process | 153/3918 | 495/18723 | 8.23e-08 | 4.18e-06 | 153 |
| GO:0034976 | Colorectum | AD | response to endoplasmic reticulum stress | 90/3918 | 256/18723 | 8.48e-08 | 4.28e-06 | 90 |
| TF | Cell Type | Tissue | Disease Stage | Target Gene | RSS | Regulon Activity |
| DBP | CD8TEXP | Breast | ADJ | HS2ST1,TNFRSF10B,MARCH3, etc. | 6.60e-02 |  |
| DBP | ECM | Breast | IDC | PLTP,SELENOP,CTSF, etc. | 2.43e-01 |  |
| DBP | INCAF | Cervix | CC | TSC22D3,SFRP4,H3-3B, etc. | 3.47e-01 |  |
| DBP | TFH | Liver | Cirrhotic | MIR181A2HG,ZNRF2,NEDD4L, etc. | 4.26e-01 |  |
| DBP | TFH | Liver | HCC | MIR181A2HG,ZNRF2,NEDD4L, etc. | 1.95e-01 |  |
| DBP | BN | Liver | Healthy | MIR181A2HG,ZNRF2,NEDD4L, etc. | 3.78e-02 |  |
| Hugo Symbol | Variant Class | Variant Classification | dbSNP RS | HGVSc | HGVSp | HGVSp Short | SWISSPROT | BIOTYPE | SIFT | PolyPhen | Tumor Sample Barcode | Tissue | Histology | Sex | Age | Stage | Therapy Types | Drugs | Outcome |
| DBP | insertion | Frame_Shift_Ins | novel | c.557_558insAAGA | p.Ser187ArgfsTer21 | p.S187Rfs*21 | Q10586 | protein_coding | | | TCGA-AO-A03R-01 | Breast | breast invasive carcinoma | Female | <65 | I/II | Chemotherapy | doxorubicin | SD |
| DBP | insertion | Frame_Shift_Ins | novel | c.556_557insGGCAGGAGGATCTCTTGAGCTCGGGAGTT | p.Thr186ArgfsTer27 | p.T186Rfs*27 | Q10586 | protein_coding | | | TCGA-AO-A03R-01 | Breast | breast invasive carcinoma | Female | <65 | I/II | Chemotherapy | doxorubicin | SD |
| DBP | insertion | Frame_Shift_Ins | novel | c.829_830insAG | p.Arg277GlnfsTer136 | p.R277Qfs*136 | Q10586 | protein_coding | | | TCGA-B6-A0I6-01 | Breast | breast invasive carcinoma | Female | <65 | I/II | Unknown | Unknown | PD |
| DBP | insertion | In_Frame_Ins | novel | c.626_627insTTTTCTCACAGTCAAGCCTGGGCTTCTCCTTGGGAT | p.Pro209_Ala210insPheLeuThrValLysProGlyLeuLeuLeuGlyIle | p.P209_A210insFLTVKPGLLLGI | Q10586 | protein_coding | | | TCGA-BH-A0HY-01 | Breast | breast invasive carcinoma | Female | <65 | I/II | Hormone Therapy | taxotere | CR |
| DBP | SNV | Missense_Mutation | novel | c.4N>A | p.Ala2Thr | p.A2T | Q10586 | protein_coding | deleterious_low_confidence(0) | benign(0.014) | TCGA-2W-A8YY-01 | Cervix | cervical & endocervical cancer | Female | <65 | I/II | Chemotherapy | cisplatin | CR |
| DBP | SNV | Missense_Mutation | novel | c.829N>T | p.Arg277Trp | p.R277W | Q10586 | protein_coding | deleterious(0) | probably_damaging(1) | TCGA-AA-3845-01 | Colorectum | colon adenocarcinoma | Female | >=65 | I/II | Unknown | Unknown | PD |
| DBP | SNV | Missense_Mutation | novel | c.677N>A | p.Arg226Gln | p.R226Q | Q10586 | protein_coding | deleterious(0) | probably_damaging(0.924) | TCGA-A5-A1OF-01 | Endometrium | uterine corpus endometrioid carcinoma | Female | <65 | I/II | Unknown | Unknown | SD |
| DBP | SNV | Missense_Mutation | novel | c.949C>G | p.Arg317Gly | p.R317G | Q10586 | protein_coding | deleterious(0) | possibly_damaging(0.532) | TCGA-AJ-A2QM-01 | Endometrium | uterine corpus endometrioid carcinoma | Female | >=65 | I/II | Chemotherapy | carboplatin | CR |
| DBP | SNV | Missense_Mutation | novel | c.134N>T | p.Ala45Val | p.A45V | Q10586 | protein_coding | deleterious(0.03) | benign(0.006) | TCGA-AP-A0LS-01 | Endometrium | uterine corpus endometrioid carcinoma | Female | <65 | I/II | Unknown | Unknown | SD |
| DBP | SNV | Missense_Mutation | | c.817N>T | p.Arg273Cys | p.R273C | Q10586 | protein_coding | deleterious(0) | probably_damaging(1) | TCGA-D1-A167-01 | Endometrium | uterine corpus endometrioid carcinoma | Female | >=65 | I/II | Unknown | Unknown | SD |


