
|
|||||
|
 | |
| |
| |
| |
| |
| |
|
Gene: DBNL |
Gene summary for DBNL |
| Gene information | Species | Human | Gene symbol | DBNL | Gene ID | 28988 |
| Gene name | drebrin like | |
| Gene Alias | ABP1 | |
| Cytomap | 7p13 | |
| Gene Type | protein-coding | GO ID | GO:0000902 | UniProtAcc | Q9UJU6 |
Top |
Malignant transformation analysis |
| Identification of the aberrant gene expression in precancerous and cancerous lesions by comparing the gene expression of stem-like cells in diseased tissues with normal stem cells |
| Entrez ID | Symbol | Replicates | Species | Organ | Tissue | Adj P-value | Log2FC | Malignancy |
| 28988 | DBNL | LZE4T | Human | Esophagus | ESCC | 9.05e-13 | 4.70e-01 | 0.0811 |
| 28988 | DBNL | LZE5T | Human | Esophagus | ESCC | 1.58e-05 | 2.70e-01 | 0.0514 |
| 28988 | DBNL | LZE7T | Human | Esophagus | ESCC | 1.57e-08 | 4.29e-01 | 0.0667 |
| 28988 | DBNL | LZE8T | Human | Esophagus | ESCC | 4.60e-09 | 4.67e-01 | 0.067 |
| 28988 | DBNL | LZE20T | Human | Esophagus | ESCC | 7.56e-05 | 3.90e-01 | 0.0662 |
| 28988 | DBNL | LZE22T | Human | Esophagus | ESCC | 1.82e-08 | 5.16e-01 | 0.068 |
| 28988 | DBNL | LZE24T | Human | Esophagus | ESCC | 4.72e-24 | 6.02e-01 | 0.0596 |
| 28988 | DBNL | LZE6T | Human | Esophagus | ESCC | 1.15e-08 | 5.35e-01 | 0.0845 |
| 28988 | DBNL | P1T-E | Human | Esophagus | ESCC | 3.43e-16 | 8.52e-01 | 0.0875 |
| 28988 | DBNL | P2T-E | Human | Esophagus | ESCC | 3.64e-40 | 7.30e-01 | 0.1177 |
| 28988 | DBNL | P4T-E | Human | Esophagus | ESCC | 1.59e-30 | 8.07e-01 | 0.1323 |
| 28988 | DBNL | P5T-E | Human | Esophagus | ESCC | 2.92e-30 | 5.68e-01 | 0.1327 |
| 28988 | DBNL | P8T-E | Human | Esophagus | ESCC | 1.75e-23 | 4.83e-01 | 0.0889 |
| 28988 | DBNL | P9T-E | Human | Esophagus | ESCC | 2.78e-20 | 4.29e-01 | 0.1131 |
| 28988 | DBNL | P10T-E | Human | Esophagus | ESCC | 1.31e-23 | 4.53e-01 | 0.116 |
| 28988 | DBNL | P11T-E | Human | Esophagus | ESCC | 1.76e-22 | 9.08e-01 | 0.1426 |
| 28988 | DBNL | P12T-E | Human | Esophagus | ESCC | 1.34e-32 | 6.42e-01 | 0.1122 |
| 28988 | DBNL | P15T-E | Human | Esophagus | ESCC | 1.97e-33 | 7.91e-01 | 0.1149 |
| 28988 | DBNL | P16T-E | Human | Esophagus | ESCC | 4.74e-42 | 8.36e-01 | 0.1153 |
| 28988 | DBNL | P17T-E | Human | Esophagus | ESCC | 4.37e-19 | 1.11e+00 | 0.1278 |
| Page: 1 2 3 4 5 6 |
| Tissue | Expression Dynamics | Abbreviation |
| Esophagus |  | ESCC: Esophageal squamous cell carcinoma |
| HGIN: High-grade intraepithelial neoplasias | ||
| LGIN: Low-grade intraepithelial neoplasias | ||
| Liver |  | HCC: Hepatocellular carcinoma |
| NAFLD: Non-alcoholic fatty liver disease | ||
| Oral Cavity | 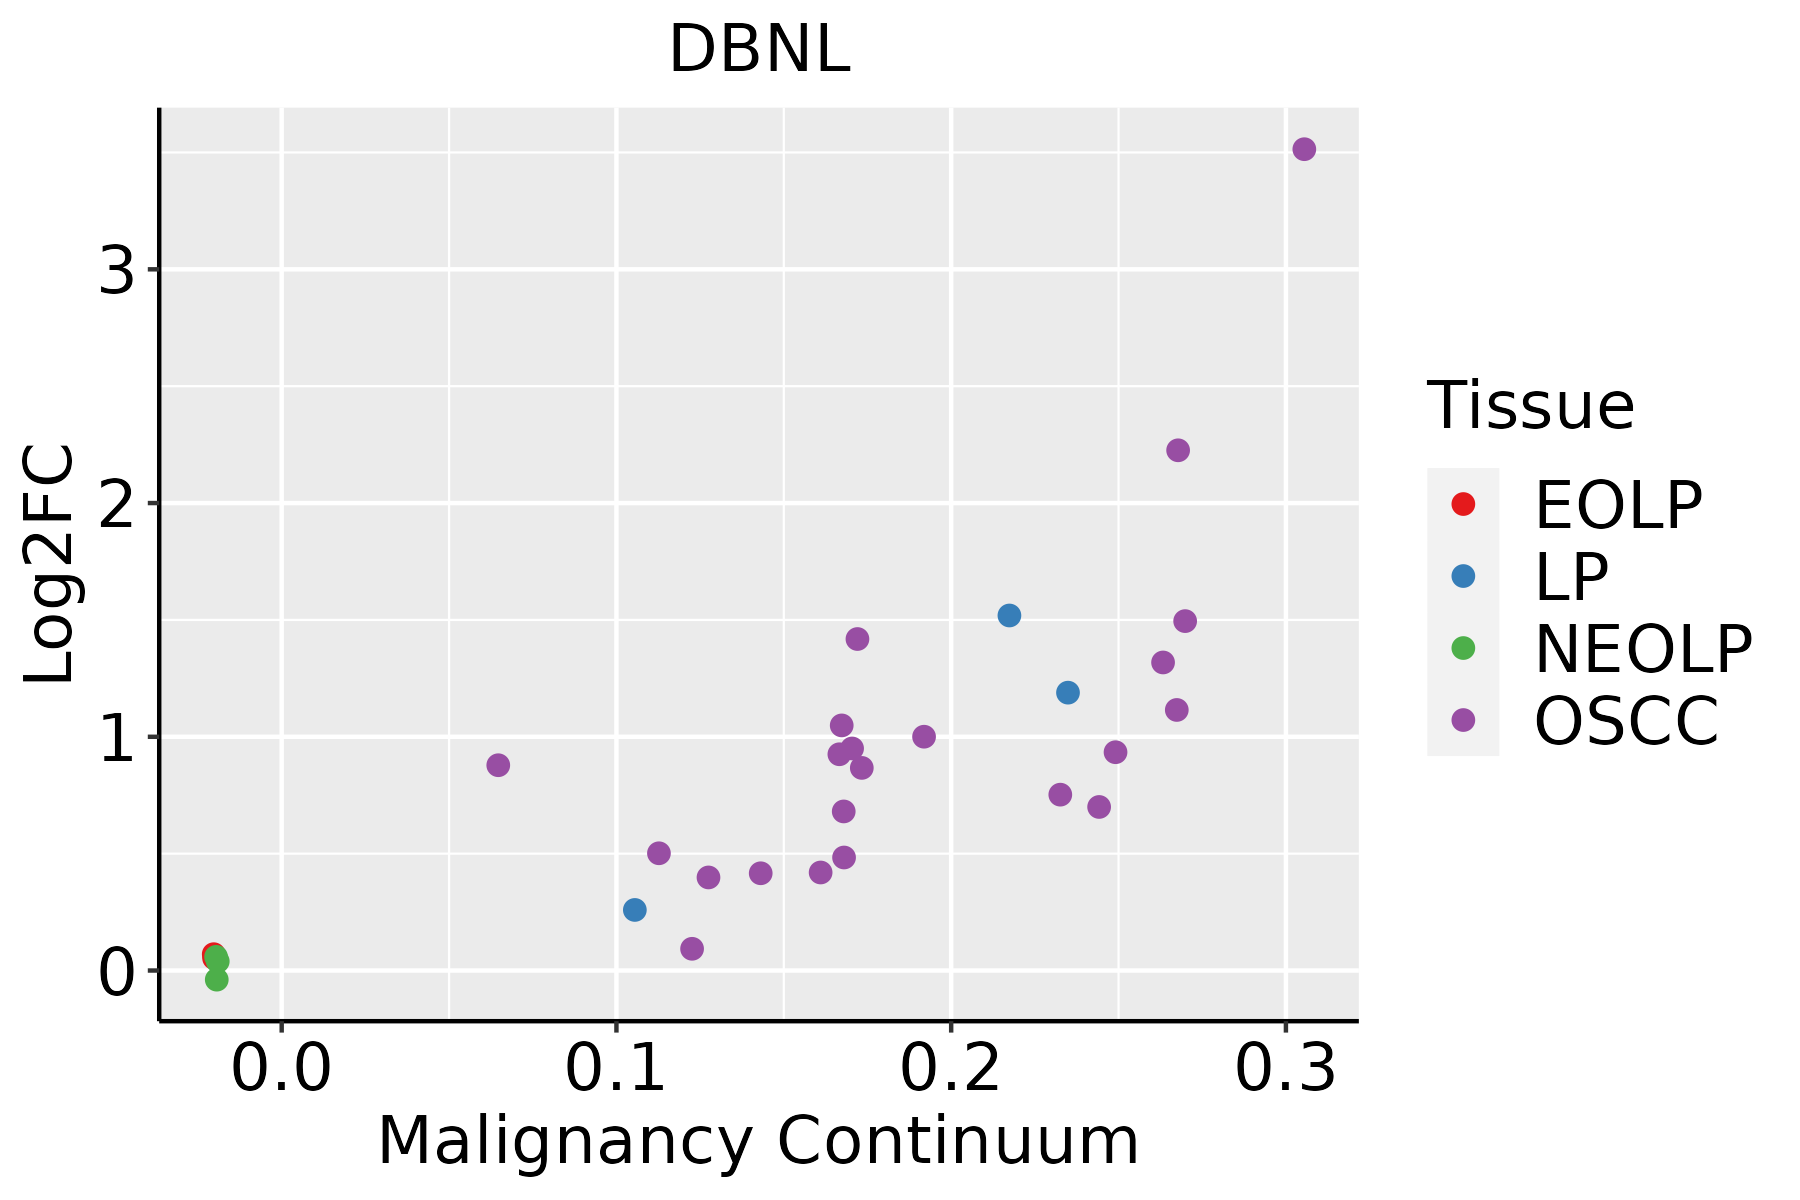 | EOLP: Erosive Oral lichen planus |
| LP: leukoplakia | ||
| NEOLP: Non-erosive oral lichen planus | ||
| OSCC: Oral squamous cell carcinoma | ||
| Skin | 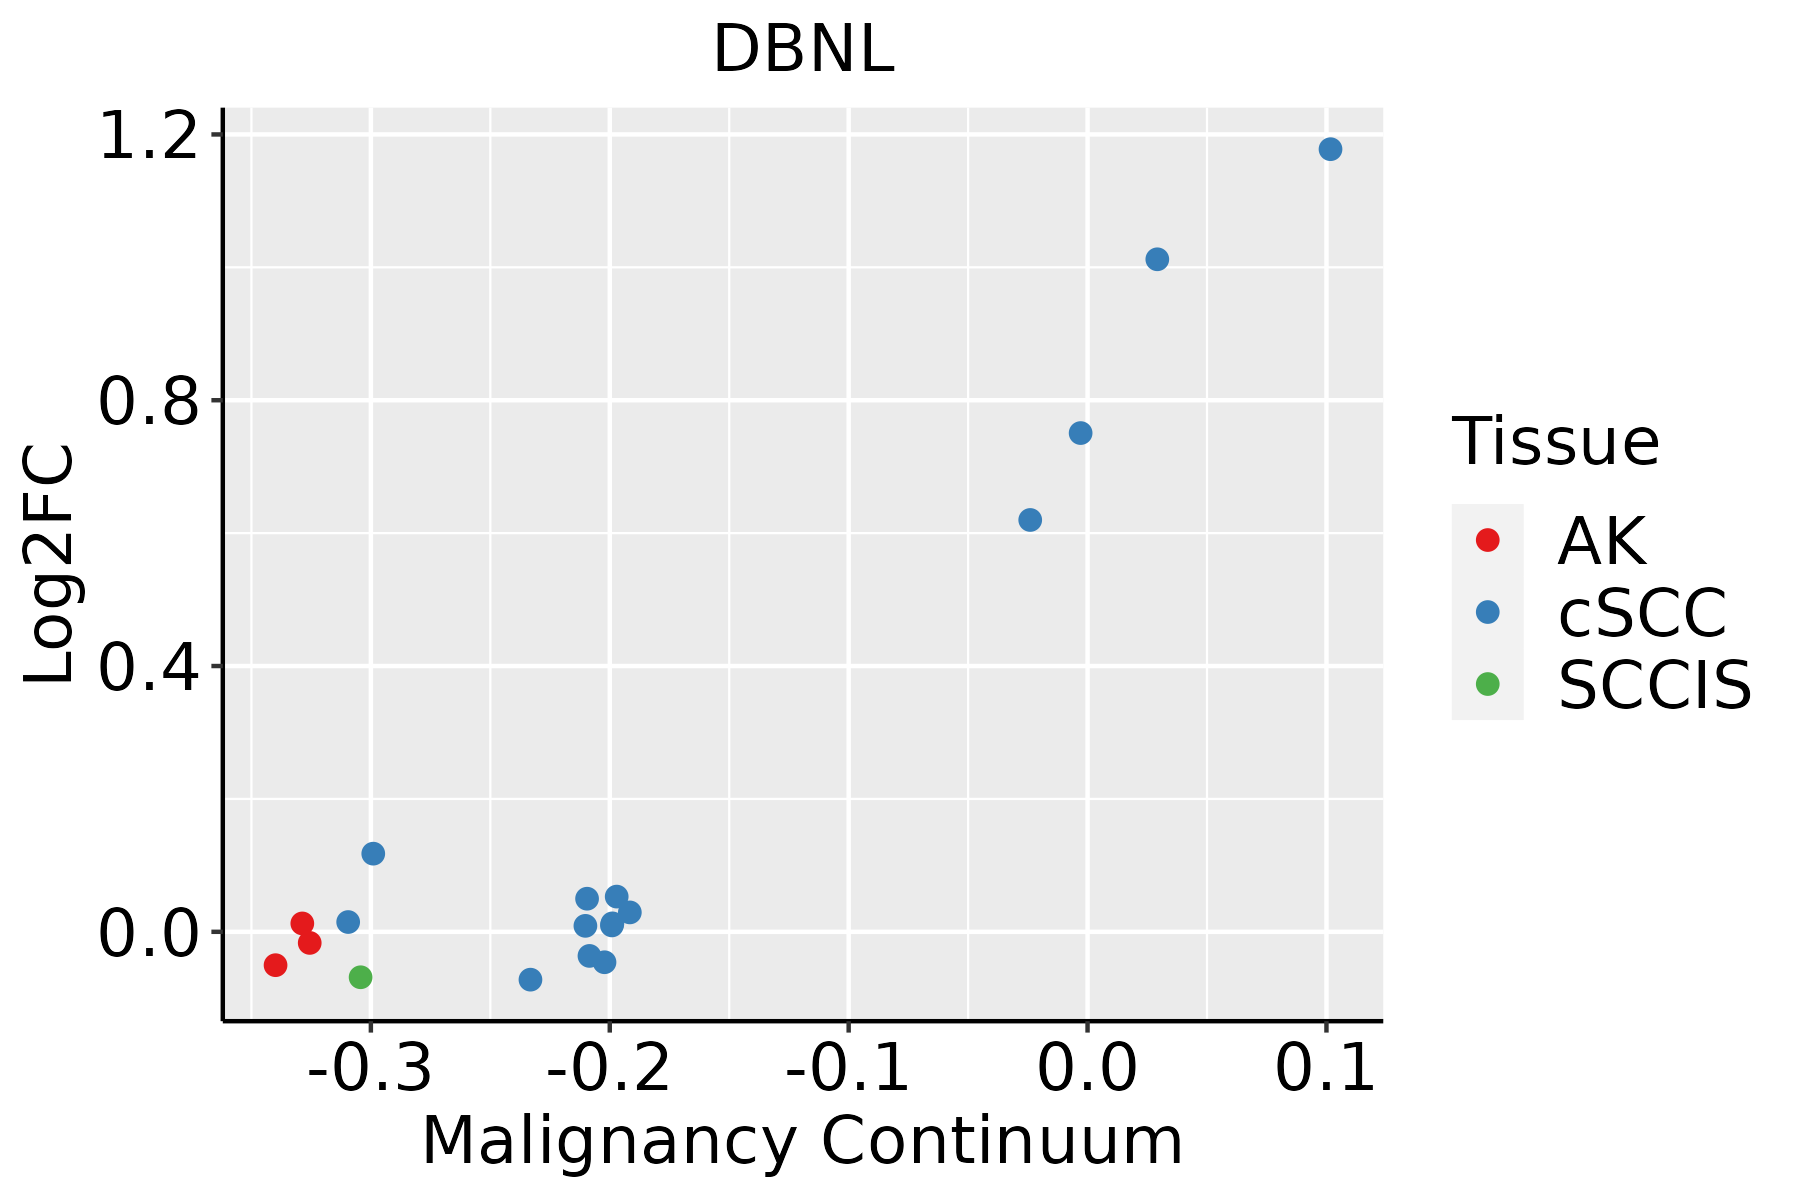 | AK: Actinic keratosis |
| cSCC: Cutaneous squamous cell carcinoma | ||
| SCCIS:squamous cell carcinoma in situ | ||
| Thyroid |  | ATC: Anaplastic thyroid cancer |
| HT: Hashimoto's thyroiditis | ||
| PTC: Papillary thyroid cancer |
| ∗log2FC in expression of this searched gene in stem-like cells from each diseased tissue sample relative to stem-like cells in normal samples in each tissue plotted against the malignancy continuum. Samples are colored based on if they are from different disease stage. |
Top |
Malignant transformation related pathway analysis |
| Find out the enriched GO biological processes and KEGG pathways involved in transition from healthy to precancer to cancer |
| Tissue | Disease Stage | Enriched GO biological Processes |
| Colorectum | AD |  |
| Colorectum | SER |  |
| Colorectum | MSS |  |
| Colorectum | MSI-H |  |
| Colorectum | FAP |  |
| ∗Top 15 enriched GO BP terms are showed in the bar plot of each disease state in each tissue. Each row represents a significant GO biological process which is colored according to the -log10(p.adjust). |
| Page: 1 2 3 4 5 6 7 8 9 |
| GO ID | Tissue | Disease Stage | Description | Gene Ratio | Bg Ratio | pvalue | p.adjust | Count |
| GO:0043254111 | Esophagus | ESCC | regulation of protein-containing complex assembly | 278/8552 | 428/18723 | 3.81e-16 | 2.77e-14 | 278 |
| GO:1902903111 | Esophagus | ESCC | regulation of supramolecular fiber organization | 237/8552 | 383/18723 | 9.06e-11 | 2.75e-09 | 237 |
| GO:0016049110 | Esophagus | ESCC | cell growth | 289/8552 | 482/18723 | 1.29e-10 | 3.77e-09 | 289 |
| GO:000155819 | Esophagus | ESCC | regulation of cell growth | 248/8552 | 414/18723 | 2.97e-09 | 6.45e-08 | 248 |
| GO:0051258111 | Esophagus | ESCC | protein polymerization | 183/8552 | 297/18723 | 1.94e-08 | 3.75e-07 | 183 |
| GO:000701527 | Esophagus | ESCC | actin filament organization | 259/8552 | 442/18723 | 2.37e-08 | 4.50e-07 | 259 |
| GO:003253520 | Esophagus | ESCC | regulation of cellular component size | 227/8552 | 383/18723 | 4.77e-08 | 8.60e-07 | 227 |
| GO:000726510 | Esophagus | ESCC | Ras protein signal transduction | 201/8552 | 337/18723 | 1.44e-07 | 2.30e-06 | 201 |
| GO:0032970111 | Esophagus | ESCC | regulation of actin filament-based process | 231/8552 | 397/18723 | 2.91e-07 | 4.20e-06 | 231 |
| GO:0032956111 | Esophagus | ESCC | regulation of actin cytoskeleton organization | 210/8552 | 358/18723 | 4.40e-07 | 6.00e-06 | 210 |
| GO:0032271111 | Esophagus | ESCC | regulation of protein polymerization | 143/8552 | 233/18723 | 9.21e-07 | 1.17e-05 | 143 |
| GO:011005327 | Esophagus | ESCC | regulation of actin filament organization | 166/8552 | 278/18723 | 1.54e-06 | 1.85e-05 | 166 |
| GO:002260420 | Esophagus | ESCC | regulation of cell morphogenesis | 180/8552 | 309/18723 | 5.19e-06 | 5.45e-05 | 180 |
| GO:003134616 | Esophagus | ESCC | positive regulation of cell projection organization | 201/8552 | 353/18723 | 1.19e-05 | 1.11e-04 | 201 |
| GO:00166019 | Esophagus | ESCC | Rac protein signal transduction | 33/8552 | 42/18723 | 1.35e-05 | 1.23e-04 | 33 |
| GO:001072010 | Esophagus | ESCC | positive regulation of cell development | 172/8552 | 298/18723 | 1.74e-05 | 1.55e-04 | 172 |
| GO:000815420 | Esophagus | ESCC | actin polymerization or depolymerization | 130/8552 | 218/18723 | 2.19e-05 | 1.88e-04 | 130 |
| GO:000689818 | Esophagus | ESCC | receptor-mediated endocytosis | 142/8552 | 244/18723 | 5.22e-05 | 4.05e-04 | 142 |
| GO:005076710 | Esophagus | ESCC | regulation of neurogenesis | 203/8552 | 364/18723 | 6.10e-05 | 4.68e-04 | 203 |
| GO:0030041110 | Esophagus | ESCC | actin filament polymerization | 114/8552 | 191/18723 | 6.46e-05 | 4.92e-04 | 114 |
| Page: 1 2 3 4 5 6 7 8 9 10 11 12 13 14 15 16 17 18 |
| Pathway ID | Tissue | Disease Stage | Description | Gene Ratio | Bg Ratio | pvalue | p.adjust | qvalue | Count |
| Page: 1 |
Top |
Cell-cell communication analysis |
| Identification of potential cell-cell interactions between two cell types and their ligand-receptor pairs for different disease states |
| Ligand | Receptor | LRpair | Pathway | Tissue | Disease Stage |
| Page: 1 |
Top |
Single-cell gene regulatory network inference analysis |
| Find out the significant the regulons (TFs) and the target genes of each regulon across cell types for different disease states |
| TF | Cell Type | Tissue | Disease Stage | Target Gene | RSS | Regulon Activity |
| ∗The dot plots of a searched regulon are shown for all cell subpopulations in each disease state of each tissue based on the regulon specific score inferred using pySCENIC and by calculating the average expression. |
| Page: 1 |
Top |
Somatic mutation of malignant transformation related genes |
| Annotation of somatic variants for genes involved in malignant transformation |
| Hugo Symbol | Variant Class | Variant Classification | dbSNP RS | HGVSc | HGVSp | HGVSp Short | SWISSPROT | BIOTYPE | SIFT | PolyPhen | Tumor Sample Barcode | Tissue | Histology | Sex | Age | Stage | Therapy Types | Drugs | Outcome |
| DBNL | SNV | Missense_Mutation | c.970G>A | p.Glu324Lys | p.E324K | Q9UJU6 | protein_coding | tolerated(0.57) | benign(0.006) | TCGA-3C-AALI-01 | Breast | breast invasive carcinoma | Female | <65 | I/II | Unspecific | Poly E | Complete Response | |
| DBNL | SNV | Missense_Mutation | c.970N>A | p.Glu324Lys | p.E324K | Q9UJU6 | protein_coding | tolerated(0.57) | benign(0.006) | TCGA-AC-A23H-01 | Breast | breast invasive carcinoma | Female | >=65 | I/II | Unknown | Unknown | PD | |
| DBNL | insertion | Nonsense_Mutation | novel | c.326_327insATAACTGT | p.Gly110Ter | p.G110* | Q9UJU6 | protein_coding | TCGA-A2-A0CP-01 | Breast | breast invasive carcinoma | Female | <65 | I/II | Chemotherapy | cytoxan | SD | ||
| DBNL | SNV | Missense_Mutation | novel | c.104G>A | p.Gly35Asp | p.G35D | Q9UJU6 | protein_coding | deleterious(0) | probably_damaging(1) | TCGA-2W-A8YY-01 | Cervix | cervical & endocervical cancer | Female | <65 | I/II | Chemotherapy | cisplatin | CR |
| DBNL | SNV | Missense_Mutation | rs541074419 | c.688G>A | p.Glu230Lys | p.E230K | Q9UJU6 | protein_coding | tolerated(0.06) | benign(0.006) | TCGA-JX-A3Q0-01 | Cervix | cervical & endocervical cancer | Female | <65 | III/IV | Unknown | Unknown | SD |
| DBNL | SNV | Missense_Mutation | novel | c.401A>T | p.Lys134Met | p.K134M | Q9UJU6 | protein_coding | deleterious(0) | probably_damaging(0.973) | TCGA-AA-3949-01 | Colorectum | colon adenocarcinoma | Female | >=65 | III/IV | Unknown | Unknown | SD |
| DBNL | SNV | Missense_Mutation | c.176N>A | p.Ser59Asn | p.S59N | Q9UJU6 | protein_coding | deleterious(0) | probably_damaging(0.994) | TCGA-AZ-5403-01 | Colorectum | colon adenocarcinoma | Male | <65 | I/II | Unknown | Unknown | PD | |
| DBNL | SNV | Missense_Mutation | c.169C>T | p.Leu57Phe | p.L57F | Q9UJU6 | protein_coding | deleterious(0.01) | benign(0.336) | TCGA-F4-6856-01 | Colorectum | colon adenocarcinoma | Male | <65 | I/II | Ancillary | leucovorin | CR | |
| DBNL | SNV | Missense_Mutation | novel | c.1022C>T | p.Ala341Val | p.A341V | Q9UJU6 | protein_coding | tolerated(0.21) | possibly_damaging(0.557) | TCGA-A5-A0G1-01 | Endometrium | uterine corpus endometrioid carcinoma | Female | >=65 | I/II | Unknown | Unknown | SD |
| DBNL | SNV | Missense_Mutation | rs376675318 | c.668G>A | p.Arg223His | p.R223H | Q9UJU6 | protein_coding | tolerated(0.07) | benign(0.057) | TCGA-AJ-A3BH-01 | Endometrium | uterine corpus endometrioid carcinoma | Female | Unknown | I/II | Unknown | Unknown | SD |
| Page: 1 2 3 4 |
Top |
Related drugs of malignant transformation related genes |
| Identification of chemicals and drugs interact with genes involved in malignant transfromation |
| (DGIdb 4.0) |
| Entrez ID | Symbol | Category | Interaction Types | Drug Claim Name | Drug Name | PMIDs |
| Page: 1 |

Copyright 2023-Present -The University of Texas Health Science Center at Houston |