
|
|||||
|
 | |
| |
| |
| |
| |
| |
|
Gene: DBNDD2 |
Gene summary for DBNDD2 |
| Gene information | Species | Human | Gene symbol | DBNDD2 | Gene ID | 55861 |
| Gene name | dysbindin domain containing 2 | |
| Gene Alias | C20orf35 | |
| Cytomap | 20q13.12 | |
| Gene Type | protein-coding | GO ID | GO:0001932 | UniProtAcc | Q9BQY9 |
Top |
Malignant transformation analysis |
| Identification of the aberrant gene expression in precancerous and cancerous lesions by comparing the gene expression of stem-like cells in diseased tissues with normal stem cells |
| Entrez ID | Symbol | Replicates | Species | Organ | Tissue | Adj P-value | Log2FC | Malignancy |
| 55861 | DBNDD2 | HTA11_3410_2000001011 | Human | Colorectum | AD | 4.23e-12 | 2.46e-01 | 0.0155 |
| 55861 | DBNDD2 | HTA11_2487_2000001011 | Human | Colorectum | SER | 5.63e-22 | 4.69e-01 | -0.1808 |
| 55861 | DBNDD2 | HTA11_2951_2000001011 | Human | Colorectum | AD | 3.40e-02 | 2.80e-01 | 0.0216 |
| 55861 | DBNDD2 | HTA11_1938_2000001011 | Human | Colorectum | AD | 8.58e-13 | 3.71e-01 | -0.0811 |
| 55861 | DBNDD2 | HTA11_78_2000001011 | Human | Colorectum | AD | 8.35e-11 | 3.25e-01 | -0.1088 |
| 55861 | DBNDD2 | HTA11_347_2000001011 | Human | Colorectum | AD | 8.14e-26 | 5.12e-01 | -0.1954 |
| 55861 | DBNDD2 | HTA11_411_2000001011 | Human | Colorectum | SER | 7.44e-09 | 7.74e-01 | -0.2602 |
| 55861 | DBNDD2 | HTA11_2112_2000001011 | Human | Colorectum | SER | 6.90e-09 | 5.33e-01 | -0.2196 |
| 55861 | DBNDD2 | HTA11_3361_2000001011 | Human | Colorectum | AD | 1.41e-08 | 3.30e-01 | -0.1207 |
| 55861 | DBNDD2 | HTA11_83_2000001011 | Human | Colorectum | SER | 1.12e-08 | 3.95e-01 | -0.1526 |
| 55861 | DBNDD2 | HTA11_696_2000001011 | Human | Colorectum | AD | 6.91e-23 | 4.41e-01 | -0.1464 |
| 55861 | DBNDD2 | HTA11_866_2000001011 | Human | Colorectum | AD | 3.19e-14 | 3.37e-01 | -0.1001 |
| 55861 | DBNDD2 | HTA11_1391_2000001011 | Human | Colorectum | AD | 1.35e-16 | 4.26e-01 | -0.059 |
| 55861 | DBNDD2 | HTA11_2992_2000001011 | Human | Colorectum | SER | 2.52e-10 | 4.85e-01 | -0.1706 |
| 55861 | DBNDD2 | HTA11_5212_2000001011 | Human | Colorectum | AD | 2.57e-15 | 6.19e-01 | -0.2061 |
| 55861 | DBNDD2 | HTA11_5216_2000001011 | Human | Colorectum | SER | 3.03e-06 | 4.90e-01 | -0.1462 |
| 55861 | DBNDD2 | HTA11_546_2000001011 | Human | Colorectum | AD | 1.56e-06 | 2.45e-01 | -0.0842 |
| 55861 | DBNDD2 | HTA11_7862_2000001011 | Human | Colorectum | AD | 1.01e-11 | 4.52e-01 | -0.0179 |
| 55861 | DBNDD2 | HTA11_866_3004761011 | Human | Colorectum | AD | 6.44e-22 | 4.72e-01 | 0.096 |
| 55861 | DBNDD2 | HTA11_4255_2000001011 | Human | Colorectum | SER | 3.03e-06 | 4.15e-01 | 0.0446 |
| Page: 1 2 3 4 5 6 |
| Tissue | Expression Dynamics | Abbreviation |
| Colorectum (GSE201348) |  | FAP: Familial adenomatous polyposis |
| CRC: Colorectal cancer | ||
| Colorectum (HTA11) |  | AD: Adenomas |
| SER: Sessile serrated lesions | ||
| MSI-H: Microsatellite-high colorectal cancer | ||
| MSS: Microsatellite stable colorectal cancer | ||
| Esophagus | 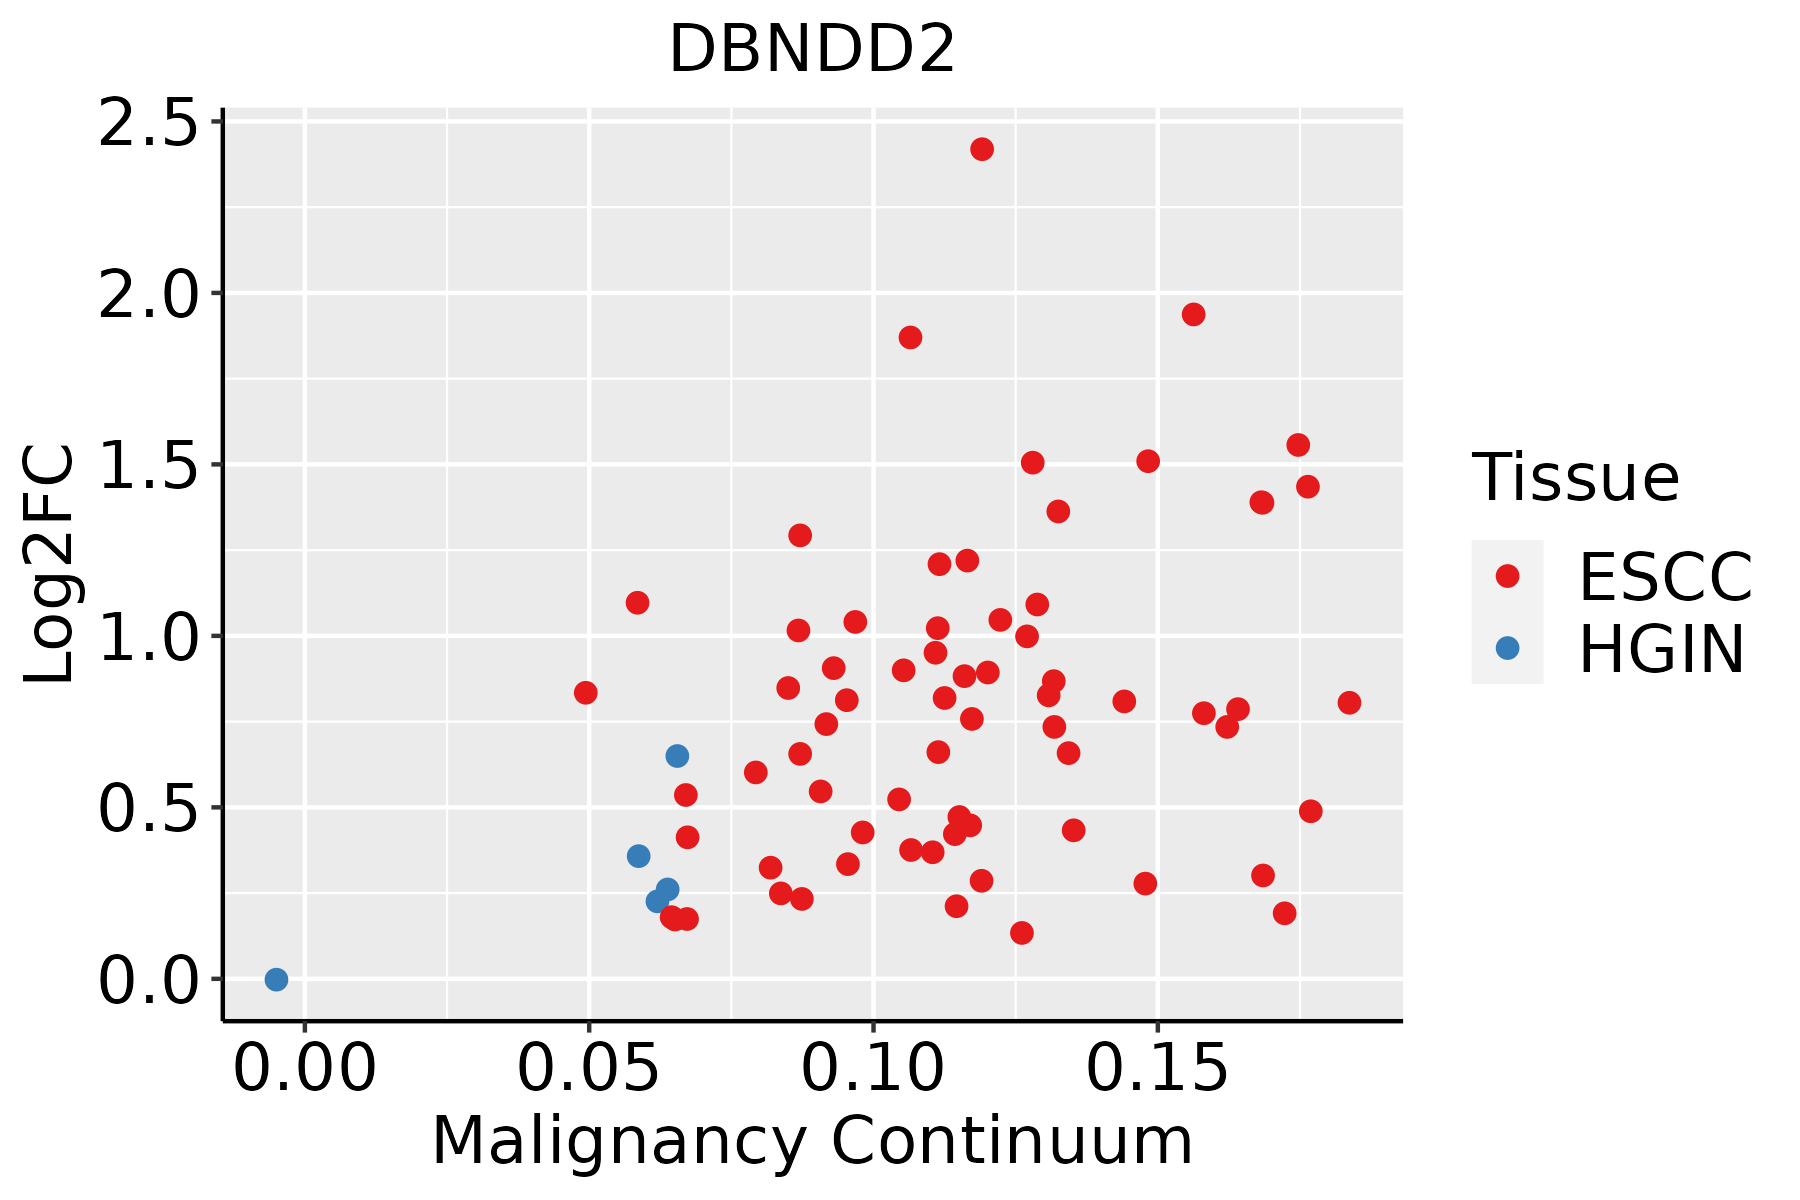 | ESCC: Esophageal squamous cell carcinoma |
| HGIN: High-grade intraepithelial neoplasias | ||
| LGIN: Low-grade intraepithelial neoplasias | ||
| Liver | 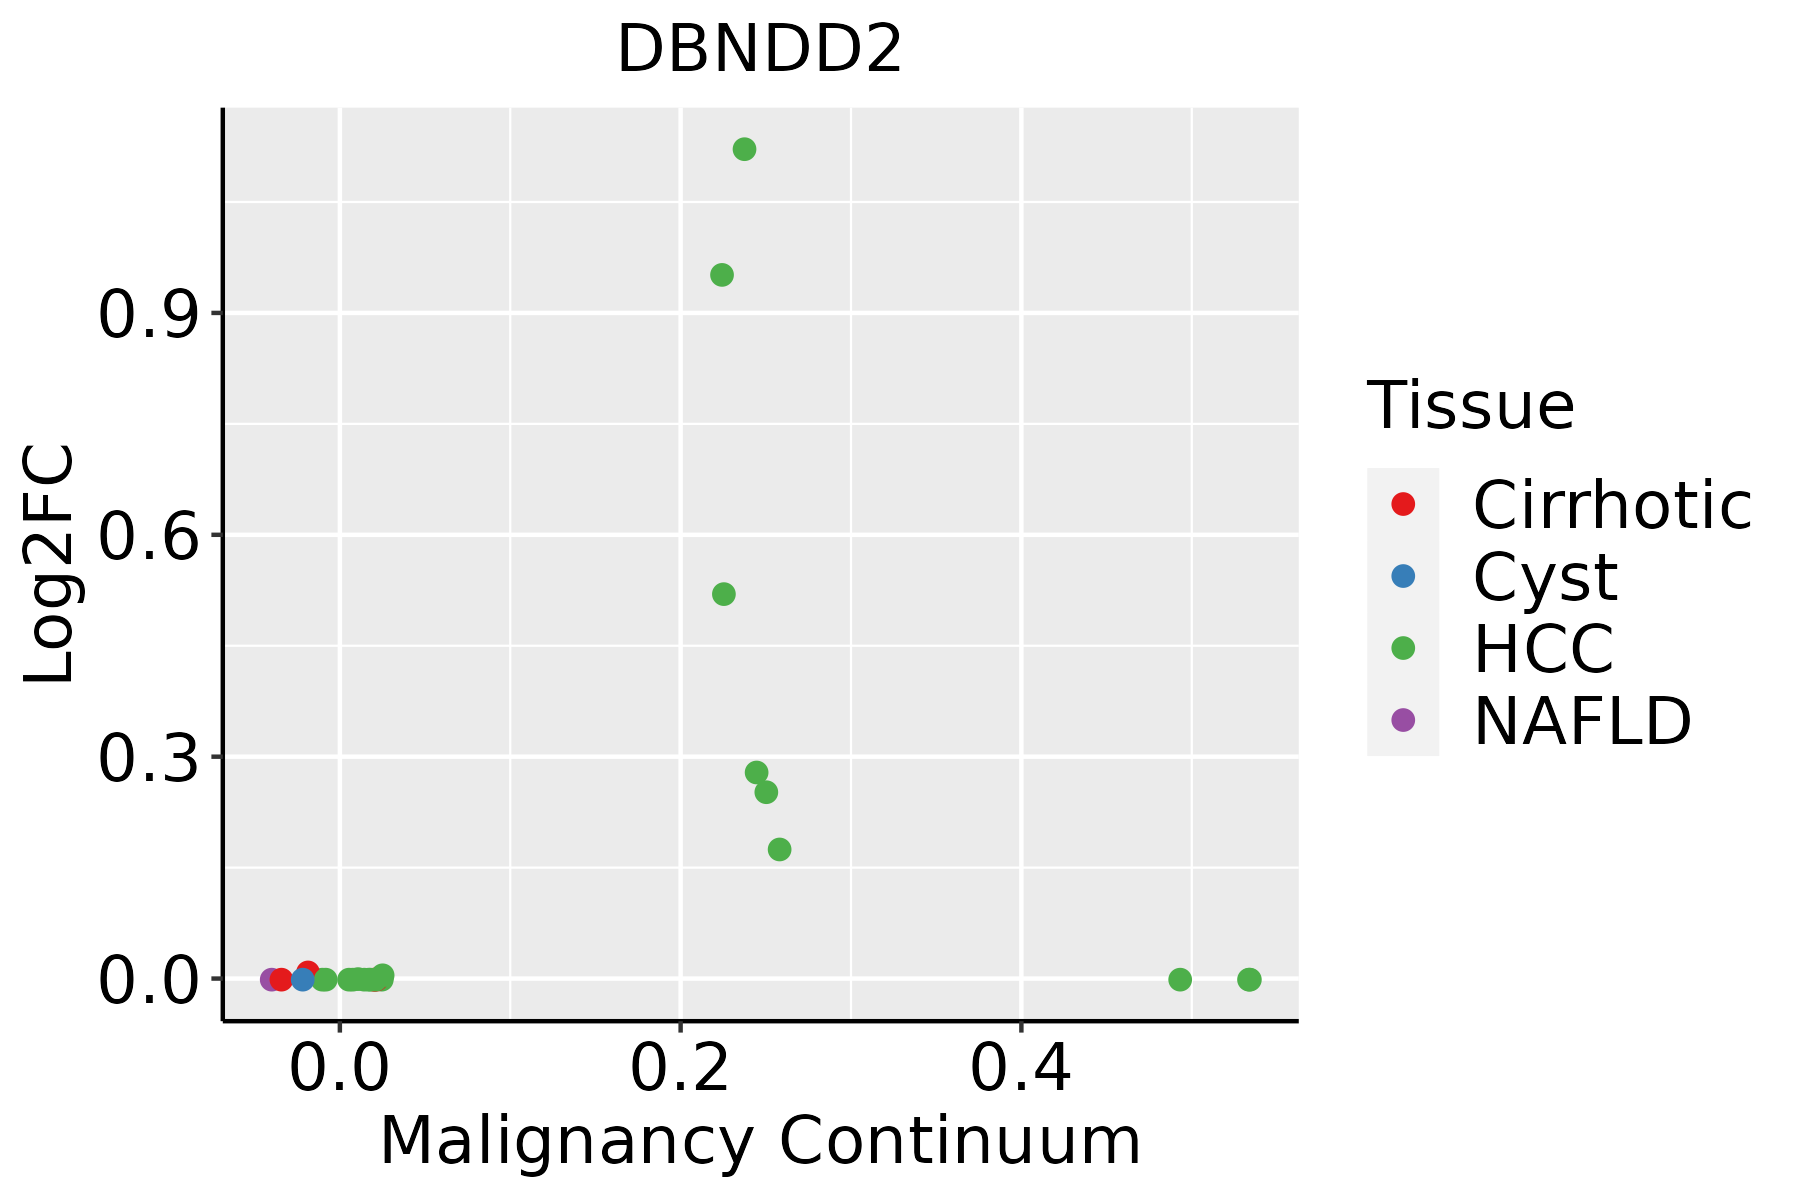 | HCC: Hepatocellular carcinoma |
| NAFLD: Non-alcoholic fatty liver disease |
| ∗log2FC in expression of this searched gene in stem-like cells from each diseased tissue sample relative to stem-like cells in normal samples in each tissue plotted against the malignancy continuum. Samples are colored based on if they are from different disease stage. |
Top |
Malignant transformation related pathway analysis |
| Find out the enriched GO biological processes and KEGG pathways involved in transition from healthy to precancer to cancer |
| Tissue | Disease Stage | Enriched GO biological Processes |
| Colorectum | AD |  |
| Colorectum | SER |  |
| Colorectum | MSS |  |
| Colorectum | MSI-H |  |
| Colorectum | FAP |  |
| ∗Top 15 enriched GO BP terms are showed in the bar plot of each disease state in each tissue. Each row represents a significant GO biological process which is colored according to the -log10(p.adjust). |
| Page: 1 2 3 4 5 6 7 8 9 |
| GO ID | Tissue | Disease Stage | Description | Gene Ratio | Bg Ratio | pvalue | p.adjust | Count |
| GO:0010563 | Colorectum | AD | negative regulation of phosphorus metabolic process | 130/3918 | 442/18723 | 1.26e-05 | 2.76e-04 | 130 |
| GO:0045936 | Colorectum | AD | negative regulation of phosphate metabolic process | 129/3918 | 441/18723 | 1.81e-05 | 3.76e-04 | 129 |
| GO:0051348 | Colorectum | AD | negative regulation of transferase activity | 85/3918 | 268/18723 | 2.07e-05 | 4.19e-04 | 85 |
| GO:0042326 | Colorectum | AD | negative regulation of phosphorylation | 112/3918 | 385/18723 | 8.02e-05 | 1.27e-03 | 112 |
| GO:0001933 | Colorectum | AD | negative regulation of protein phosphorylation | 101/3918 | 342/18723 | 9.39e-05 | 1.42e-03 | 101 |
| GO:0006469 | Colorectum | AD | negative regulation of protein kinase activity | 65/3918 | 212/18723 | 5.21e-04 | 5.62e-03 | 65 |
| GO:0033673 | Colorectum | AD | negative regulation of kinase activity | 71/3918 | 237/18723 | 6.18e-04 | 6.47e-03 | 71 |
| GO:00513481 | Colorectum | SER | negative regulation of transferase activity | 70/2897 | 268/18723 | 4.27e-06 | 1.62e-04 | 70 |
| GO:00105631 | Colorectum | SER | negative regulation of phosphorus metabolic process | 101/2897 | 442/18723 | 2.39e-05 | 6.70e-04 | 101 |
| GO:00459361 | Colorectum | SER | negative regulation of phosphate metabolic process | 100/2897 | 441/18723 | 3.62e-05 | 9.39e-04 | 100 |
| GO:00019331 | Colorectum | SER | negative regulation of protein phosphorylation | 79/2897 | 342/18723 | 1.21e-04 | 2.49e-03 | 79 |
| GO:00423261 | Colorectum | SER | negative regulation of phosphorylation | 86/2897 | 385/18723 | 2.10e-04 | 3.78e-03 | 86 |
| GO:00336731 | Colorectum | SER | negative regulation of kinase activity | 57/2897 | 237/18723 | 3.48e-04 | 5.46e-03 | 57 |
| GO:00064691 | Colorectum | SER | negative regulation of protein kinase activity | 52/2897 | 212/18723 | 3.75e-04 | 5.74e-03 | 52 |
| GO:00513482 | Colorectum | MSS | negative regulation of transferase activity | 80/3467 | 268/18723 | 4.06e-06 | 1.17e-04 | 80 |
| GO:00105632 | Colorectum | MSS | negative regulation of phosphorus metabolic process | 118/3467 | 442/18723 | 1.18e-05 | 2.77e-04 | 118 |
| GO:00459362 | Colorectum | MSS | negative regulation of phosphate metabolic process | 117/3467 | 441/18723 | 1.74e-05 | 3.84e-04 | 117 |
| GO:00423262 | Colorectum | MSS | negative regulation of phosphorylation | 103/3467 | 385/18723 | 3.76e-05 | 7.17e-04 | 103 |
| GO:00019332 | Colorectum | MSS | negative regulation of protein phosphorylation | 93/3467 | 342/18723 | 4.54e-05 | 8.35e-04 | 93 |
| GO:00336732 | Colorectum | MSS | negative regulation of kinase activity | 66/3467 | 237/18723 | 2.63e-04 | 3.54e-03 | 66 |
| Page: 1 2 3 |
| Pathway ID | Tissue | Disease Stage | Description | Gene Ratio | Bg Ratio | pvalue | p.adjust | qvalue | Count |
| Page: 1 |
Top |
Cell-cell communication analysis |
| Identification of potential cell-cell interactions between two cell types and their ligand-receptor pairs for different disease states |
| Ligand | Receptor | LRpair | Pathway | Tissue | Disease Stage |
| Page: 1 |
Top |
Single-cell gene regulatory network inference analysis |
| Find out the significant the regulons (TFs) and the target genes of each regulon across cell types for different disease states |
| TF | Cell Type | Tissue | Disease Stage | Target Gene | RSS | Regulon Activity |
| ∗The dot plots of a searched regulon are shown for all cell subpopulations in each disease state of each tissue based on the regulon specific score inferred using pySCENIC and by calculating the average expression. |
| Page: 1 |
Top |
Somatic mutation of malignant transformation related genes |
| Annotation of somatic variants for genes involved in malignant transformation |
| Hugo Symbol | Variant Class | Variant Classification | dbSNP RS | HGVSc | HGVSp | HGVSp Short | SWISSPROT | BIOTYPE | SIFT | PolyPhen | Tumor Sample Barcode | Tissue | Histology | Sex | Age | Stage | Therapy Types | Drugs | Outcome |
| DBNDD2 | SNV | Missense_Mutation | novel | c.209N>T | p.Cys70Phe | p.C70F | Q9BQY9 | protein_coding | deleterious_low_confidence(0) | benign(0.014) | TCGA-E2-A2P5-01 | Breast | breast invasive carcinoma | Female | >=65 | III/IV | Hormone Therapy | arimidex | PD |
| DBNDD2 | deletion | Frame_Shift_Del | c.471delN | p.Glu158LysfsTer2 | p.E158Kfs*2 | Q9BQY9 | protein_coding | TCGA-EW-A1IW-01 | Breast | breast invasive carcinoma | Female | >=65 | I/II | Hormone Therapy | aromasin | SD | |||
| DBNDD2 | SNV | Missense_Mutation | c.260G>A | p.Arg87Gln | p.R87Q | Q9BQY9 | protein_coding | tolerated_low_confidence(0.87) | benign(0) | TCGA-AA-A010-01 | Colorectum | colon adenocarcinoma | Female | <65 | I/II | Chemotherapy | folinic | CR | |
| DBNDD2 | SNV | Missense_Mutation | rs772958543 | c.445N>T | p.Pro149Ser | p.P149S | Q9BQY9 | protein_coding | deleterious(0.03) | probably_damaging(0.999) | TCGA-D5-6530-01 | Colorectum | colon adenocarcinoma | Male | <65 | I/II | Unknown | Unknown | SD |
| DBNDD2 | SNV | Missense_Mutation | c.478N>C | p.Asn160His | p.N160H | Q9BQY9 | protein_coding | deleterious(0) | probably_damaging(1) | TCGA-F4-6703-01 | Colorectum | colon adenocarcinoma | Male | <65 | I/II | Unknown | Unknown | SD | |
| DBNDD2 | SNV | Missense_Mutation | rs767159514 | c.226N>A | p.Ala76Thr | p.A76T | Q9BQY9 | protein_coding | tolerated_low_confidence(0.06) | benign(0) | TCGA-WS-AB45-01 | Colorectum | colon adenocarcinoma | Female | <65 | I/II | Unknown | Unknown | SD |
| DBNDD2 | SNV | Missense_Mutation | novel | c.328G>A | p.Ala110Thr | p.A110T | Q9BQY9 | protein_coding | tolerated_low_confidence(0.13) | benign(0) | TCGA-A5-A0G9-01 | Endometrium | uterine corpus endometrioid carcinoma | Female | >=65 | I/II | Unknown | Unknown | SD |
| DBNDD2 | SNV | Missense_Mutation | novel | c.515N>G | p.Leu172Arg | p.L172R | Q9BQY9 | protein_coding | deleterious(0) | probably_damaging(0.952) | TCGA-A5-A1OF-01 | Endometrium | uterine corpus endometrioid carcinoma | Female | <65 | I/II | Unknown | Unknown | SD |
| DBNDD2 | SNV | Missense_Mutation | novel | c.443N>T | p.Arg148Ile | p.R148I | Q9BQY9 | protein_coding | deleterious(0) | probably_damaging(0.994) | TCGA-AJ-A3EL-01 | Endometrium | uterine corpus endometrioid carcinoma | Female | <65 | I/II | Unknown | Unknown | SD |
| DBNDD2 | SNV | Missense_Mutation | novel | c.326N>T | p.Ala109Val | p.A109V | Q9BQY9 | protein_coding | deleterious_low_confidence(0) | benign(0.091) | TCGA-AP-A1DK-01 | Endometrium | uterine corpus endometrioid carcinoma | Female | <65 | I/II | Unknown | Unknown | SD |
| Page: 1 2 3 4 |
Top |
Related drugs of malignant transformation related genes |
| Identification of chemicals and drugs interact with genes involved in malignant transfromation |
| (DGIdb 4.0) |
| Entrez ID | Symbol | Category | Interaction Types | Drug Claim Name | Drug Name | PMIDs |
| Page: 1 |

Copyright 2023-Present -The University of Texas Health Science Center at Houston |