
|
|||||
|
 | |
| |
| |
| |
| |
| |
|
Gene: DBNDD1 |
Gene summary for DBNDD1 |
| Gene information | Species | Human | Gene symbol | DBNDD1 | Gene ID | 79007 |
| Gene name | dysbindin domain containing 1 | |
| Gene Alias | DBNDD1 | |
| Cytomap | 16q24.3 | |
| Gene Type | protein-coding | GO ID | GO:0001932 | UniProtAcc | Q9H9R9 |
Top |
Malignant transformation analysis |
| Identification of the aberrant gene expression in precancerous and cancerous lesions by comparing the gene expression of stem-like cells in diseased tissues with normal stem cells |
| Entrez ID | Symbol | Replicates | Species | Organ | Tissue | Adj P-value | Log2FC | Malignancy |
| 79007 | DBNDD1 | LZE24T | Human | Esophagus | ESCC | 9.77e-08 | 2.38e-01 | 0.0596 |
| 79007 | DBNDD1 | P2T-E | Human | Esophagus | ESCC | 6.36e-10 | 8.61e-02 | 0.1177 |
| 79007 | DBNDD1 | P5T-E | Human | Esophagus | ESCC | 4.38e-03 | 8.90e-02 | 0.1327 |
| 79007 | DBNDD1 | P10T-E | Human | Esophagus | ESCC | 2.11e-04 | 4.02e-02 | 0.116 |
| 79007 | DBNDD1 | P11T-E | Human | Esophagus | ESCC | 4.59e-07 | 6.37e-01 | 0.1426 |
| 79007 | DBNDD1 | P12T-E | Human | Esophagus | ESCC | 7.71e-12 | 2.08e-01 | 0.1122 |
| 79007 | DBNDD1 | P15T-E | Human | Esophagus | ESCC | 5.26e-05 | 1.83e-01 | 0.1149 |
| 79007 | DBNDD1 | P16T-E | Human | Esophagus | ESCC | 5.68e-10 | 1.52e-01 | 0.1153 |
| 79007 | DBNDD1 | P21T-E | Human | Esophagus | ESCC | 1.75e-11 | 2.98e-01 | 0.1617 |
| 79007 | DBNDD1 | P23T-E | Human | Esophagus | ESCC | 1.02e-09 | 2.14e-01 | 0.108 |
| 79007 | DBNDD1 | P24T-E | Human | Esophagus | ESCC | 3.92e-10 | 3.35e-01 | 0.1287 |
| 79007 | DBNDD1 | P26T-E | Human | Esophagus | ESCC | 5.09e-07 | 1.07e-01 | 0.1276 |
| 79007 | DBNDD1 | P27T-E | Human | Esophagus | ESCC | 2.28e-04 | 1.88e-01 | 0.1055 |
| 79007 | DBNDD1 | P28T-E | Human | Esophagus | ESCC | 1.72e-14 | 3.57e-01 | 0.1149 |
| 79007 | DBNDD1 | P32T-E | Human | Esophagus | ESCC | 9.08e-07 | 4.96e-01 | 0.1666 |
| 79007 | DBNDD1 | P38T-E | Human | Esophagus | ESCC | 1.23e-05 | 2.62e-01 | 0.127 |
| 79007 | DBNDD1 | P39T-E | Human | Esophagus | ESCC | 7.43e-06 | 1.40e-01 | 0.0894 |
| 79007 | DBNDD1 | P48T-E | Human | Esophagus | ESCC | 6.99e-04 | 9.27e-02 | 0.0959 |
| 79007 | DBNDD1 | P49T-E | Human | Esophagus | ESCC | 2.62e-05 | 5.31e-01 | 0.1768 |
| 79007 | DBNDD1 | P52T-E | Human | Esophagus | ESCC | 3.57e-08 | 1.82e-01 | 0.1555 |
| Page: 1 2 3 |
| Tissue | Expression Dynamics | Abbreviation |
| Esophagus |  | ESCC: Esophageal squamous cell carcinoma |
| HGIN: High-grade intraepithelial neoplasias | ||
| LGIN: Low-grade intraepithelial neoplasias | ||
| Liver | 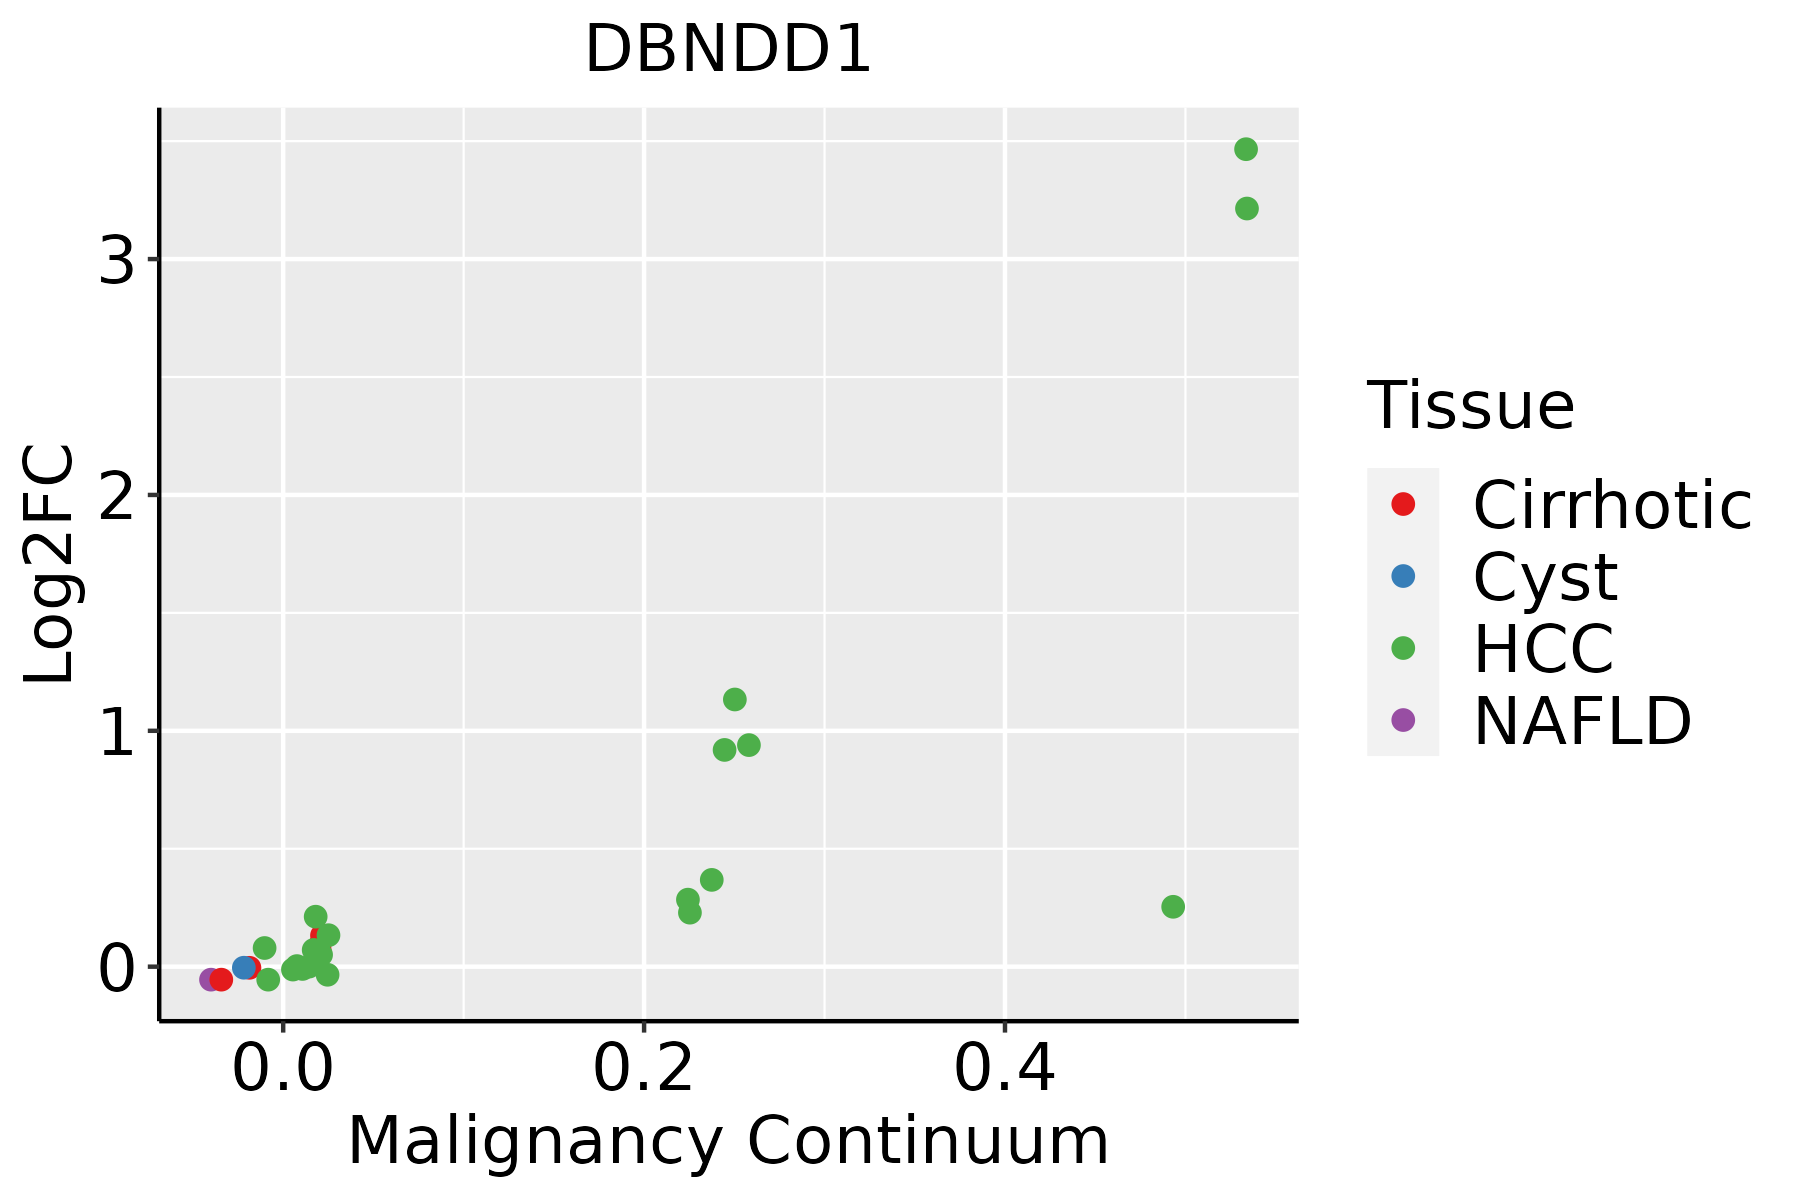 | HCC: Hepatocellular carcinoma |
| NAFLD: Non-alcoholic fatty liver disease |
| ∗log2FC in expression of this searched gene in stem-like cells from each diseased tissue sample relative to stem-like cells in normal samples in each tissue plotted against the malignancy continuum. Samples are colored based on if they are from different disease stage. |
Top |
Malignant transformation related pathway analysis |
| Find out the enriched GO biological processes and KEGG pathways involved in transition from healthy to precancer to cancer |
| Tissue | Disease Stage | Enriched GO biological Processes |
| Colorectum | AD |  |
| Colorectum | SER |  |
| Colorectum | MSS |  |
| Colorectum | MSI-H |  |
| Colorectum | FAP |  |
| ∗Top 15 enriched GO BP terms are showed in the bar plot of each disease state in each tissue. Each row represents a significant GO biological process which is colored according to the -log10(p.adjust). |
| Page: 1 2 3 4 5 6 7 8 9 |
| GO ID | Tissue | Disease Stage | Description | Gene Ratio | Bg Ratio | pvalue | p.adjust | Count |
| GO:0010563111 | Esophagus | ESCC | negative regulation of phosphorus metabolic process | 274/8552 | 442/18723 | 2.32e-12 | 9.41e-11 | 274 |
| GO:0045936111 | Esophagus | ESCC | negative regulation of phosphate metabolic process | 273/8552 | 441/18723 | 3.18e-12 | 1.25e-10 | 273 |
| GO:0051348111 | Esophagus | ESCC | negative regulation of transferase activity | 177/8552 | 268/18723 | 1.08e-11 | 4.00e-10 | 177 |
| GO:0042326111 | Esophagus | ESCC | negative regulation of phosphorylation | 237/8552 | 385/18723 | 1.86e-10 | 5.33e-09 | 237 |
| GO:0001933111 | Esophagus | ESCC | negative regulation of protein phosphorylation | 213/8552 | 342/18723 | 3.54e-10 | 9.76e-09 | 213 |
| GO:003367319 | Esophagus | ESCC | negative regulation of kinase activity | 154/8552 | 237/18723 | 1.38e-09 | 3.27e-08 | 154 |
| GO:000646920 | Esophagus | ESCC | negative regulation of protein kinase activity | 140/8552 | 212/18723 | 1.53e-09 | 3.56e-08 | 140 |
| GO:001056322 | Liver | HCC | negative regulation of phosphorus metabolic process | 259/7958 | 442/18723 | 4.29e-12 | 1.92e-10 | 259 |
| GO:004593622 | Liver | HCC | negative regulation of phosphate metabolic process | 258/7958 | 441/18723 | 6.00e-12 | 2.60e-10 | 258 |
| GO:004232622 | Liver | HCC | negative regulation of phosphorylation | 227/7958 | 385/18723 | 3.98e-11 | 1.52e-09 | 227 |
| GO:005134822 | Liver | HCC | negative regulation of transferase activity | 166/7958 | 268/18723 | 8.97e-11 | 3.18e-09 | 166 |
| GO:003367322 | Liver | HCC | negative regulation of kinase activity | 144/7958 | 237/18723 | 9.76e-09 | 2.45e-07 | 144 |
| GO:000193322 | Liver | HCC | negative regulation of protein phosphorylation | 196/7958 | 342/18723 | 1.95e-08 | 4.63e-07 | 196 |
| GO:000646912 | Liver | HCC | negative regulation of protein kinase activity | 126/7958 | 212/18723 | 4.55e-07 | 7.49e-06 | 126 |
| Page: 1 |
| Pathway ID | Tissue | Disease Stage | Description | Gene Ratio | Bg Ratio | pvalue | p.adjust | qvalue | Count |
| Page: 1 |
Top |
Cell-cell communication analysis |
| Identification of potential cell-cell interactions between two cell types and their ligand-receptor pairs for different disease states |
| Ligand | Receptor | LRpair | Pathway | Tissue | Disease Stage |
| Page: 1 |
Top |
Single-cell gene regulatory network inference analysis |
| Find out the significant the regulons (TFs) and the target genes of each regulon across cell types for different disease states |
| TF | Cell Type | Tissue | Disease Stage | Target Gene | RSS | Regulon Activity |
| ∗The dot plots of a searched regulon are shown for all cell subpopulations in each disease state of each tissue based on the regulon specific score inferred using pySCENIC and by calculating the average expression. |
| Page: 1 |
Top |
Somatic mutation of malignant transformation related genes |
| Annotation of somatic variants for genes involved in malignant transformation |
| Hugo Symbol | Variant Class | Variant Classification | dbSNP RS | HGVSc | HGVSp | HGVSp Short | SWISSPROT | BIOTYPE | SIFT | PolyPhen | Tumor Sample Barcode | Tissue | Histology | Sex | Age | Stage | Therapy Types | Drugs | Outcome |
| DBNDD1 | SNV | Missense_Mutation | c.595G>A | p.Glu199Lys | p.E199K | Q9H9R9 | protein_coding | deleterious_low_confidence(0) | probably_damaging(0.997) | TCGA-IR-A3LH-01 | Cervix | cervical & endocervical cancer | Female | <65 | I/II | Chemotherapy | cisplatin | CR | |
| DBNDD1 | SNV | Missense_Mutation | c.793N>C | p.Val265Leu | p.V265L | Q9H9R9 | protein_coding | tolerated_low_confidence(0.05) | benign(0) | TCGA-AY-5543-01 | Colorectum | colon adenocarcinoma | Female | >=65 | I/II | Chemotherapy | oxaliplatin | SD | |
| DBNDD1 | SNV | Missense_Mutation | rs777014752 | c.689N>T | p.Pro230Leu | p.P230L | Q9H9R9 | protein_coding | deleterious_low_confidence(0) | benign(0.127) | TCGA-D5-6928-01 | Colorectum | colon adenocarcinoma | Male | >=65 | I/II | Unknown | Unknown | SD |
| DBNDD1 | SNV | Missense_Mutation | rs377278023 | c.433N>A | p.Val145Ile | p.V145I | Q9H9R9 | protein_coding | tolerated_low_confidence(0.15) | benign(0.09) | TCGA-F4-6856-01 | Colorectum | colon adenocarcinoma | Male | <65 | I/II | Ancillary | leucovorin | CR |
| DBNDD1 | SNV | Missense_Mutation | c.415N>T | p.Pro139Ser | p.P139S | Q9H9R9 | protein_coding | deleterious_low_confidence(0.02) | possibly_damaging(0.577) | TCGA-AG-A02N-01 | Colorectum | rectum adenocarcinoma | Male | >=65 | I/II | Chemotherapy | folinic | CR | |
| DBNDD1 | SNV | Missense_Mutation | rs201427311 | c.416N>T | p.Pro139Leu | p.P139L | Q9H9R9 | protein_coding | tolerated_low_confidence(0.12) | benign(0.037) | TCGA-A5-A0G1-01 | Endometrium | uterine corpus endometrioid carcinoma | Female | >=65 | I/II | Unknown | Unknown | SD |
| DBNDD1 | SNV | Missense_Mutation | novel | c.812N>A | p.Thr271Asn | p.T271N | Q9H9R9 | protein_coding | deleterious_low_confidence(0.01) | benign(0.439) | TCGA-A5-A0G2-01 | Endometrium | uterine corpus endometrioid carcinoma | Female | <65 | III/IV | Unknown | Unknown | SD |
| DBNDD1 | SNV | Missense_Mutation | novel | c.407C>T | p.Ala136Val | p.A136V | Q9H9R9 | protein_coding | tolerated_low_confidence(0.45) | benign(0.019) | TCGA-AJ-A3BG-01 | Endometrium | uterine corpus endometrioid carcinoma | Female | >=65 | I/II | Chemotherapy | carboplatin | PD |
| DBNDD1 | SNV | Missense_Mutation | novel | c.565G>A | p.Glu189Lys | p.E189K | Q9H9R9 | protein_coding | deleterious_low_confidence(0) | probably_damaging(0.997) | TCGA-AP-A1DK-01 | Endometrium | uterine corpus endometrioid carcinoma | Female | <65 | I/II | Unknown | Unknown | SD |
| DBNDD1 | SNV | Missense_Mutation | rs773336637 | c.781N>T | p.Arg261Trp | p.R261W | Q9H9R9 | protein_coding | deleterious_low_confidence(0) | possibly_damaging(0.83) | TCGA-B5-A11E-01 | Endometrium | uterine corpus endometrioid carcinoma | Female | <65 | I/II | Unknown | Unknown | SD |
| Page: 1 2 |
Top |
Related drugs of malignant transformation related genes |
| Identification of chemicals and drugs interact with genes involved in malignant transfromation |
| (DGIdb 4.0) |
| Entrez ID | Symbol | Category | Interaction Types | Drug Claim Name | Drug Name | PMIDs |
| Page: 1 |

Copyright 2023-Present -The University of Texas Health Science Center at Houston |