
|
|||||
|
 | |
| |
| |
| |
| |
| |
|
Gene: DBI |
Gene summary for DBI |
| Gene information | Species | Human | Gene symbol | DBI | Gene ID | 1622 |
| Gene name | diazepam binding inhibitor, acyl-CoA binding protein | |
| Gene Alias | ACBD1 | |
| Cytomap | 2q14.2 | |
| Gene Type | protein-coding | GO ID | GO:0006464 | UniProtAcc | P07108 |
Top |
Malignant transformation analysis |
| Identification of the aberrant gene expression in precancerous and cancerous lesions by comparing the gene expression of stem-like cells in diseased tissues with normal stem cells |
| Entrez ID | Symbol | Replicates | Species | Organ | Tissue | Adj P-value | Log2FC | Malignancy |
| 1622 | DBI | GSM4909280 | Human | Breast | Precancer | 2.97e-02 | -4.93e-01 | 0.0305 |
| 1622 | DBI | GSM4909281 | Human | Breast | IDC | 8.72e-59 | 6.96e-01 | 0.21 |
| 1622 | DBI | GSM4909282 | Human | Breast | IDC | 9.83e-08 | 2.92e-01 | -0.0288 |
| 1622 | DBI | GSM4909285 | Human | Breast | IDC | 7.09e-29 | 5.10e-01 | 0.21 |
| 1622 | DBI | GSM4909286 | Human | Breast | IDC | 6.42e-04 | 2.85e-01 | 0.1081 |
| 1622 | DBI | GSM4909290 | Human | Breast | IDC | 2.88e-40 | 6.82e-01 | 0.2096 |
| 1622 | DBI | GSM4909294 | Human | Breast | IDC | 6.05e-58 | 5.57e-01 | 0.2022 |
| 1622 | DBI | GSM4909296 | Human | Breast | IDC | 1.87e-24 | 2.72e-01 | 0.1524 |
| 1622 | DBI | GSM4909297 | Human | Breast | IDC | 6.98e-36 | -5.12e-01 | 0.1517 |
| 1622 | DBI | GSM4909301 | Human | Breast | IDC | 4.42e-02 | 1.61e-01 | 0.1577 |
| 1622 | DBI | GSM4909302 | Human | Breast | IDC | 2.64e-02 | -2.79e-01 | 0.1545 |
| 1622 | DBI | GSM4909304 | Human | Breast | IDC | 1.51e-19 | 4.43e-01 | 0.1636 |
| 1622 | DBI | GSM4909308 | Human | Breast | IDC | 1.52e-03 | 7.80e-02 | 0.158 |
| 1622 | DBI | GSM4909309 | Human | Breast | IDC | 3.19e-06 | -3.57e-01 | 0.0483 |
| 1622 | DBI | GSM4909311 | Human | Breast | IDC | 8.73e-49 | -4.94e-01 | 0.1534 |
| 1622 | DBI | GSM4909312 | Human | Breast | IDC | 8.54e-08 | -7.66e-02 | 0.1552 |
| 1622 | DBI | GSM4909315 | Human | Breast | IDC | 3.06e-40 | 6.46e-01 | 0.21 |
| 1622 | DBI | GSM4909316 | Human | Breast | IDC | 1.42e-37 | 8.43e-01 | 0.21 |
| 1622 | DBI | GSM4909317 | Human | Breast | IDC | 1.98e-03 | -2.32e-01 | 0.1355 |
| 1622 | DBI | GSM4909319 | Human | Breast | IDC | 2.32e-68 | -7.72e-01 | 0.1563 |
| Page: 1 2 3 4 5 6 7 8 9 10 11 12 13 14 15 16 17 |
| Tissue | Expression Dynamics | Abbreviation |
| Breast | 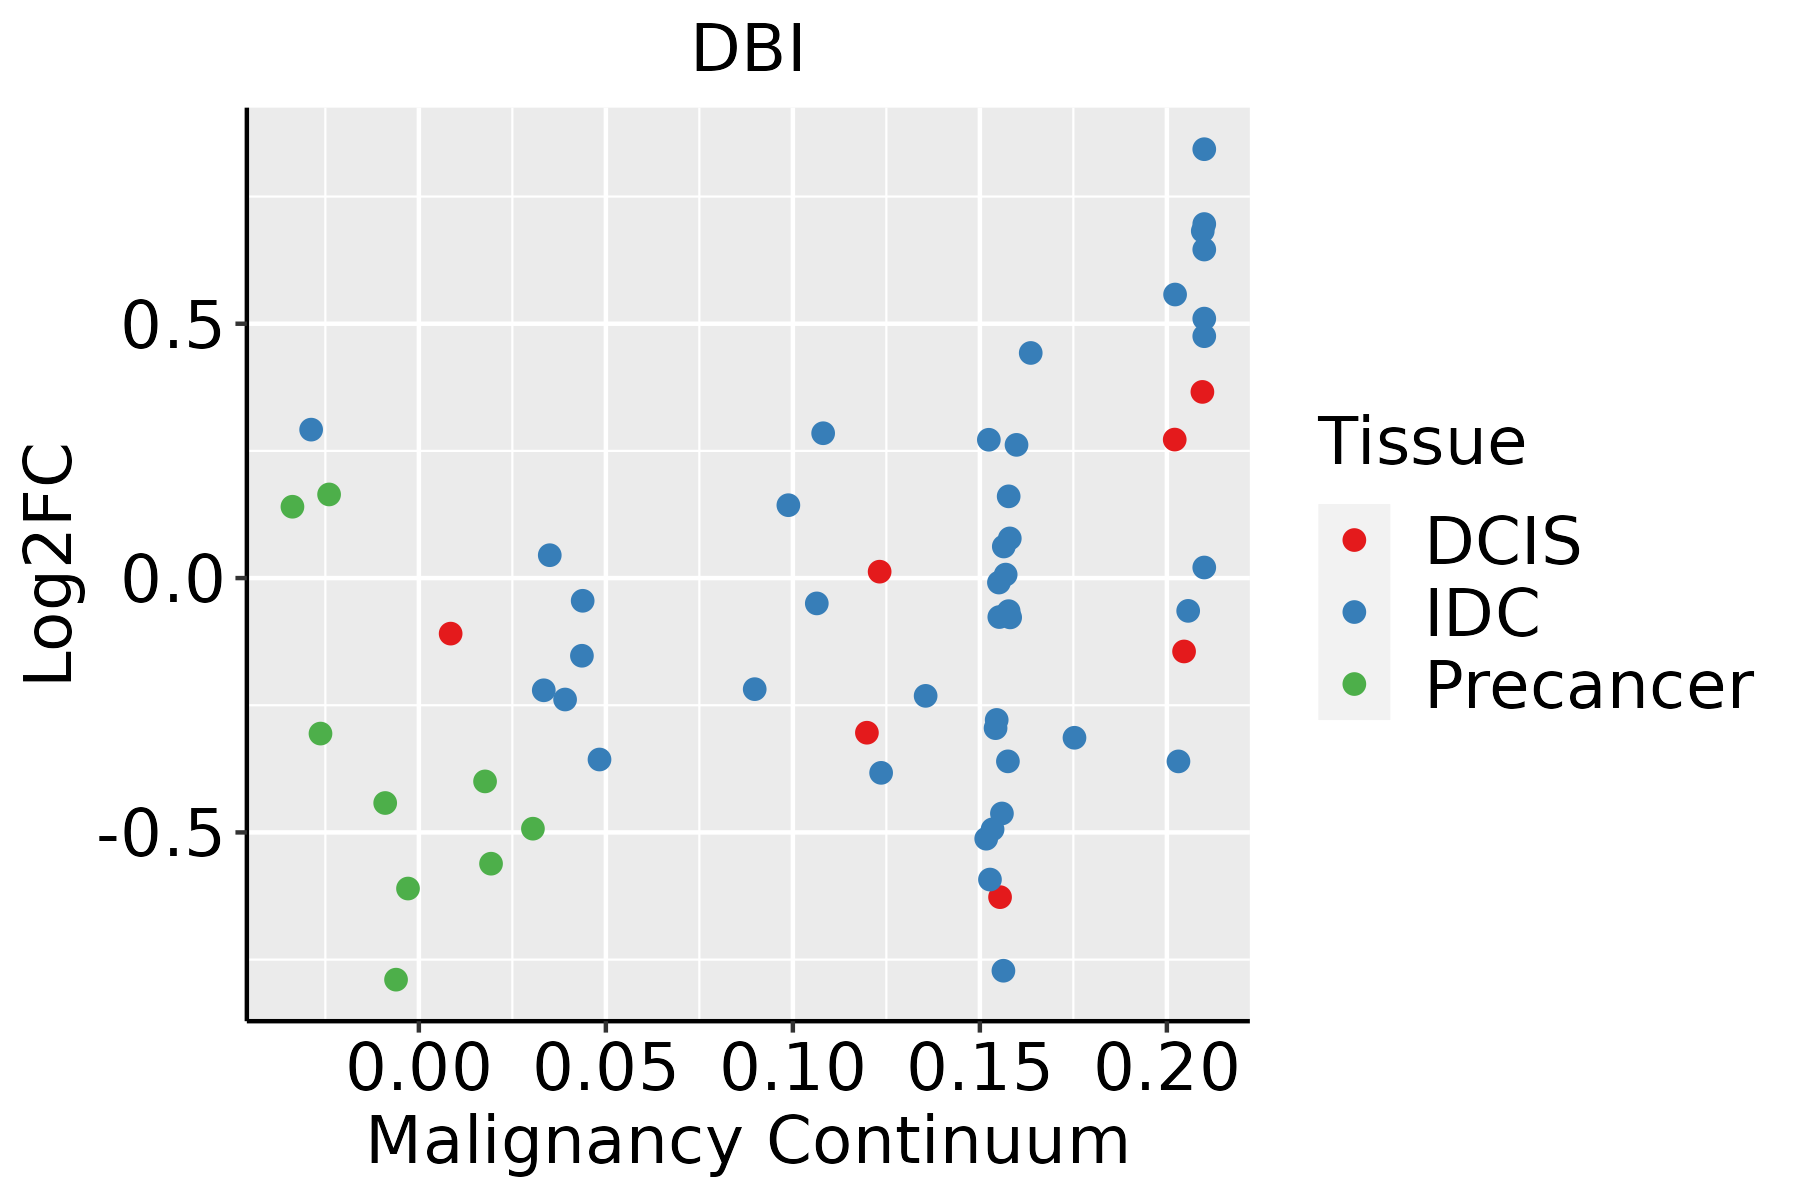 | IDC: Invasive ductal carcinoma |
| DCIS: Ductal carcinoma in situ | ||
| Precancer(BRCA1-mut): Precancerous lesion from BRCA1 mutation carriers | ||
| Cervix | 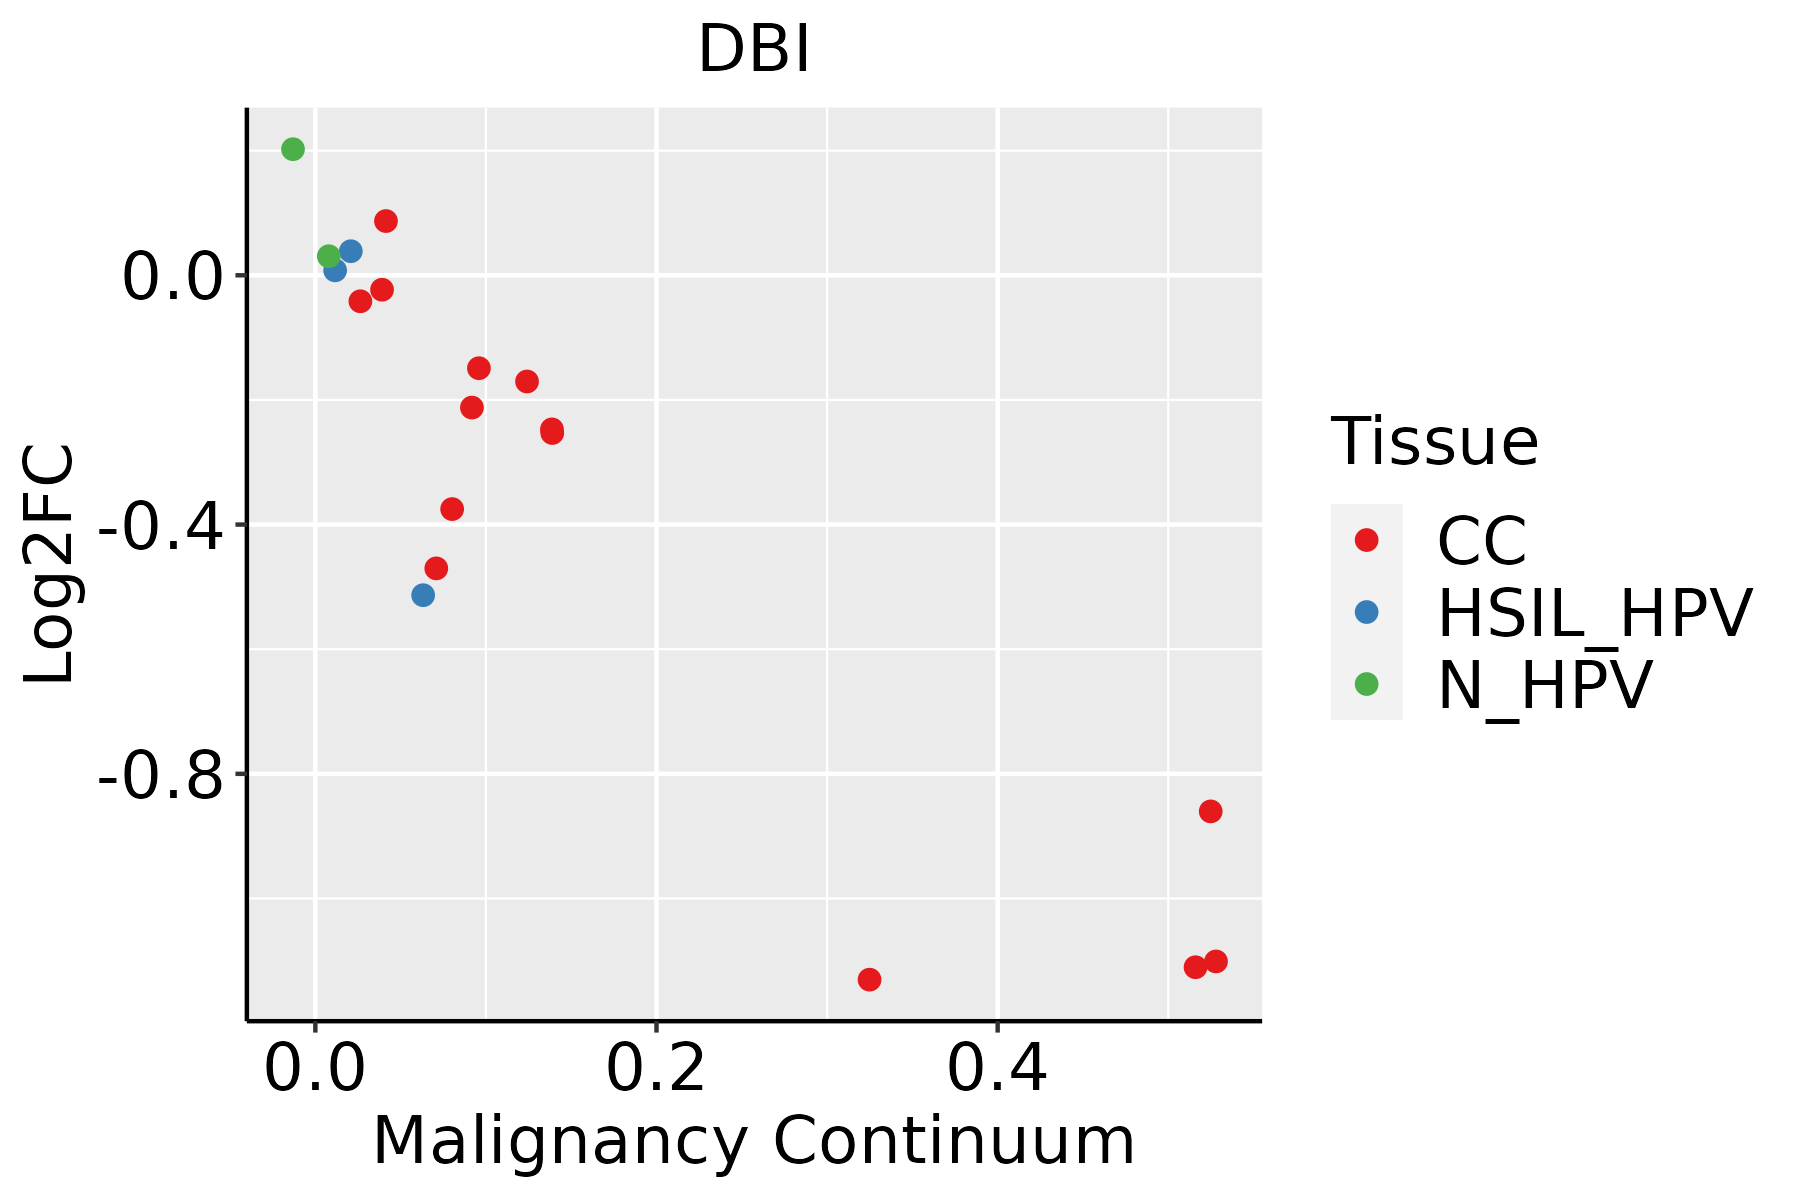 | CC: Cervix cancer |
| HSIL_HPV: HPV-infected high-grade squamous intraepithelial lesions | ||
| N_HPV: HPV-infected normal cervix | ||
| Colorectum (GSE201348) |  | FAP: Familial adenomatous polyposis |
| CRC: Colorectal cancer | ||
| Colorectum (HTA11) |  | AD: Adenomas |
| SER: Sessile serrated lesions | ||
| MSI-H: Microsatellite-high colorectal cancer | ||
| MSS: Microsatellite stable colorectal cancer | ||
| Endometrium | 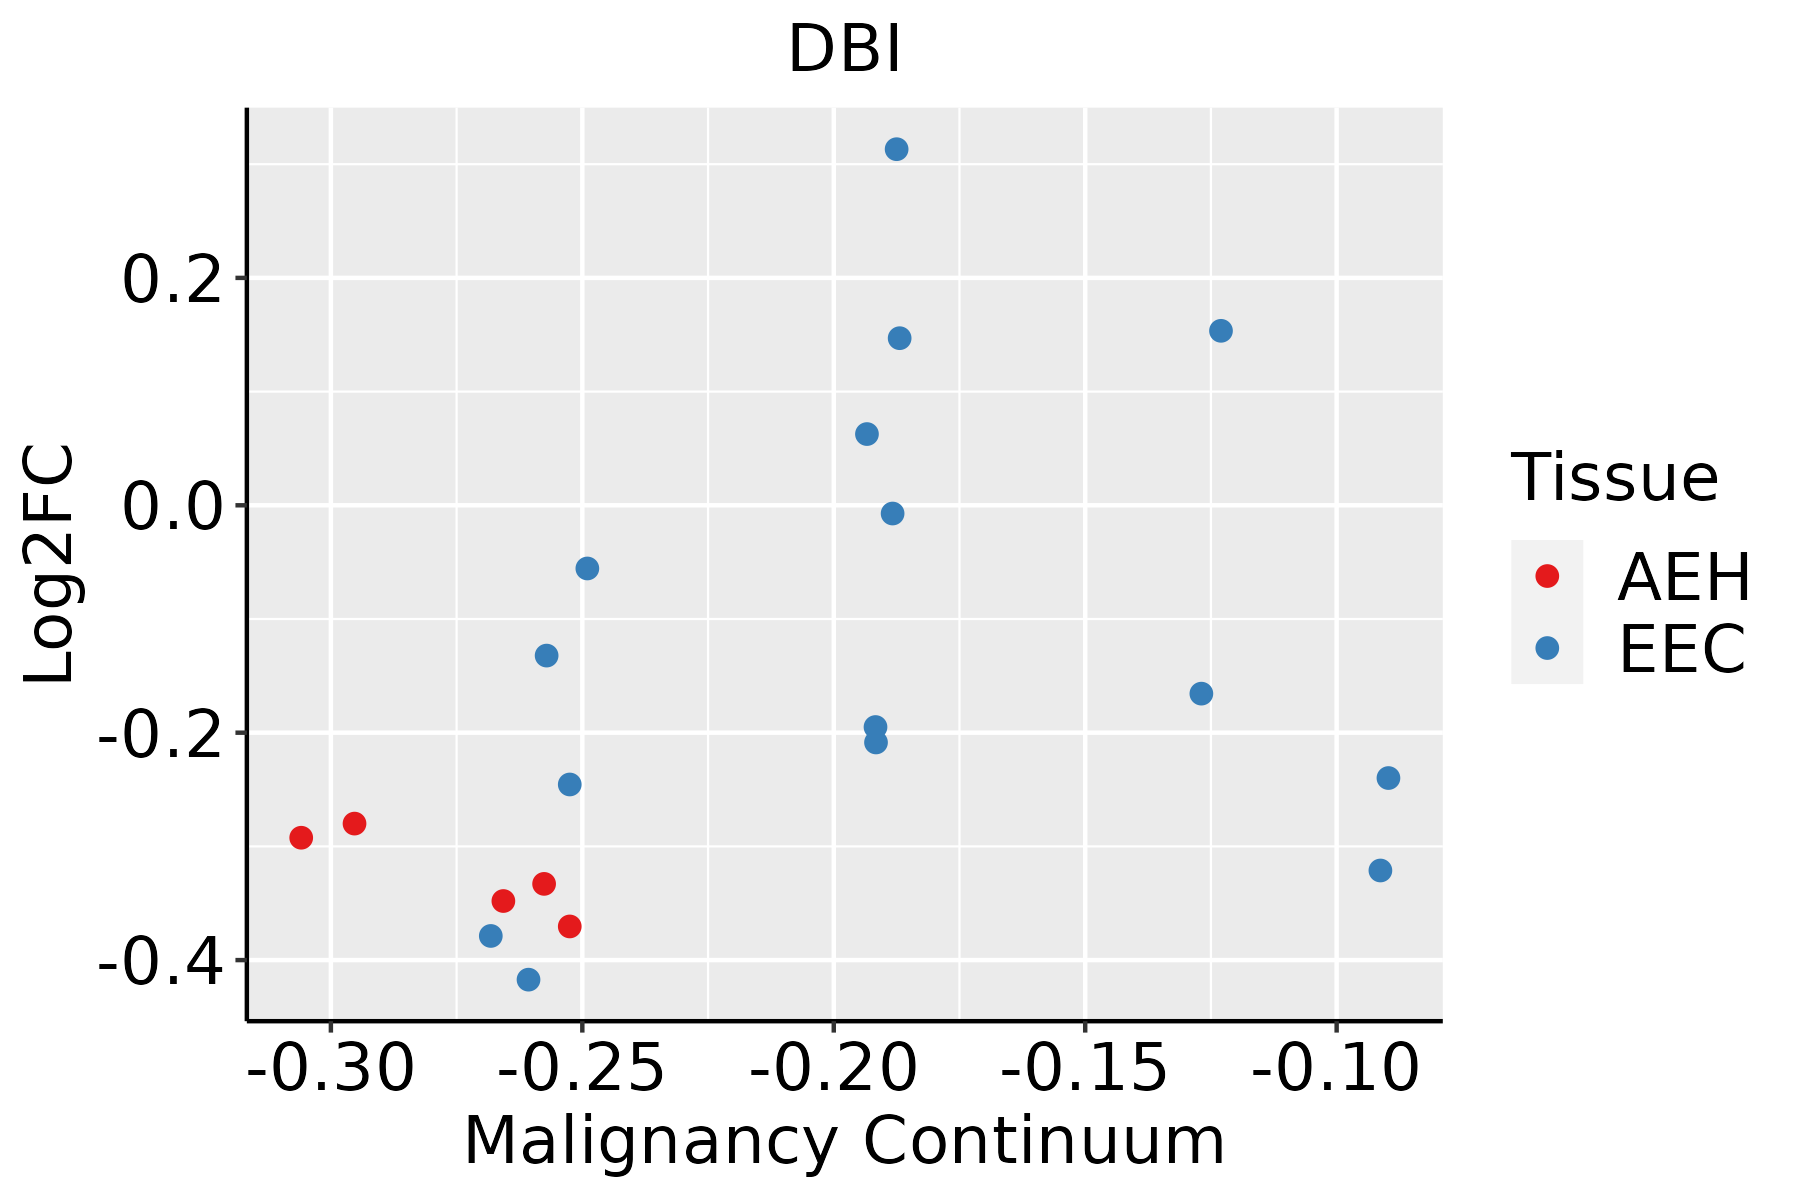 | AEH: Atypical endometrial hyperplasia |
| EEC: Endometrioid Cancer | ||
| Esophagus | 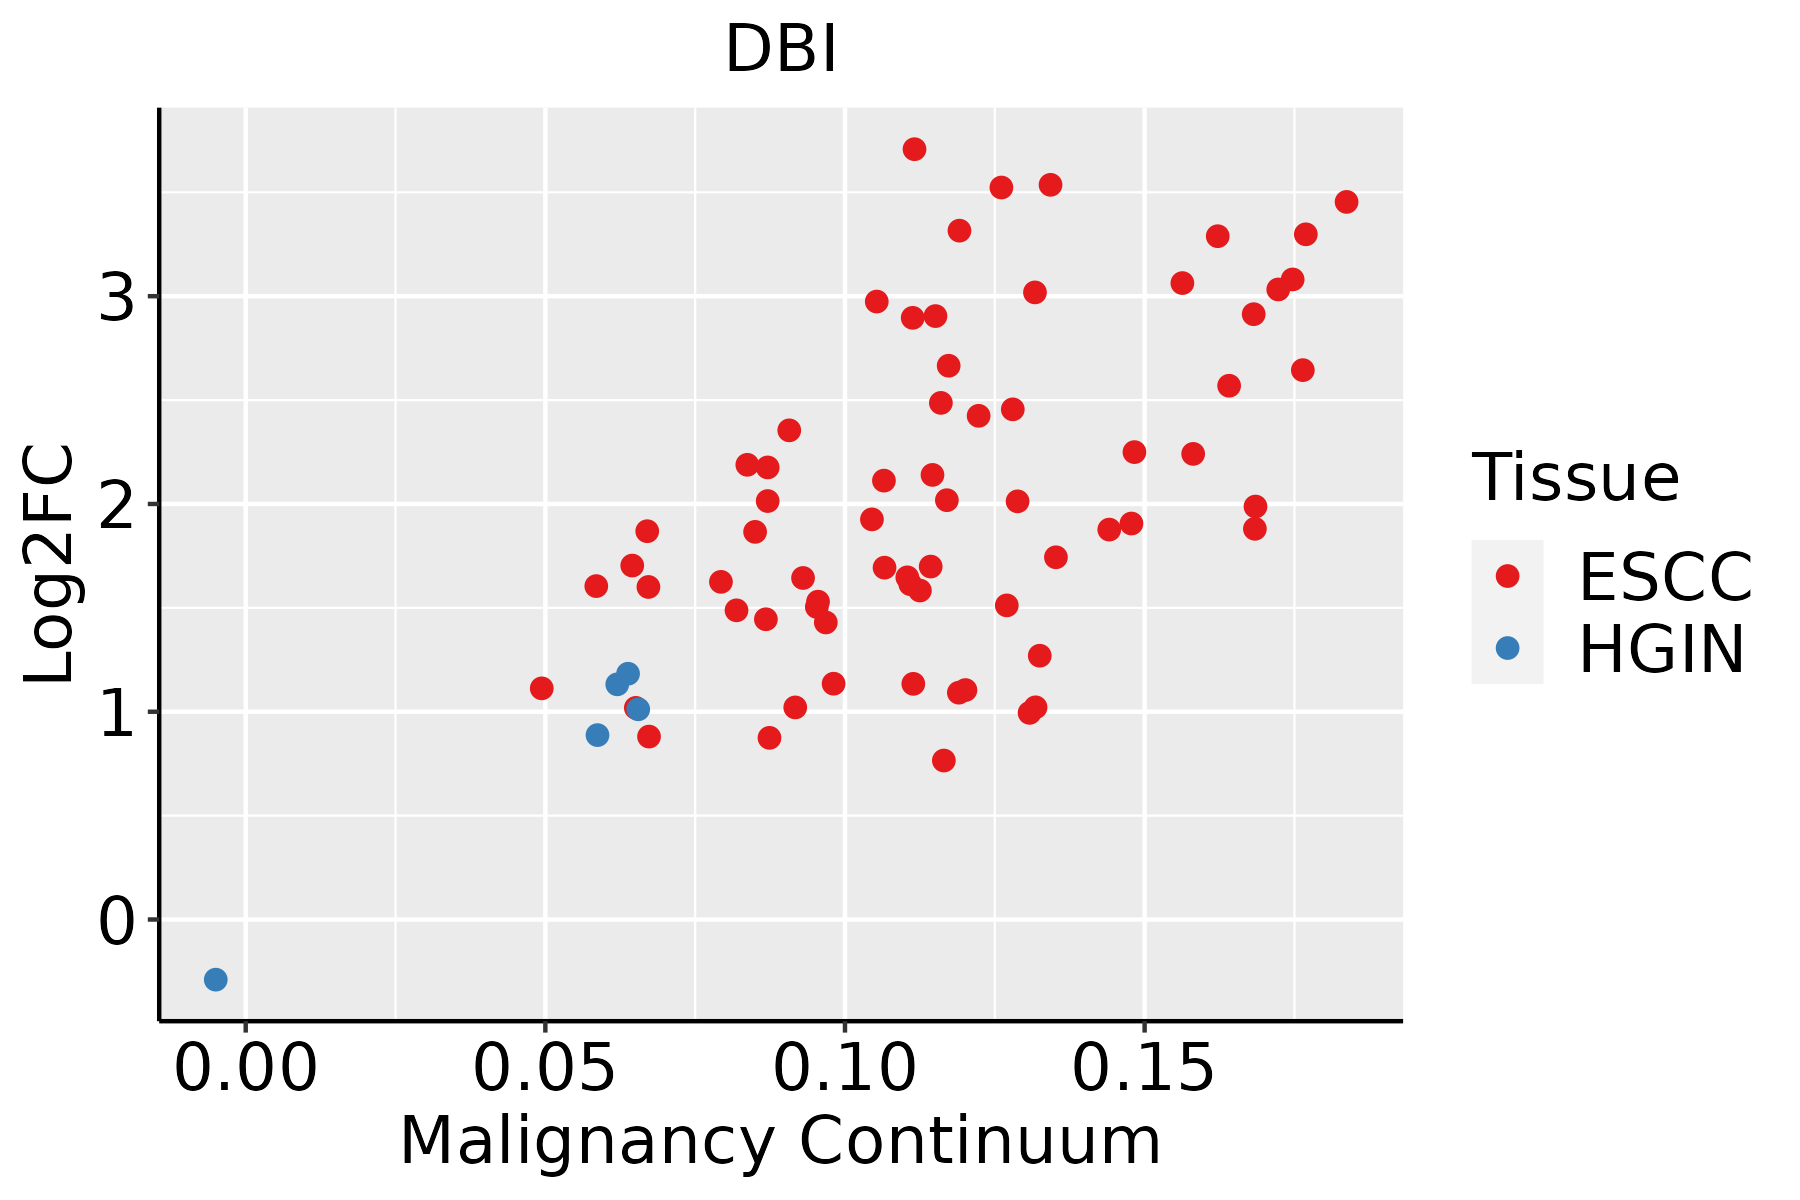 | ESCC: Esophageal squamous cell carcinoma |
| HGIN: High-grade intraepithelial neoplasias | ||
| LGIN: Low-grade intraepithelial neoplasias | ||
| GC |  | CAG: Chronic atrophic gastritis |
| CAG with IM: Chronic atrophic gastritis with intestinal metaplasia | ||
| CSG: Chronic superficial gastritis | ||
| GC: Gastric cancer | ||
| SIM: Severe intestinal metaplasia | ||
| WIM: Wild intestinal metaplasia | ||
| Liver |  | HCC: Hepatocellular carcinoma |
| NAFLD: Non-alcoholic fatty liver disease | ||
| Lung | 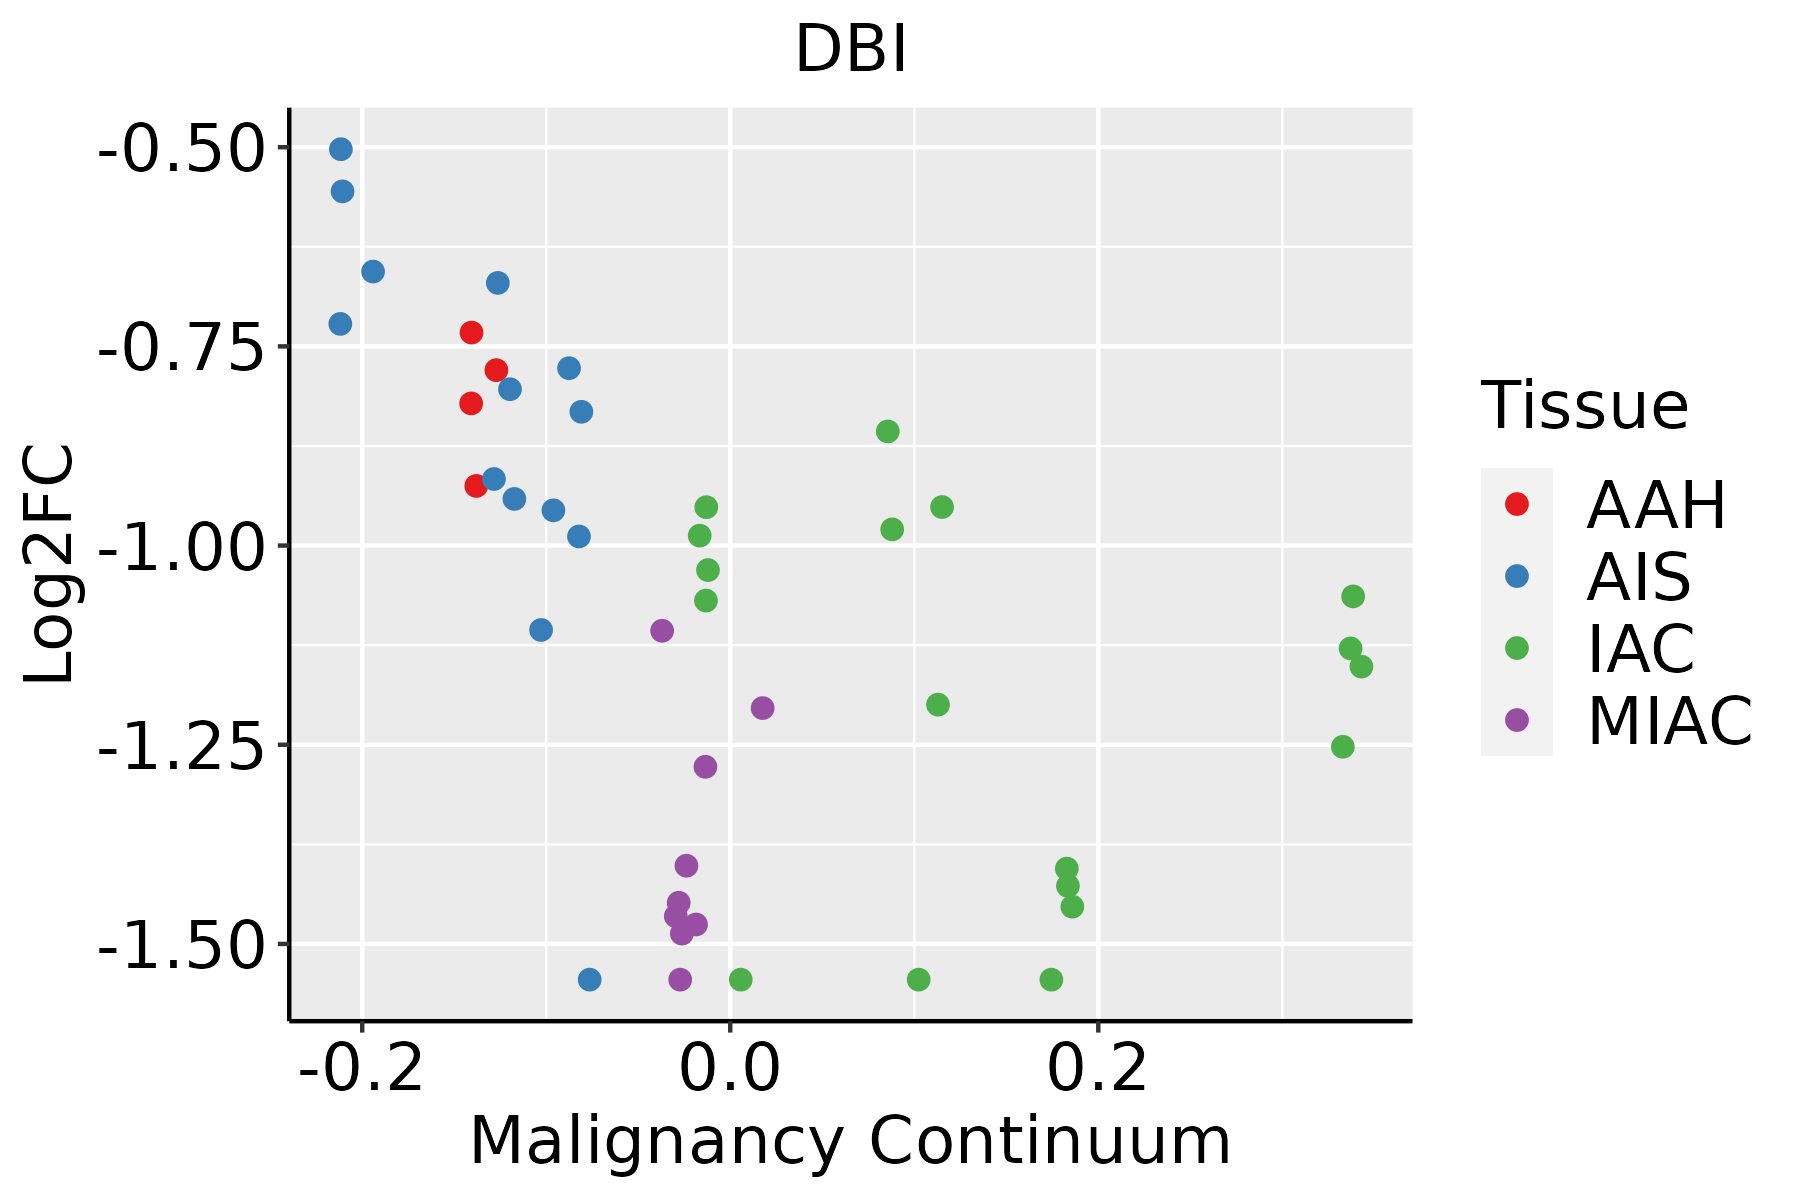 | AAH: Atypical adenomatous hyperplasia |
| AIS: Adenocarcinoma in situ | ||
| IAC: Invasive lung adenocarcinoma | ||
| MIA: Minimally invasive adenocarcinoma | ||
| Oral Cavity | 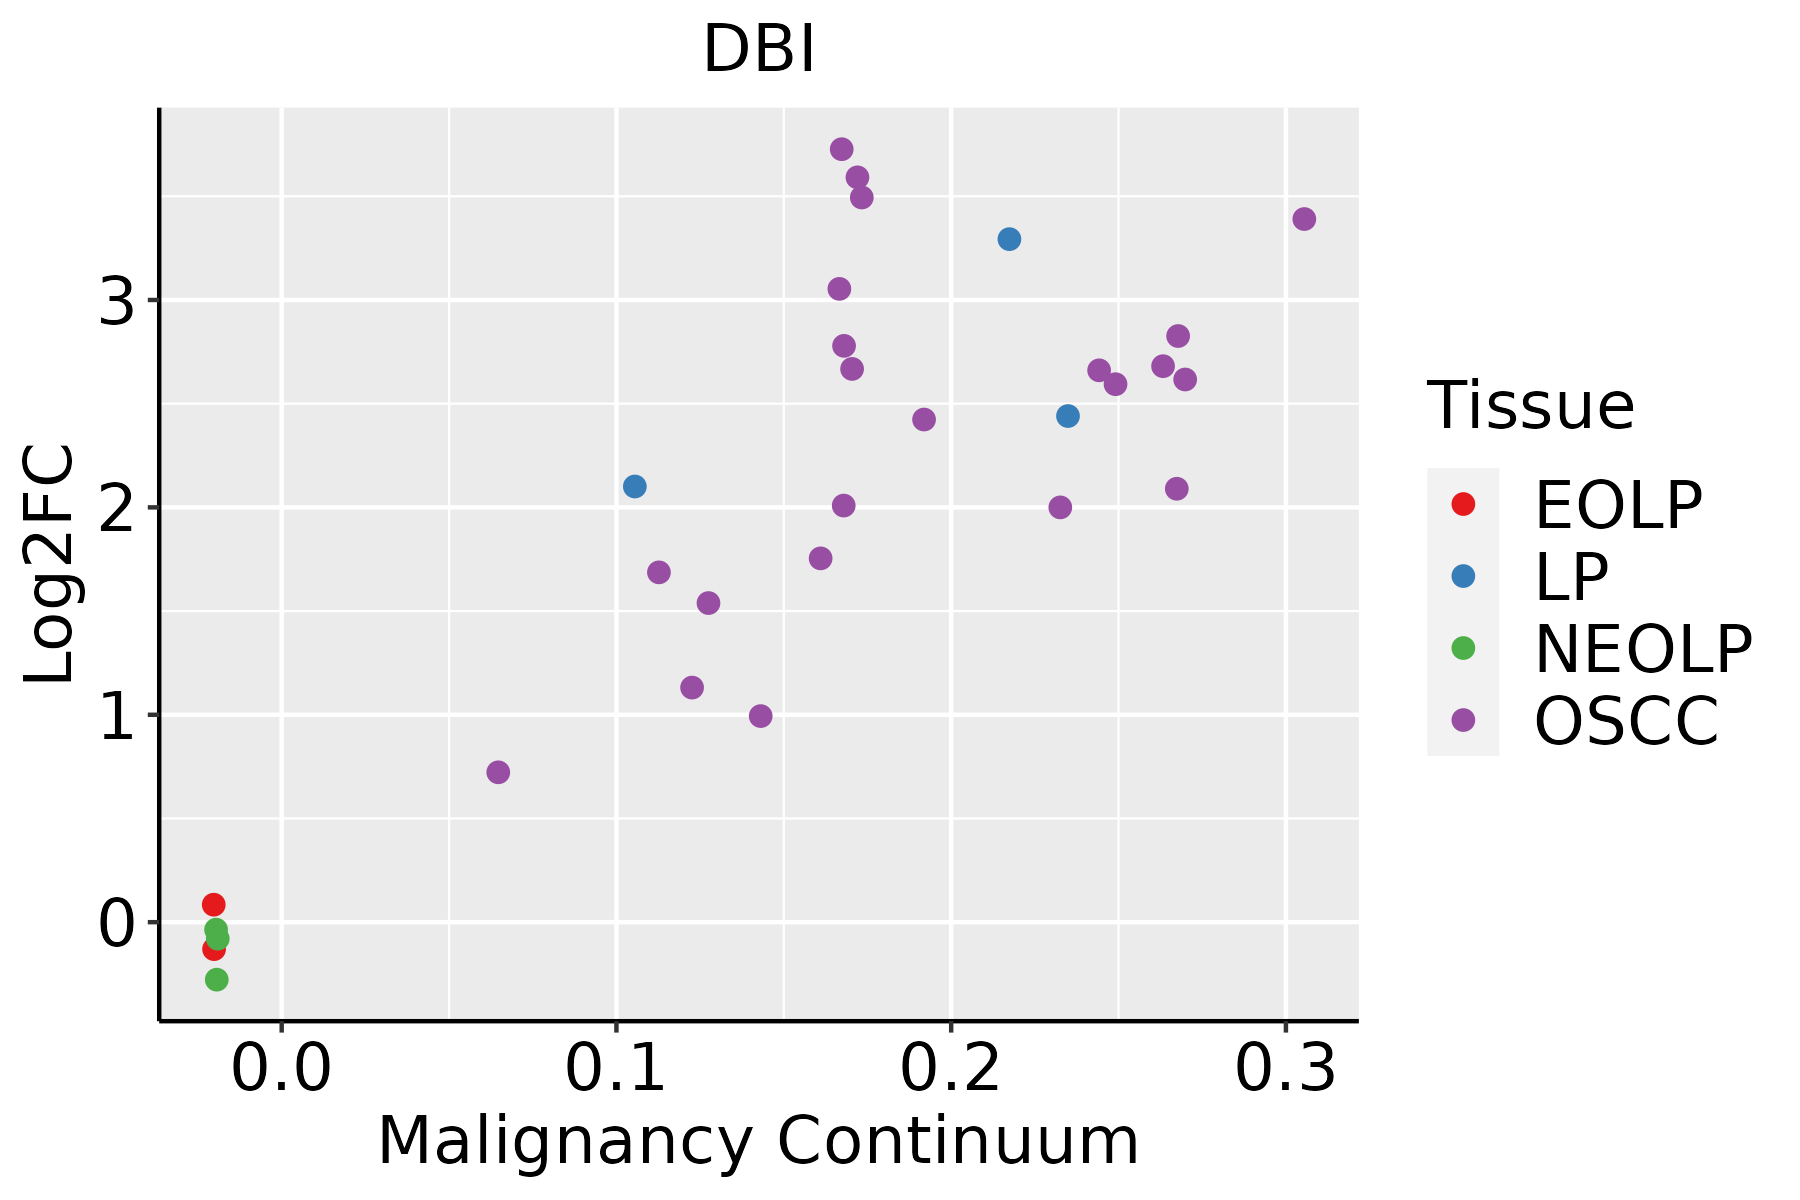 | EOLP: Erosive Oral lichen planus |
| LP: leukoplakia | ||
| NEOLP: Non-erosive oral lichen planus | ||
| OSCC: Oral squamous cell carcinoma | ||
| Prostate | 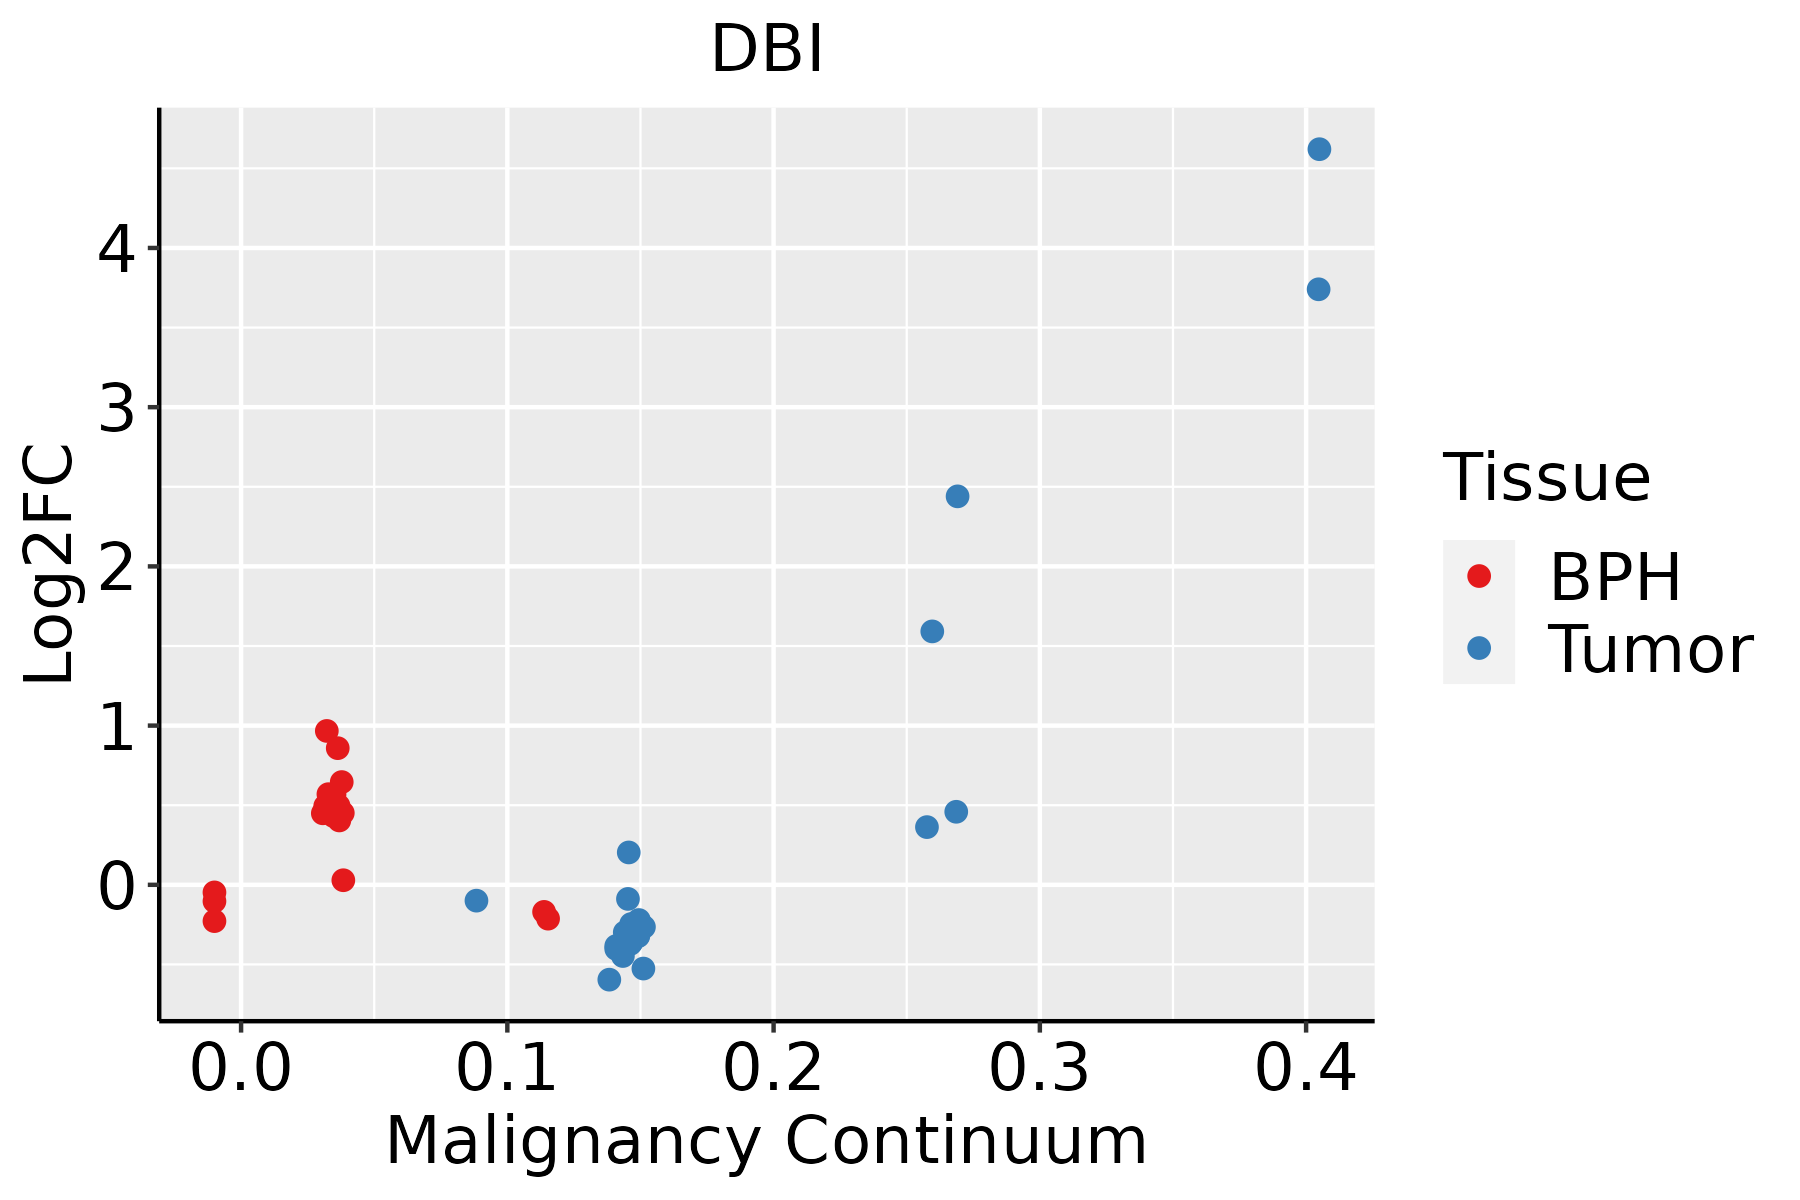 | BPH: Benign Prostatic Hyperplasia |
| Skin |  | AK: Actinic keratosis |
| cSCC: Cutaneous squamous cell carcinoma | ||
| SCCIS:squamous cell carcinoma in situ | ||
| Thyroid |  | ATC: Anaplastic thyroid cancer |
| HT: Hashimoto's thyroiditis | ||
| PTC: Papillary thyroid cancer |
| ∗log2FC in expression of this searched gene in stem-like cells from each diseased tissue sample relative to stem-like cells in normal samples in each tissue plotted against the malignancy continuum. Samples are colored based on if they are from different disease stage. |
Top |
Malignant transformation related pathway analysis |
| Find out the enriched GO biological processes and KEGG pathways involved in transition from healthy to precancer to cancer |
| Tissue | Disease Stage | Enriched GO biological Processes |
| Colorectum | AD |  |
| Colorectum | SER |  |
| Colorectum | MSS |  |
| Colorectum | MSI-H |  |
| Colorectum | FAP |  |
| ∗Top 15 enriched GO BP terms are showed in the bar plot of each disease state in each tissue. Each row represents a significant GO biological process which is colored according to the -log10(p.adjust). |
| Page: 1 2 3 4 5 6 7 8 9 |
| GO ID | Tissue | Disease Stage | Description | Gene Ratio | Bg Ratio | pvalue | p.adjust | Count |
| GO:0010876 | Colorectum | AD | lipid localization | 120/3918 | 448/18723 | 1.59e-03 | 1.33e-02 | 120 |
| GO:0006869 | Colorectum | AD | lipid transport | 108/3918 | 398/18723 | 1.67e-03 | 1.39e-02 | 108 |
| GO:0006650 | Colorectum | AD | glycerophospholipid metabolic process | 83/3918 | 306/18723 | 5.40e-03 | 3.55e-02 | 83 |
| GO:0006644 | Colorectum | AD | phospholipid metabolic process | 101/3918 | 383/18723 | 5.80e-03 | 3.67e-02 | 101 |
| GO:0015748 | Colorectum | AD | organophosphate ester transport | 42/3918 | 140/18723 | 7.04e-03 | 4.31e-02 | 42 |
| GO:0046486 | Colorectum | SER | glycerolipid metabolic process | 82/2897 | 392/18723 | 2.26e-03 | 2.17e-02 | 82 |
| GO:00066441 | Colorectum | SER | phospholipid metabolic process | 79/2897 | 383/18723 | 3.94e-03 | 3.24e-02 | 79 |
| GO:00066501 | Colorectum | SER | glycerophospholipid metabolic process | 64/2897 | 306/18723 | 6.41e-03 | 4.60e-02 | 64 |
| GO:00108761 | Colorectum | MSS | lipid localization | 104/3467 | 448/18723 | 6.76e-03 | 4.38e-02 | 104 |
| GO:00066446 | Esophagus | ESCC | phospholipid metabolic process | 218/8552 | 383/18723 | 5.37e-06 | 5.59e-05 | 218 |
| GO:00421573 | Esophagus | ESCC | lipoprotein metabolic process | 86/8552 | 135/18723 | 1.78e-05 | 1.57e-04 | 86 |
| GO:00064973 | Esophagus | ESCC | protein lipidation | 62/8552 | 92/18723 | 2.08e-05 | 1.80e-04 | 62 |
| GO:00421583 | Esophagus | ESCC | lipoprotein biosynthetic process | 64/8552 | 96/18723 | 2.61e-05 | 2.20e-04 | 64 |
| GO:00066505 | Esophagus | ESCC | glycerophospholipid metabolic process | 174/8552 | 306/18723 | 4.92e-05 | 3.85e-04 | 174 |
| GO:00464864 | Esophagus | ESCC | glycerolipid metabolic process | 211/8552 | 392/18723 | 6.51e-04 | 3.46e-03 | 211 |
| GO:001087611 | Liver | Cirrhotic | lipid localization | 147/4634 | 448/18723 | 6.24e-05 | 7.12e-04 | 147 |
| GO:0042157 | Liver | Cirrhotic | lipoprotein metabolic process | 53/4634 | 135/18723 | 1.32e-04 | 1.29e-03 | 53 |
| GO:000686911 | Liver | Cirrhotic | lipid transport | 128/4634 | 398/18723 | 4.54e-04 | 3.69e-03 | 128 |
| GO:19059521 | Liver | Cirrhotic | regulation of lipid localization | 62/4634 | 181/18723 | 2.53e-03 | 1.51e-02 | 62 |
| GO:0042158 | Liver | Cirrhotic | lipoprotein biosynthetic process | 36/4634 | 96/18723 | 3.69e-03 | 2.03e-02 | 36 |
| Page: 1 2 3 |
| Pathway ID | Tissue | Disease Stage | Description | Gene Ratio | Bg Ratio | pvalue | p.adjust | qvalue | Count |
| hsa0332021 | Liver | Cirrhotic | PPAR signaling pathway | 32/2530 | 75/8465 | 1.24e-02 | 3.92e-02 | 2.42e-02 | 32 |
| hsa0332031 | Liver | Cirrhotic | PPAR signaling pathway | 32/2530 | 75/8465 | 1.24e-02 | 3.92e-02 | 2.42e-02 | 32 |
| hsa033204 | Liver | HCC | PPAR signaling pathway | 48/4020 | 75/8465 | 2.83e-03 | 9.37e-03 | 5.21e-03 | 48 |
| hsa033205 | Liver | HCC | PPAR signaling pathway | 48/4020 | 75/8465 | 2.83e-03 | 9.37e-03 | 5.21e-03 | 48 |
| hsa03320 | Stomach | GC | PPAR signaling pathway | 18/708 | 75/8465 | 3.26e-05 | 4.01e-04 | 2.82e-04 | 18 |
| hsa033201 | Stomach | GC | PPAR signaling pathway | 18/708 | 75/8465 | 3.26e-05 | 4.01e-04 | 2.82e-04 | 18 |
| hsa033202 | Stomach | SIM | PPAR signaling pathway | 15/465 | 75/8465 | 1.08e-05 | 1.42e-04 | 1.14e-04 | 15 |
| hsa033203 | Stomach | SIM | PPAR signaling pathway | 15/465 | 75/8465 | 1.08e-05 | 1.42e-04 | 1.14e-04 | 15 |
| Page: 1 |
Top |
Cell-cell communication analysis |
| Identification of potential cell-cell interactions between two cell types and their ligand-receptor pairs for different disease states |
| Ligand | Receptor | LRpair | Pathway | Tissue | Disease Stage |
| Page: 1 |
Top |
Single-cell gene regulatory network inference analysis |
| Find out the significant the regulons (TFs) and the target genes of each regulon across cell types for different disease states |
| TF | Cell Type | Tissue | Disease Stage | Target Gene | RSS | Regulon Activity |
| ∗The dot plots of a searched regulon are shown for all cell subpopulations in each disease state of each tissue based on the regulon specific score inferred using pySCENIC and by calculating the average expression. |
| Page: 1 |
Top |
Somatic mutation of malignant transformation related genes |
| Annotation of somatic variants for genes involved in malignant transformation |
| Hugo Symbol | Variant Class | Variant Classification | dbSNP RS | HGVSc | HGVSp | HGVSp Short | SWISSPROT | BIOTYPE | SIFT | PolyPhen | Tumor Sample Barcode | Tissue | Histology | Sex | Age | Stage | Therapy Types | Drugs | Outcome |
| DBI | SNV | Missense_Mutation | c.429N>T | p.Lys143Asn | p.K143N | P07108 | protein_coding | tolerated(0.12) | possibly_damaging(0.895) | TCGA-AN-A046-01 | Breast | breast invasive carcinoma | Female | >=65 | I/II | Unknown | Unknown | SD | |
| DBI | SNV | Missense_Mutation | novel | c.202N>C | p.Glu68Gln | p.E68Q | P07108 | protein_coding | deleterious(0.04) | benign(0.261) | TCGA-VS-A958-01 | Cervix | cervical & endocervical cancer | Female | <65 | I/II | Chemotherapy | cisplatin | CR |
| DBI | SNV | Missense_Mutation | rs772399235 | c.132G>T | p.Gln44His | p.Q44H | P07108 | protein_coding | tolerated_low_confidence(0.14) | benign(0.364) | TCGA-AA-3947-01 | Colorectum | colon adenocarcinoma | Female | <65 | I/II | Unknown | Unknown | SD |
| DBI | SNV | Missense_Mutation | c.429N>T | p.Lys143Asn | p.K143N | P07108 | protein_coding | tolerated(0.12) | possibly_damaging(0.895) | TCGA-CA-6718-01 | Colorectum | colon adenocarcinoma | Male | <65 | I/II | Unknown | Unknown | PD | |
| DBI | deletion | Frame_Shift_Del | c.435delA | p.Lys145AsnfsTer27 | p.K145Nfs*27 | P07108 | protein_coding | TCGA-AA-3710-01 | Colorectum | colon adenocarcinoma | Female | >=65 | I/II | Unknown | Unknown | SD | |||
| DBI | insertion | Frame_Shift_Ins | novel | c.435dupA | p.Tyr146IlefsTer19 | p.Y146Ifs*19 | P07108 | protein_coding | TCGA-AD-6964-01 | Colorectum | colon adenocarcinoma | Male | <65 | III/IV | Chemotherapy | folfox | PD | ||
| DBI | SNV | Missense_Mutation | novel | c.362A>C | p.Asn121Thr | p.N121T | P07108 | protein_coding | deleterious(0.02) | possibly_damaging(0.574) | TCGA-B5-A1MX-01 | Endometrium | uterine corpus endometrioid carcinoma | Female | <65 | I/II | Hormone Therapy | megace | SD |
| DBI | SNV | Missense_Mutation | novel | c.49N>G | p.Ser17Ala | p.S17A | P07108 | protein_coding | unknown(0) | TCGA-B5-A3FC-01 | Endometrium | uterine corpus endometrioid carcinoma | Female | <65 | I/II | Unknown | Unknown | SD | |
| DBI | SNV | Missense_Mutation | c.431N>C | p.Lys144Thr | p.K144T | P07108 | protein_coding | tolerated(0.08) | benign(0.18) | TCGA-BS-A0UF-01 | Endometrium | uterine corpus endometrioid carcinoma | Female | >=65 | I/II | Unknown | Unknown | SD | |
| DBI | SNV | Missense_Mutation | novel | c.71N>T | p.Arg24Met | p.R24M | P07108 | protein_coding | deleterious_low_confidence(0) | benign(0.157) | TCGA-DF-A2KN-01 | Endometrium | uterine corpus endometrioid carcinoma | Female | Unknown | I/II | Unknown | Unknown | SD |
| Page: 1 2 3 |
Top |
Related drugs of malignant transformation related genes |
| Identification of chemicals and drugs interact with genes involved in malignant transfromation |
| (DGIdb 4.0) |
| Entrez ID | Symbol | Category | Interaction Types | Drug Claim Name | Drug Name | PMIDs |
| 1622 | DBI | NA | HORMONES | 9712181 |
| Page: 1 |

Copyright 2023-Present -The University of Texas Health Science Center at Houston |