
|
|||||
|
 | |
| |
| |
| |
| |
| |
|
Gene: DBF4 |
Gene summary for DBF4 |
| Gene information | Species | Human | Gene symbol | DBF4 | Gene ID | 10926 |
| Gene name | DBF4 zinc finger | |
| Gene Alias | ASK | |
| Cytomap | 7q21.12 | |
| Gene Type | protein-coding | GO ID | GO:0000082 | UniProtAcc | B4DXK0 |
Top |
Malignant transformation analysis |
| Identification of the aberrant gene expression in precancerous and cancerous lesions by comparing the gene expression of stem-like cells in diseased tissues with normal stem cells |
| Entrez ID | Symbol | Replicates | Species | Organ | Tissue | Adj P-value | Log2FC | Malignancy |
| 10926 | DBF4 | LZE4T | Human | Esophagus | ESCC | 1.94e-05 | 2.86e-01 | 0.0811 |
| 10926 | DBF4 | LZE7T | Human | Esophagus | ESCC | 3.71e-05 | 2.92e-01 | 0.0667 |
| 10926 | DBF4 | LZE8T | Human | Esophagus | ESCC | 2.31e-03 | 8.58e-02 | 0.067 |
| 10926 | DBF4 | LZE24T | Human | Esophagus | ESCC | 7.49e-11 | 3.08e-01 | 0.0596 |
| 10926 | DBF4 | LZE21T | Human | Esophagus | ESCC | 6.18e-03 | 2.41e-01 | 0.0655 |
| 10926 | DBF4 | LZE6T | Human | Esophagus | ESCC | 3.99e-04 | 2.82e-01 | 0.0845 |
| 10926 | DBF4 | P1T-E | Human | Esophagus | ESCC | 4.44e-05 | 2.72e-01 | 0.0875 |
| 10926 | DBF4 | P2T-E | Human | Esophagus | ESCC | 2.26e-21 | 5.88e-01 | 0.1177 |
| 10926 | DBF4 | P4T-E | Human | Esophagus | ESCC | 1.26e-18 | 5.95e-01 | 0.1323 |
| 10926 | DBF4 | P5T-E | Human | Esophagus | ESCC | 1.67e-17 | 4.57e-01 | 0.1327 |
| 10926 | DBF4 | P8T-E | Human | Esophagus | ESCC | 4.58e-07 | 1.36e-01 | 0.0889 |
| 10926 | DBF4 | P9T-E | Human | Esophagus | ESCC | 2.08e-12 | 4.04e-01 | 0.1131 |
| 10926 | DBF4 | P10T-E | Human | Esophagus | ESCC | 4.91e-14 | 3.67e-01 | 0.116 |
| 10926 | DBF4 | P11T-E | Human | Esophagus | ESCC | 1.79e-06 | 4.68e-01 | 0.1426 |
| 10926 | DBF4 | P12T-E | Human | Esophagus | ESCC | 1.37e-11 | 1.99e-01 | 0.1122 |
| 10926 | DBF4 | P15T-E | Human | Esophagus | ESCC | 2.30e-04 | 2.04e-01 | 0.1149 |
| 10926 | DBF4 | P16T-E | Human | Esophagus | ESCC | 2.10e-44 | 9.44e-01 | 0.1153 |
| 10926 | DBF4 | P17T-E | Human | Esophagus | ESCC | 2.58e-04 | 3.43e-01 | 0.1278 |
| 10926 | DBF4 | P19T-E | Human | Esophagus | ESCC | 3.36e-03 | 4.04e-01 | 0.1662 |
| 10926 | DBF4 | P20T-E | Human | Esophagus | ESCC | 9.55e-21 | 6.60e-01 | 0.1124 |
| Page: 1 2 3 4 5 |
| Tissue | Expression Dynamics | Abbreviation |
| Esophagus | 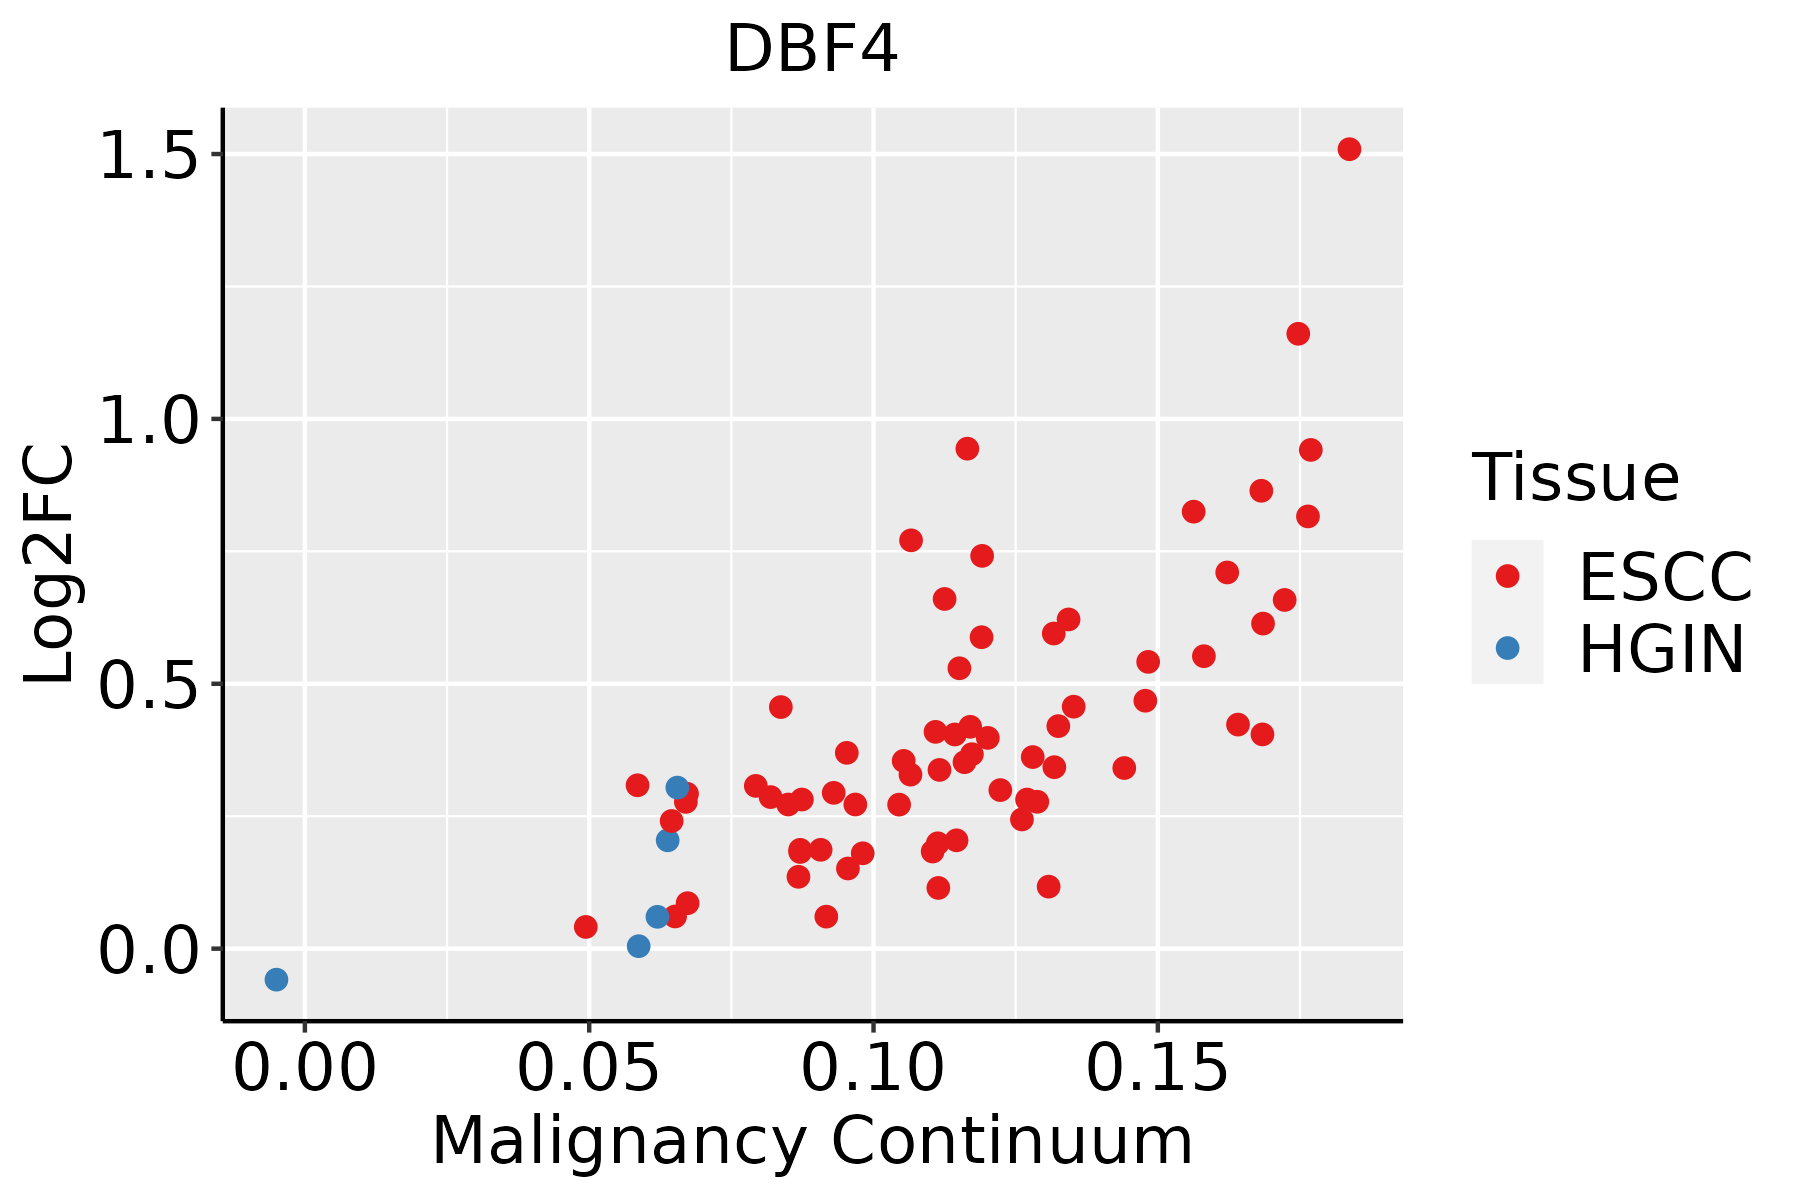 | ESCC: Esophageal squamous cell carcinoma |
| HGIN: High-grade intraepithelial neoplasias | ||
| LGIN: Low-grade intraepithelial neoplasias | ||
| Liver |  | HCC: Hepatocellular carcinoma |
| NAFLD: Non-alcoholic fatty liver disease | ||
| Oral Cavity |  | EOLP: Erosive Oral lichen planus |
| LP: leukoplakia | ||
| NEOLP: Non-erosive oral lichen planus | ||
| OSCC: Oral squamous cell carcinoma | ||
| Skin | 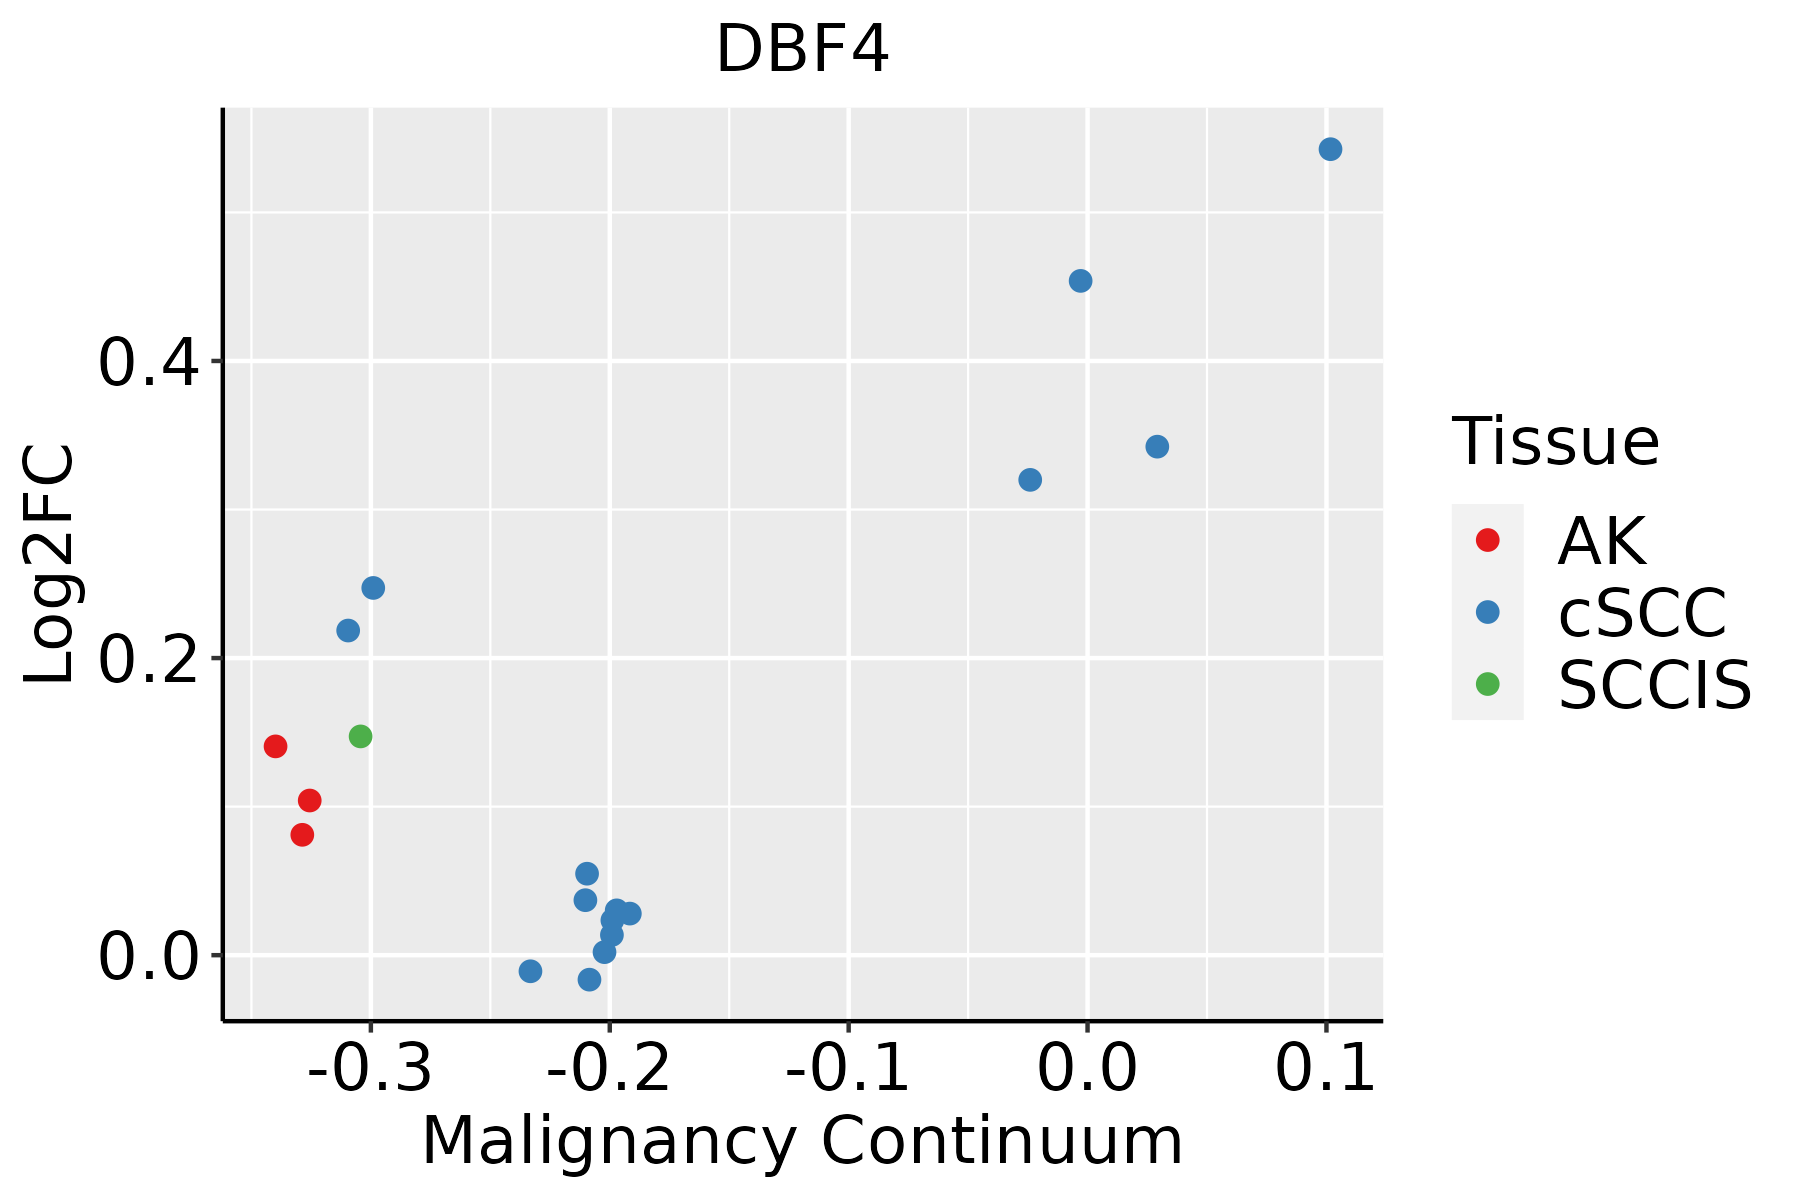 | AK: Actinic keratosis |
| cSCC: Cutaneous squamous cell carcinoma | ||
| SCCIS:squamous cell carcinoma in situ | ||
| Thyroid | 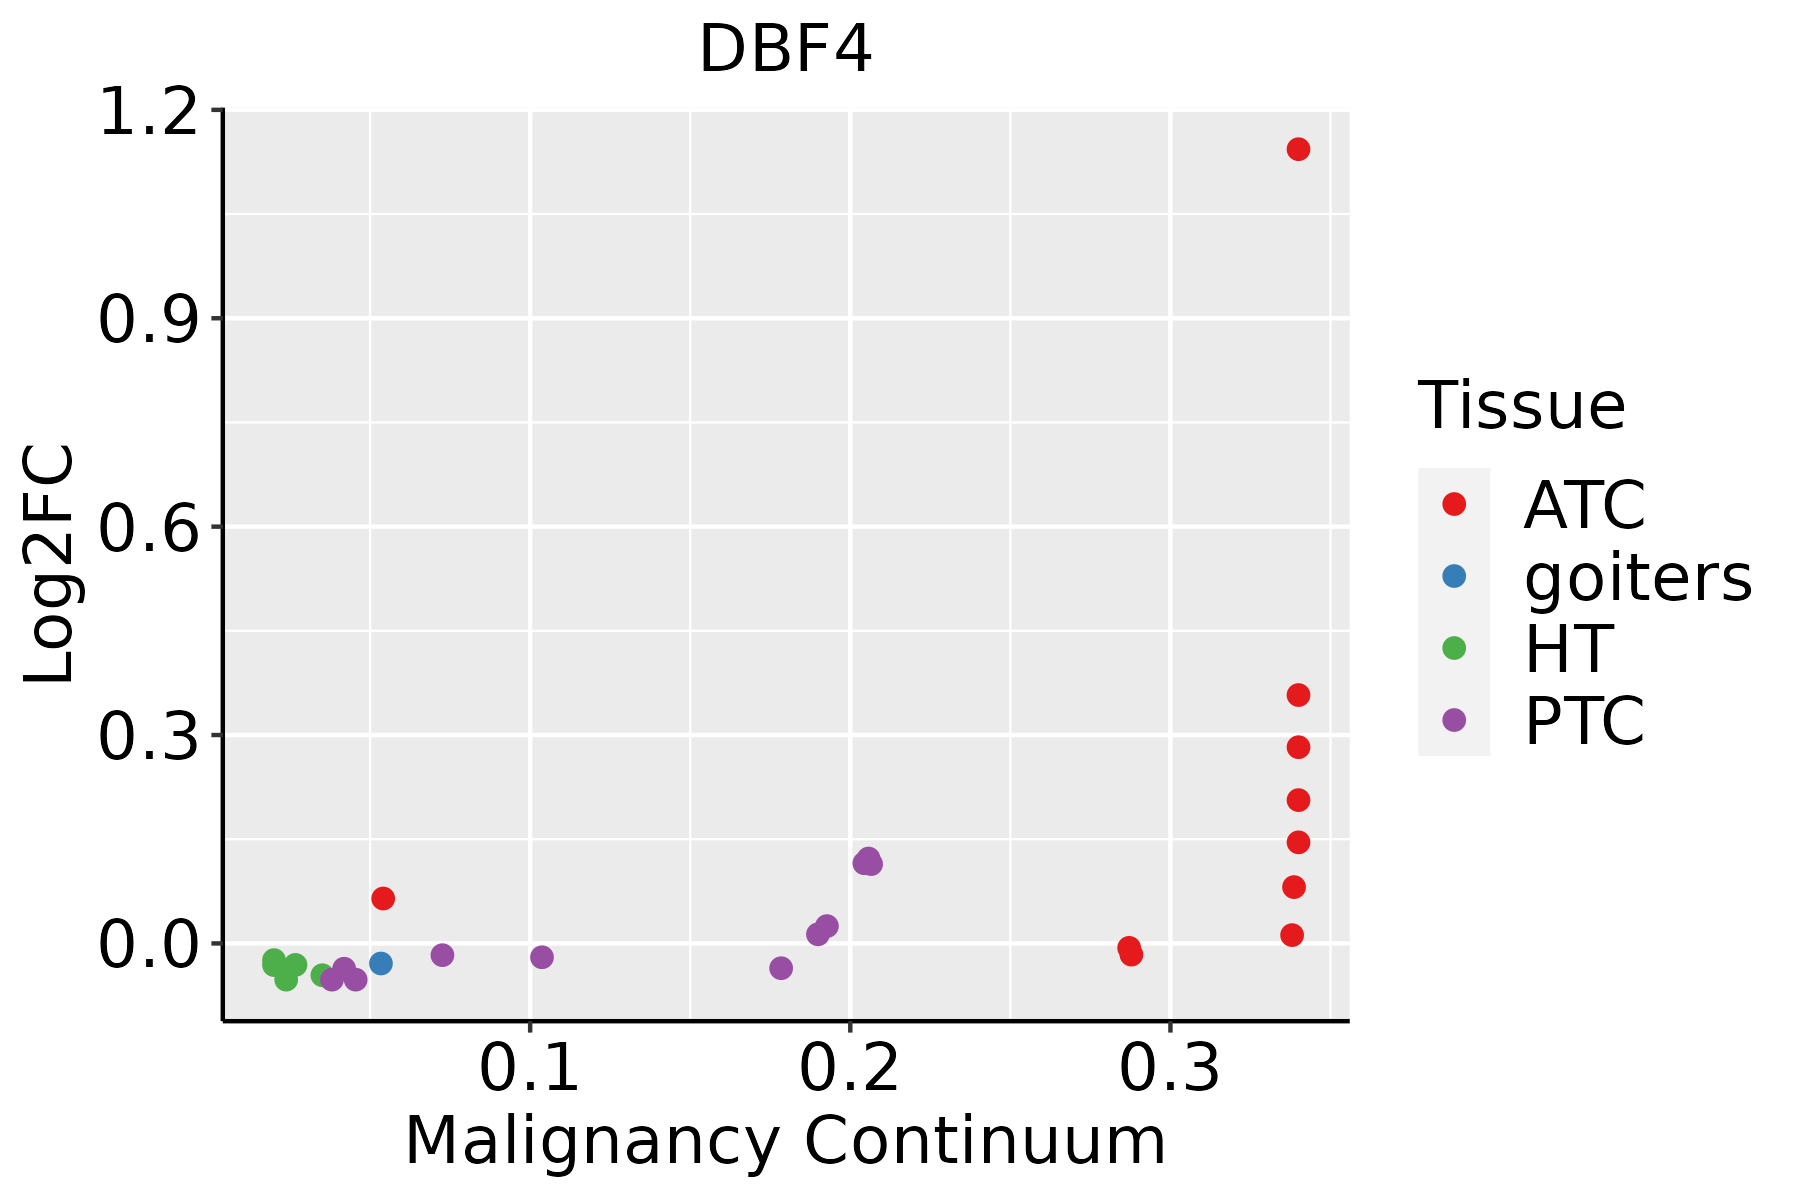 | ATC: Anaplastic thyroid cancer |
| HT: Hashimoto's thyroiditis | ||
| PTC: Papillary thyroid cancer |
| ∗log2FC in expression of this searched gene in stem-like cells from each diseased tissue sample relative to stem-like cells in normal samples in each tissue plotted against the malignancy continuum. Samples are colored based on if they are from different disease stage. |
Top |
Malignant transformation related pathway analysis |
| Find out the enriched GO biological processes and KEGG pathways involved in transition from healthy to precancer to cancer |
| Tissue | Disease Stage | Enriched GO biological Processes |
| Colorectum | AD |  |
| Colorectum | SER |  |
| Colorectum | MSS |  |
| Colorectum | MSI-H |  |
| Colorectum | FAP |  |
| ∗Top 15 enriched GO BP terms are showed in the bar plot of each disease state in each tissue. Each row represents a significant GO biological process which is colored according to the -log10(p.adjust). |
| Page: 1 2 3 4 5 6 7 8 9 |
| GO ID | Tissue | Disease Stage | Description | Gene Ratio | Bg Ratio | pvalue | p.adjust | Count |
| GO:004477216 | Esophagus | ESCC | mitotic cell cycle phase transition | 281/8552 | 424/18723 | 4.63e-18 | 4.45e-16 | 281 |
| GO:00062604 | Esophagus | ESCC | DNA replication | 181/8552 | 260/18723 | 3.55e-15 | 2.05e-13 | 181 |
| GO:007190016 | Esophagus | ESCC | regulation of protein serine/threonine kinase activity | 227/8552 | 359/18723 | 1.12e-11 | 4.10e-10 | 227 |
| GO:190198713 | Esophagus | ESCC | regulation of cell cycle phase transition | 242/8552 | 390/18723 | 3.86e-11 | 1.26e-09 | 242 |
| GO:004578710 | Esophagus | ESCC | positive regulation of cell cycle | 196/8552 | 313/18723 | 9.27e-10 | 2.24e-08 | 196 |
| GO:00062612 | Esophagus | ESCC | DNA-dependent DNA replication | 100/8552 | 151/18723 | 2.61e-07 | 3.94e-06 | 100 |
| GO:000008214 | Esophagus | ESCC | G1/S transition of mitotic cell cycle | 134/8552 | 214/18723 | 4.04e-07 | 5.55e-06 | 134 |
| GO:004484314 | Esophagus | ESCC | cell cycle G1/S phase transition | 148/8552 | 241/18723 | 5.68e-07 | 7.48e-06 | 148 |
| GO:00062754 | Esophagus | ESCC | regulation of DNA replication | 73/8552 | 107/18723 | 1.97e-06 | 2.28e-05 | 73 |
| GO:00719029 | Esophagus | ESCC | positive regulation of protein serine/threonine kinase activity | 124/8552 | 200/18723 | 2.27e-06 | 2.61e-05 | 124 |
| GO:00900689 | Esophagus | ESCC | positive regulation of cell cycle process | 142/8552 | 236/18723 | 4.79e-06 | 5.08e-05 | 142 |
| GO:004586018 | Esophagus | ESCC | positive regulation of protein kinase activity | 219/8552 | 386/18723 | 6.91e-06 | 6.97e-05 | 219 |
| GO:003367420 | Esophagus | ESCC | positive regulation of kinase activity | 260/8552 | 467/18723 | 7.26e-06 | 7.22e-05 | 260 |
| GO:0090329 | Esophagus | ESCC | regulation of DNA-dependent DNA replication | 30/8552 | 46/18723 | 5.91e-03 | 2.18e-02 | 30 |
| GO:00457406 | Esophagus | ESCC | positive regulation of DNA replication | 26/8552 | 40/18723 | 1.08e-02 | 3.66e-02 | 26 |
| GO:00447722 | Liver | HCC | mitotic cell cycle phase transition | 240/7958 | 424/18723 | 2.47e-09 | 6.84e-08 | 240 |
| GO:19019871 | Liver | HCC | regulation of cell cycle phase transition | 211/7958 | 390/18723 | 2.11e-06 | 2.89e-05 | 211 |
| GO:004578711 | Liver | HCC | positive regulation of cell cycle | 172/7958 | 313/18723 | 5.29e-06 | 6.58e-05 | 172 |
| GO:00062601 | Liver | HCC | DNA replication | 146/7958 | 260/18723 | 5.68e-06 | 7.02e-05 | 146 |
| GO:00448432 | Liver | HCC | cell cycle G1/S phase transition | 134/7958 | 241/18723 | 2.60e-05 | 2.70e-04 | 134 |
| Page: 1 2 3 4 5 |
| Pathway ID | Tissue | Disease Stage | Description | Gene Ratio | Bg Ratio | pvalue | p.adjust | qvalue | Count |
| hsa0411023 | Esophagus | ESCC | Cell cycle | 126/4205 | 157/8465 | 1.34e-15 | 5.60e-14 | 2.87e-14 | 126 |
| hsa0411033 | Esophagus | ESCC | Cell cycle | 126/4205 | 157/8465 | 1.34e-15 | 5.60e-14 | 2.87e-14 | 126 |
| hsa041102 | Liver | HCC | Cell cycle | 106/4020 | 157/8465 | 2.54e-07 | 3.04e-06 | 1.69e-06 | 106 |
| hsa041103 | Liver | HCC | Cell cycle | 106/4020 | 157/8465 | 2.54e-07 | 3.04e-06 | 1.69e-06 | 106 |
| hsa041108 | Oral cavity | OSCC | Cell cycle | 118/3704 | 157/8465 | 7.15e-16 | 2.66e-14 | 1.35e-14 | 118 |
| hsa0411015 | Oral cavity | OSCC | Cell cycle | 118/3704 | 157/8465 | 7.15e-16 | 2.66e-14 | 1.35e-14 | 118 |
| Page: 1 |
Top |
Cell-cell communication analysis |
| Identification of potential cell-cell interactions between two cell types and their ligand-receptor pairs for different disease states |
| Ligand | Receptor | LRpair | Pathway | Tissue | Disease Stage |
| Page: 1 |
Top |
Single-cell gene regulatory network inference analysis |
| Find out the significant the regulons (TFs) and the target genes of each regulon across cell types for different disease states |
| TF | Cell Type | Tissue | Disease Stage | Target Gene | RSS | Regulon Activity |
| ∗The dot plots of a searched regulon are shown for all cell subpopulations in each disease state of each tissue based on the regulon specific score inferred using pySCENIC and by calculating the average expression. |
| Page: 1 |
Top |
Somatic mutation of malignant transformation related genes |
| Annotation of somatic variants for genes involved in malignant transformation |
| Hugo Symbol | Variant Class | Variant Classification | dbSNP RS | HGVSc | HGVSp | HGVSp Short | SWISSPROT | BIOTYPE | SIFT | PolyPhen | Tumor Sample Barcode | Tissue | Histology | Sex | Age | Stage | Therapy Types | Drugs | Outcome |
| DBF4 | insertion | Frame_Shift_Ins | novel | c.916_917insA | p.Leu306HisfsTer8 | p.L306Hfs*8 | Q9UBU7 | protein_coding | TCGA-A7-A26I-01 | Breast | breast invasive carcinoma | Female | >=65 | I/II | Chemotherapy | cytoxan | SD | ||
| DBF4 | SNV | Missense_Mutation | novel | c.1692N>C | p.Lys564Asn | p.K564N | Q9UBU7 | protein_coding | tolerated(0.55) | benign(0) | TCGA-JW-A5VL-01 | Cervix | cervical & endocervical cancer | Female | <65 | I/II | Unknown | Unknown | SD |
| DBF4 | SNV | Missense_Mutation | novel | c.1789N>A | p.Asp597Asn | p.D597N | Q9UBU7 | protein_coding | tolerated(0.53) | benign(0.003) | TCGA-ZJ-AAXB-01 | Cervix | cervical & endocervical cancer | Female | <65 | I/II | Unknown | Unknown | SD |
| DBF4 | SNV | Missense_Mutation | novel | c.233T>G | p.Phe78Cys | p.F78C | Q9UBU7 | protein_coding | deleterious(0) | probably_damaging(0.999) | TCGA-AA-3984-01 | Colorectum | colon adenocarcinoma | Female | <65 | I/II | Unknown | Unknown | SD |
| DBF4 | SNV | Missense_Mutation | novel | c.1727G>A | p.Arg576Gln | p.R576Q | Q9UBU7 | protein_coding | deleterious(0) | possibly_damaging(0.632) | TCGA-AA-3984-01 | Colorectum | colon adenocarcinoma | Female | <65 | I/II | Unknown | Unknown | SD |
| DBF4 | SNV | Missense_Mutation | novel | c.953T>G | p.Phe318Cys | p.F318C | Q9UBU7 | protein_coding | deleterious(0) | probably_damaging(0.999) | TCGA-CA-6717-01 | Colorectum | colon adenocarcinoma | Male | <65 | I/II | Chemotherapy | oxaliplatin | CR |
| DBF4 | SNV | Missense_Mutation | novel | c.1390A>G | p.Ile464Val | p.I464V | Q9UBU7 | protein_coding | tolerated(0.78) | benign(0) | TCGA-CA-6717-01 | Colorectum | colon adenocarcinoma | Male | <65 | I/II | Chemotherapy | oxaliplatin | CR |
| DBF4 | SNV | Missense_Mutation | c.187N>C | p.Lys63Gln | p.K63Q | Q9UBU7 | protein_coding | deleterious(0.01) | possibly_damaging(0.907) | TCGA-CA-6718-01 | Colorectum | colon adenocarcinoma | Male | <65 | I/II | Unknown | Unknown | PD | |
| DBF4 | SNV | Missense_Mutation | c.253N>C | p.Tyr85His | p.Y85H | Q9UBU7 | protein_coding | deleterious(0) | possibly_damaging(0.712) | TCGA-CK-4951-01 | Colorectum | colon adenocarcinoma | Female | >=65 | I/II | Unknown | Unknown | PD | |
| DBF4 | SNV | Missense_Mutation | c.1384C>T | p.Leu462Phe | p.L462F | Q9UBU7 | protein_coding | tolerated(0.71) | benign(0.001) | TCGA-D5-7000-01 | Colorectum | colon adenocarcinoma | Female | >=65 | I/II | Unknown | Unknown | SD |
| Page: 1 2 3 4 5 6 7 |
Top |
Related drugs of malignant transformation related genes |
| Identification of chemicals and drugs interact with genes involved in malignant transfromation |
| (DGIdb 4.0) |
| Entrez ID | Symbol | Category | Interaction Types | Drug Claim Name | Drug Name | PMIDs |
| Page: 1 |

Copyright 2023-Present -The University of Texas Health Science Center at Houston |