
|
|||||
|
 | |
| |
| |
| |
| |
| |
|
Gene: DAPP1 |
Gene summary for DAPP1 |
| Gene information | Species | Human | Gene symbol | DAPP1 | Gene ID | 27071 |
| Gene name | dual adaptor of phosphotyrosine and 3-phosphoinositides 1 | |
| Gene Alias | BAM32 | |
| Cytomap | 4q23 | |
| Gene Type | protein-coding | GO ID | GO:0006464 | UniProtAcc | J3KNB3 |
Top |
Malignant transformation analysis |
| Identification of the aberrant gene expression in precancerous and cancerous lesions by comparing the gene expression of stem-like cells in diseased tissues with normal stem cells |
| Entrez ID | Symbol | Replicates | Species | Organ | Tissue | Adj P-value | Log2FC | Malignancy |
| 27071 | DAPP1 | LZE4T | Human | Esophagus | ESCC | 1.82e-03 | 2.76e-01 | 0.0811 |
| 27071 | DAPP1 | LZE8T | Human | Esophagus | ESCC | 3.25e-06 | 1.52e-01 | 0.067 |
| 27071 | DAPP1 | LZE22T | Human | Esophagus | ESCC | 1.27e-07 | 4.94e-01 | 0.068 |
| 27071 | DAPP1 | LZE24T | Human | Esophagus | ESCC | 1.38e-11 | 2.47e-01 | 0.0596 |
| 27071 | DAPP1 | P1T-E | Human | Esophagus | ESCC | 1.30e-06 | 2.69e-01 | 0.0875 |
| 27071 | DAPP1 | P2T-E | Human | Esophagus | ESCC | 6.71e-16 | 3.87e-01 | 0.1177 |
| 27071 | DAPP1 | P8T-E | Human | Esophagus | ESCC | 6.83e-07 | 9.78e-02 | 0.0889 |
| 27071 | DAPP1 | P9T-E | Human | Esophagus | ESCC | 4.66e-04 | 1.21e-01 | 0.1131 |
| 27071 | DAPP1 | P10T-E | Human | Esophagus | ESCC | 1.76e-11 | 2.31e-01 | 0.116 |
| 27071 | DAPP1 | P11T-E | Human | Esophagus | ESCC | 3.19e-05 | 4.72e-01 | 0.1426 |
| 27071 | DAPP1 | P12T-E | Human | Esophagus | ESCC | 1.74e-12 | 3.36e-01 | 0.1122 |
| 27071 | DAPP1 | P15T-E | Human | Esophagus | ESCC | 9.35e-29 | 7.35e-01 | 0.1149 |
| 27071 | DAPP1 | P20T-E | Human | Esophagus | ESCC | 4.58e-10 | 2.55e-01 | 0.1124 |
| 27071 | DAPP1 | P21T-E | Human | Esophagus | ESCC | 1.59e-05 | 2.21e-01 | 0.1617 |
| 27071 | DAPP1 | P23T-E | Human | Esophagus | ESCC | 8.34e-07 | 3.66e-01 | 0.108 |
| 27071 | DAPP1 | P24T-E | Human | Esophagus | ESCC | 6.35e-04 | 3.94e-02 | 0.1287 |
| 27071 | DAPP1 | P26T-E | Human | Esophagus | ESCC | 5.49e-35 | 8.22e-01 | 0.1276 |
| 27071 | DAPP1 | P27T-E | Human | Esophagus | ESCC | 8.19e-12 | 1.85e-01 | 0.1055 |
| 27071 | DAPP1 | P30T-E | Human | Esophagus | ESCC | 1.57e-06 | 2.05e-01 | 0.137 |
| 27071 | DAPP1 | P37T-E | Human | Esophagus | ESCC | 6.80e-07 | 3.08e-02 | 0.1371 |
| Page: 1 2 3 |
| Tissue | Expression Dynamics | Abbreviation |
| Esophagus |  | ESCC: Esophageal squamous cell carcinoma |
| HGIN: High-grade intraepithelial neoplasias | ||
| LGIN: Low-grade intraepithelial neoplasias | ||
| Lung |  | AAH: Atypical adenomatous hyperplasia |
| AIS: Adenocarcinoma in situ | ||
| IAC: Invasive lung adenocarcinoma | ||
| MIA: Minimally invasive adenocarcinoma | ||
| Oral Cavity | 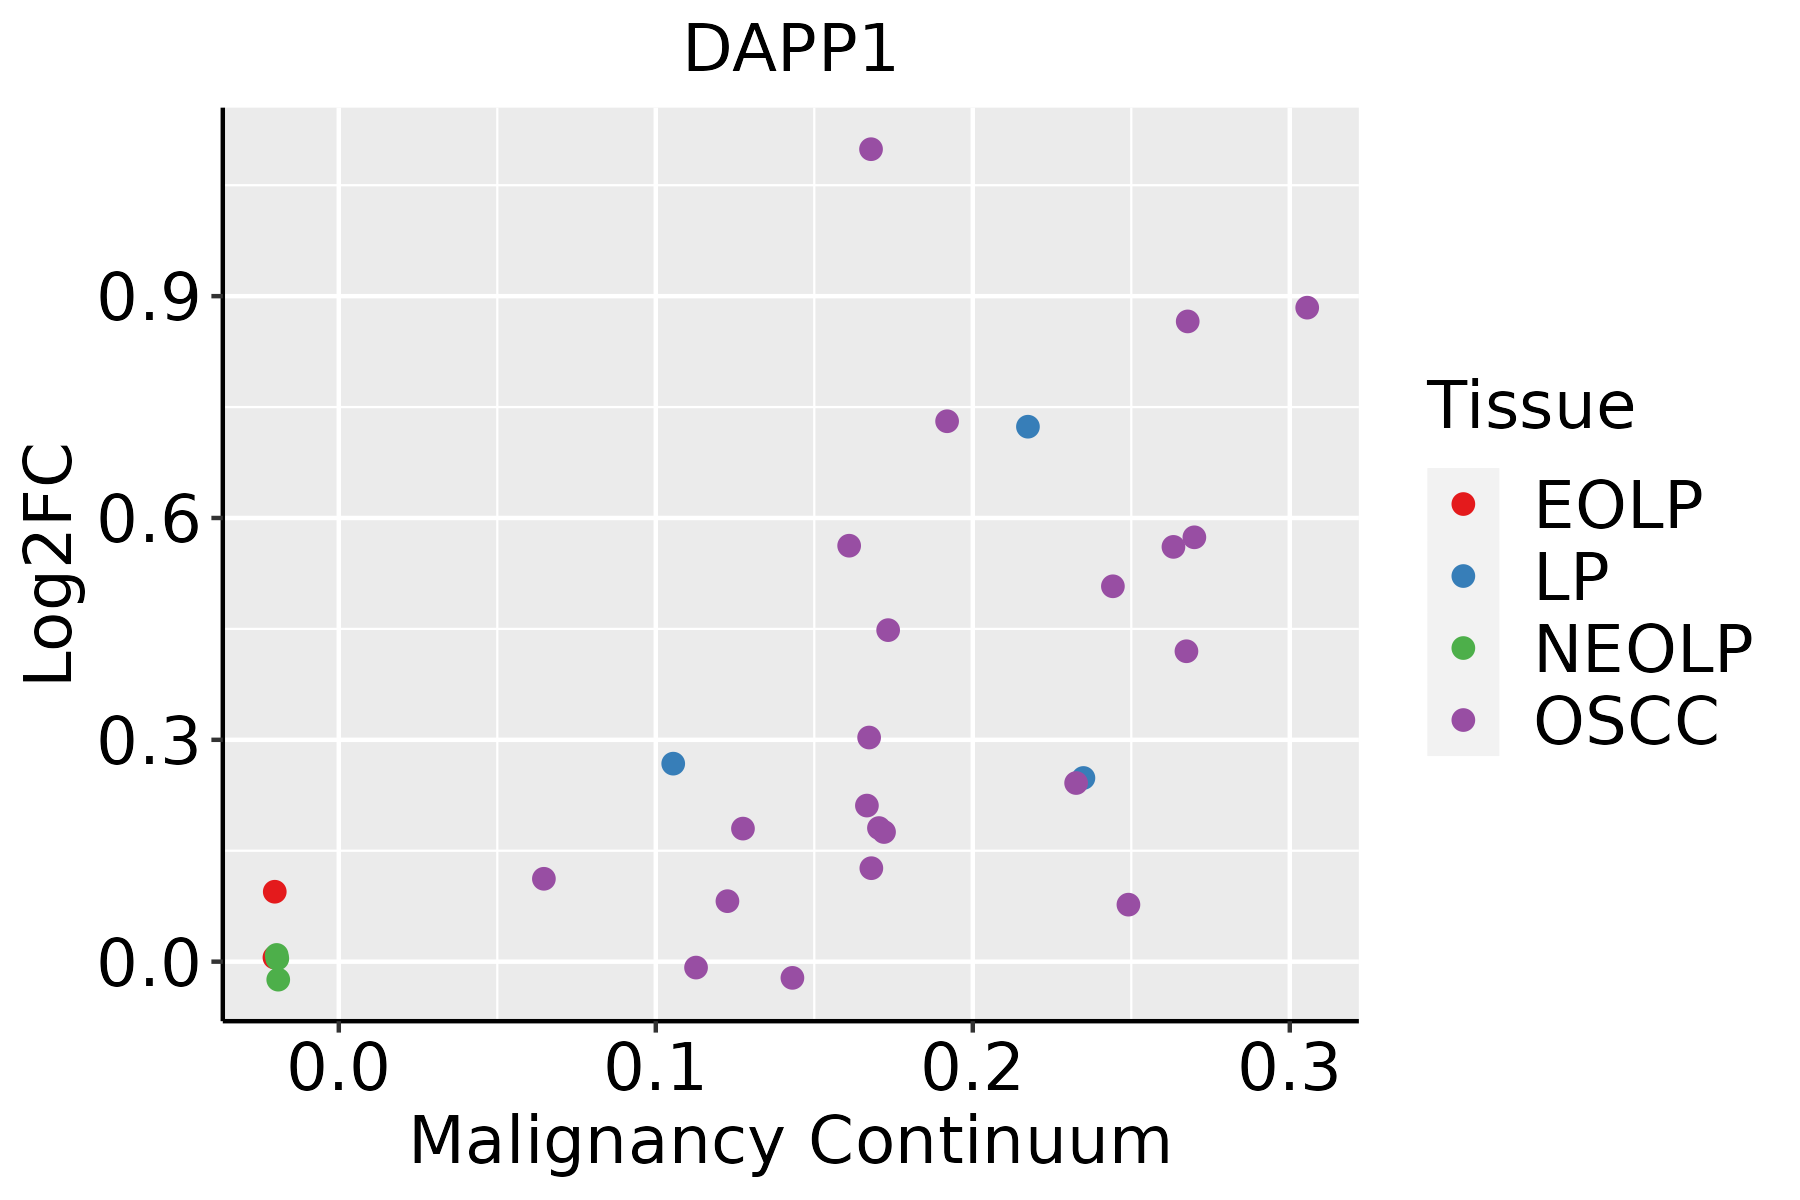 | EOLP: Erosive Oral lichen planus |
| LP: leukoplakia | ||
| NEOLP: Non-erosive oral lichen planus | ||
| OSCC: Oral squamous cell carcinoma |
| ∗log2FC in expression of this searched gene in stem-like cells from each diseased tissue sample relative to stem-like cells in normal samples in each tissue plotted against the malignancy continuum. Samples are colored based on if they are from different disease stage. |
Top |
Malignant transformation related pathway analysis |
| Find out the enriched GO biological processes and KEGG pathways involved in transition from healthy to precancer to cancer |
| Tissue | Disease Stage | Enriched GO biological Processes |
| Colorectum | AD |  |
| Colorectum | SER |  |
| Colorectum | MSS |  |
| Colorectum | MSI-H |  |
| Colorectum | FAP |  |
| ∗Top 15 enriched GO BP terms are showed in the bar plot of each disease state in each tissue. Each row represents a significant GO biological process which is colored according to the -log10(p.adjust). |
| Page: 1 2 3 4 5 6 7 8 9 |
| GO ID | Tissue | Disease Stage | Description | Gene Ratio | Bg Ratio | pvalue | p.adjust | Count |
| GO:001631110 | Esophagus | ESCC | dephosphorylation | 251/8552 | 417/18723 | 1.26e-09 | 2.99e-08 | 251 |
| GO:000647018 | Esophagus | ESCC | protein dephosphorylation | 177/8552 | 281/18723 | 3.13e-09 | 6.72e-08 | 177 |
| GO:00064707 | Lung | IAC | protein dephosphorylation | 60/2061 | 281/18723 | 3.24e-07 | 2.48e-05 | 60 |
| GO:00163116 | Lung | IAC | dephosphorylation | 75/2061 | 417/18723 | 1.21e-05 | 3.64e-04 | 75 |
| GO:000647015 | Oral cavity | OSCC | protein dephosphorylation | 162/7305 | 281/18723 | 1.56e-10 | 4.56e-09 | 162 |
| GO:00163119 | Oral cavity | OSCC | dephosphorylation | 220/7305 | 417/18723 | 6.33e-09 | 1.34e-07 | 220 |
| GO:000647016 | Oral cavity | LP | protein dephosphorylation | 89/4623 | 281/18723 | 4.60e-03 | 2.93e-02 | 89 |
| Page: 1 |
| Pathway ID | Tissue | Disease Stage | Description | Gene Ratio | Bg Ratio | pvalue | p.adjust | qvalue | Count |
| hsa04662 | Oral cavity | OSCC | B cell receptor signaling pathway | 48/3704 | 84/8465 | 9.02e-03 | 2.01e-02 | 1.03e-02 | 48 |
| hsa046621 | Oral cavity | OSCC | B cell receptor signaling pathway | 48/3704 | 84/8465 | 9.02e-03 | 2.01e-02 | 1.03e-02 | 48 |
| Page: 1 |
Top |
Cell-cell communication analysis |
| Identification of potential cell-cell interactions between two cell types and their ligand-receptor pairs for different disease states |
| Ligand | Receptor | LRpair | Pathway | Tissue | Disease Stage |
| Page: 1 |
Top |
Single-cell gene regulatory network inference analysis |
| Find out the significant the regulons (TFs) and the target genes of each regulon across cell types for different disease states |
| TF | Cell Type | Tissue | Disease Stage | Target Gene | RSS | Regulon Activity |
| ∗The dot plots of a searched regulon are shown for all cell subpopulations in each disease state of each tissue based on the regulon specific score inferred using pySCENIC and by calculating the average expression. |
| Page: 1 |
Top |
Somatic mutation of malignant transformation related genes |
| Annotation of somatic variants for genes involved in malignant transformation |
| Hugo Symbol | Variant Class | Variant Classification | dbSNP RS | HGVSc | HGVSp | HGVSp Short | SWISSPROT | BIOTYPE | SIFT | PolyPhen | Tumor Sample Barcode | Tissue | Histology | Sex | Age | Stage | Therapy Types | Drugs | Outcome |
| DAPP1 | SNV | Missense_Mutation | c.65N>C | p.Arg22Thr | p.R22T | Q9UN19 | protein_coding | tolerated_low_confidence(0.64) | benign(0.035) | TCGA-AC-A23H-01 | Breast | breast invasive carcinoma | Female | >=65 | I/II | Unknown | Unknown | PD | |
| DAPP1 | insertion | Frame_Shift_Ins | novel | c.103_104insCCTTTTTACAAGAGGACACCAGTCATATTGAATTA | p.Trp35SerfsTer38 | p.W35Sfs*38 | Q9UN19 | protein_coding | TCGA-A7-A0CG-01 | Breast | breast invasive carcinoma | Female | >=65 | I/II | Unknown | Unknown | SD | ||
| DAPP1 | insertion | Nonsense_Mutation | novel | c.529_530insAATATTGATTAATATTATTTAAG | p.Leu177GlnfsTer3 | p.L177Qfs*3 | Q9UN19 | protein_coding | TCGA-A8-A07U-01 | Breast | breast invasive carcinoma | Female | >=65 | III/IV | Chemotherapy | 5-fluorouracil | SD | ||
| DAPP1 | insertion | Nonsense_Mutation | novel | c.176_177insCATTTTAACTTGGTAAAGACCCTG | p.Leu59_Leu60insIleLeuThrTrpTerArgProCys | p.L59_L60insILTW*RPC | Q9UN19 | protein_coding | TCGA-AN-A0FX-01 | Breast | breast invasive carcinoma | Female | <65 | I/II | Unknown | Unknown | SD | ||
| DAPP1 | SNV | Missense_Mutation | c.306N>C | p.Leu102Phe | p.L102F | Q9UN19 | protein_coding | tolerated(0.07) | benign(0.344) | TCGA-C5-A7UH-01 | Cervix | cervical & endocervical cancer | Female | <65 | III/IV | Chemotherapy | cisplatin | SD | |
| DAPP1 | SNV | Missense_Mutation | novel | c.702C>G | p.Phe234Leu | p.F234L | Q9UN19 | protein_coding | tolerated(0.67) | benign(0) | TCGA-VS-A8QC-01 | Cervix | cervical & endocervical cancer | Female | <65 | I/II | Chemotherapy | paclitaxel | PD |
| DAPP1 | SNV | Missense_Mutation | novel | c.569N>T | p.Arg190Met | p.R190M | Q9UN19 | protein_coding | deleterious(0) | probably_damaging(0.949) | TCGA-AA-3845-01 | Colorectum | colon adenocarcinoma | Female | >=65 | I/II | Unknown | Unknown | PD |
| DAPP1 | SNV | Missense_Mutation | rs745769238 | c.655N>A | p.Asp219Asn | p.D219N | Q9UN19 | protein_coding | deleterious(0) | probably_damaging(0.997) | TCGA-AA-3984-01 | Colorectum | colon adenocarcinoma | Female | <65 | I/II | Unknown | Unknown | SD |
| DAPP1 | SNV | Missense_Mutation | c.232N>T | p.Asp78Tyr | p.D78Y | Q9UN19 | protein_coding | deleterious(0) | probably_damaging(0.947) | TCGA-AA-A010-01 | Colorectum | colon adenocarcinoma | Female | <65 | I/II | Chemotherapy | folinic | CR | |
| DAPP1 | SNV | Missense_Mutation | novel | c.756N>T | p.Lys252Asn | p.K252N | Q9UN19 | protein_coding | deleterious(0.01) | probably_damaging(0.933) | TCGA-AZ-4315-01 | Colorectum | colon adenocarcinoma | Male | <65 | I/II | Unknown | Unknown | SD |
| Page: 1 2 3 4 |
Top |
Related drugs of malignant transformation related genes |
| Identification of chemicals and drugs interact with genes involved in malignant transfromation |
| (DGIdb 4.0) |
| Entrez ID | Symbol | Category | Interaction Types | Drug Claim Name | Drug Name | PMIDs |
| Page: 1 |

Copyright 2023-Present -The University of Texas Health Science Center at Houston |