
|
|||||
|
 | |
| |
| |
| |
| |
| |
|
Gene: DAPL1 |
Gene summary for DAPL1 |
| Gene information | Species | Human | Gene symbol | DAPL1 | Gene ID | 92196 |
| Gene name | death associated protein like 1 | |
| Gene Alias | DAPL1 | |
| Cytomap | 2q24.1 | |
| Gene Type | protein-coding | GO ID | GO:0006914 | UniProtAcc | A0PJW8 |
Top |
Malignant transformation analysis |
| Identification of the aberrant gene expression in precancerous and cancerous lesions by comparing the gene expression of stem-like cells in diseased tissues with normal stem cells |
| Entrez ID | Symbol | Replicates | Species | Organ | Tissue | Adj P-value | Log2FC | Malignancy |
| 92196 | DAPL1 | CA_HPV_1 | Human | Cervix | CC | 2.76e-13 | -4.72e-01 | 0.0264 |
| 92196 | DAPL1 | CA_HPV_3 | Human | Cervix | CC | 5.98e-03 | 3.34e-01 | 0.0414 |
| 92196 | DAPL1 | HSIL_HPV_2 | Human | Cervix | HSIL_HPV | 7.25e-04 | -3.41e-01 | 0.0208 |
| 92196 | DAPL1 | N_HPV_1 | Human | Cervix | N_HPV | 3.68e-03 | -3.56e-01 | 0.0079 |
| 92196 | DAPL1 | CCI_2 | Human | Cervix | CC | 4.51e-04 | -5.04e-01 | 0.5249 |
| 92196 | DAPL1 | CCI_3 | Human | Cervix | CC | 1.96e-04 | -4.88e-01 | 0.516 |
| 92196 | DAPL1 | CCII_1 | Human | Cervix | CC | 8.01e-10 | -5.04e-01 | 0.3249 |
| 92196 | DAPL1 | sample1 | Human | Cervix | CC | 1.61e-05 | -4.87e-01 | 0.0959 |
| 92196 | DAPL1 | sample3 | Human | Cervix | CC | 4.57e-04 | -3.69e-01 | 0.1387 |
| 92196 | DAPL1 | H2 | Human | Cervix | HSIL_HPV | 1.99e-09 | -4.10e-01 | 0.0632 |
| 92196 | DAPL1 | L1 | Human | Cervix | CC | 5.50e-03 | -3.63e-01 | 0.0802 |
| 92196 | DAPL1 | T1 | Human | Cervix | CC | 6.87e-14 | -4.85e-01 | 0.0918 |
| 92196 | DAPL1 | T2 | Human | Cervix | CC | 9.25e-04 | -5.04e-01 | 0.0709 |
| 92196 | DAPL1 | T3 | Human | Cervix | CC | 2.74e-06 | -3.79e-01 | 0.1389 |
| 92196 | DAPL1 | LZE4T | Human | Esophagus | ESCC | 1.50e-19 | 1.87e+00 | 0.0811 |
| 92196 | DAPL1 | LZE8T | Human | Esophagus | ESCC | 1.66e-03 | -2.36e-01 | 0.067 |
| 92196 | DAPL1 | LZE21D1 | Human | Esophagus | HGIN | 3.19e-05 | 1.12e+00 | 0.0632 |
| 92196 | DAPL1 | LZE21T | Human | Esophagus | ESCC | 1.55e-04 | 1.10e+00 | 0.0655 |
| 92196 | DAPL1 | LZE6T | Human | Esophagus | ESCC | 9.83e-03 | -5.04e-01 | 0.0845 |
| 92196 | DAPL1 | P2T-E | Human | Esophagus | ESCC | 3.73e-03 | 2.90e-01 | 0.1177 |
| Page: 1 2 3 4 5 6 |
| Tissue | Expression Dynamics | Abbreviation |
| Cervix | 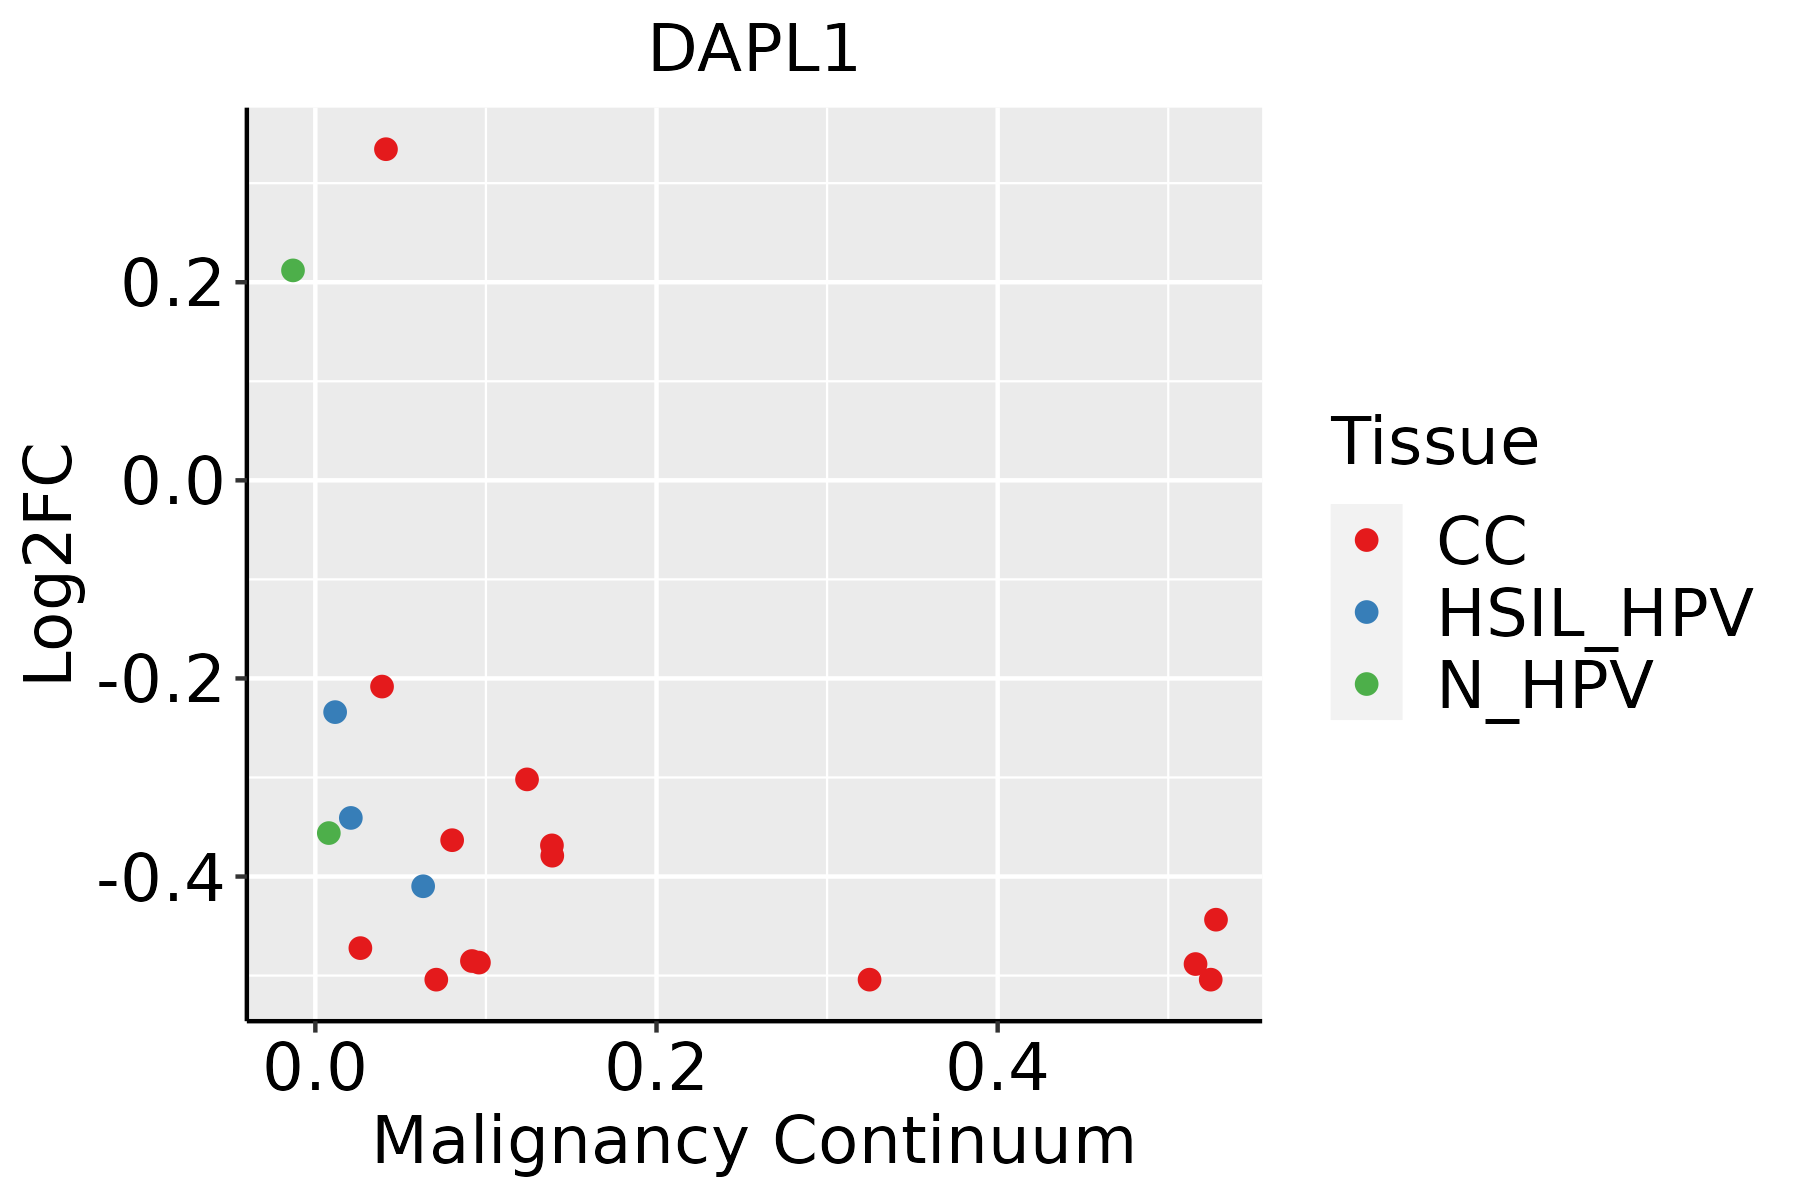 | CC: Cervix cancer |
| HSIL_HPV: HPV-infected high-grade squamous intraepithelial lesions | ||
| N_HPV: HPV-infected normal cervix | ||
| Esophagus | 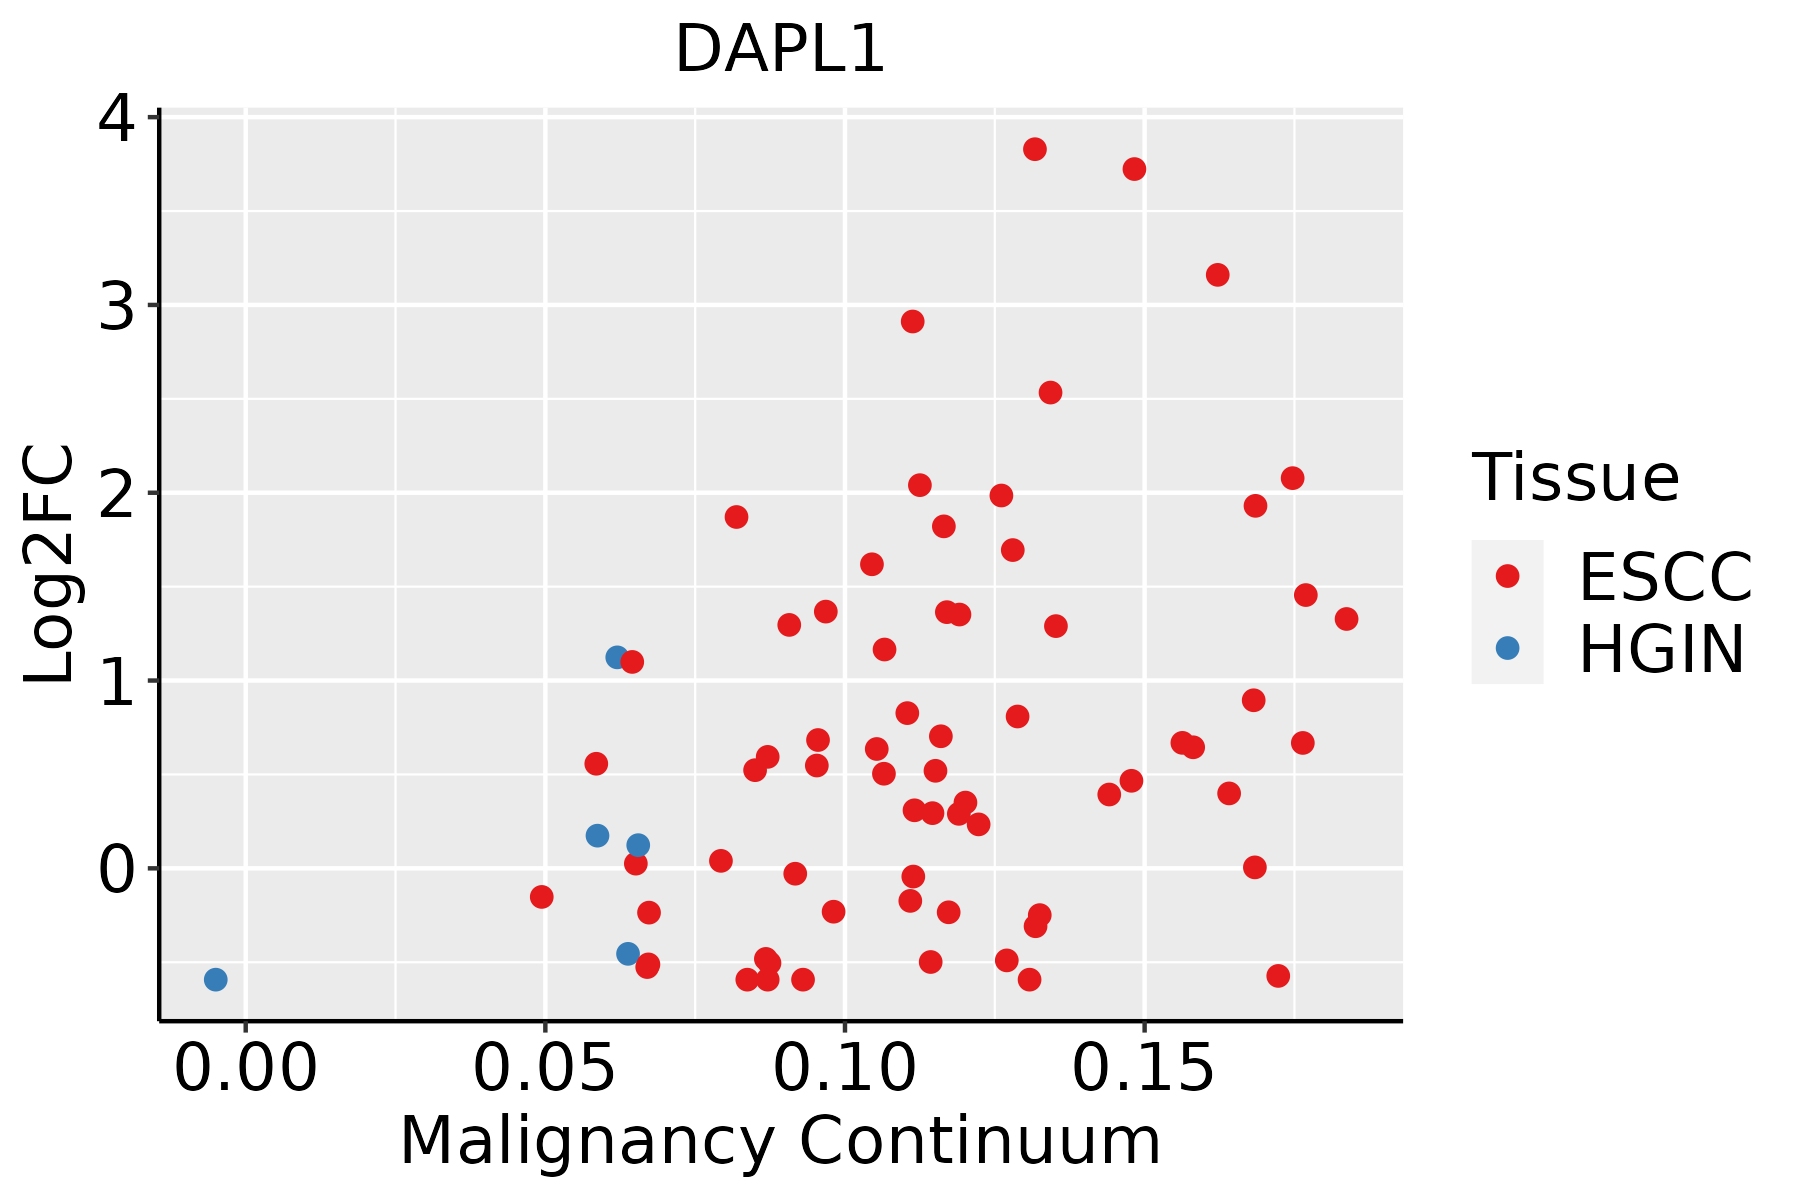 | ESCC: Esophageal squamous cell carcinoma |
| HGIN: High-grade intraepithelial neoplasias | ||
| LGIN: Low-grade intraepithelial neoplasias | ||
| Oral Cavity |  | EOLP: Erosive Oral lichen planus |
| LP: leukoplakia | ||
| NEOLP: Non-erosive oral lichen planus | ||
| OSCC: Oral squamous cell carcinoma | ||
| Prostate | 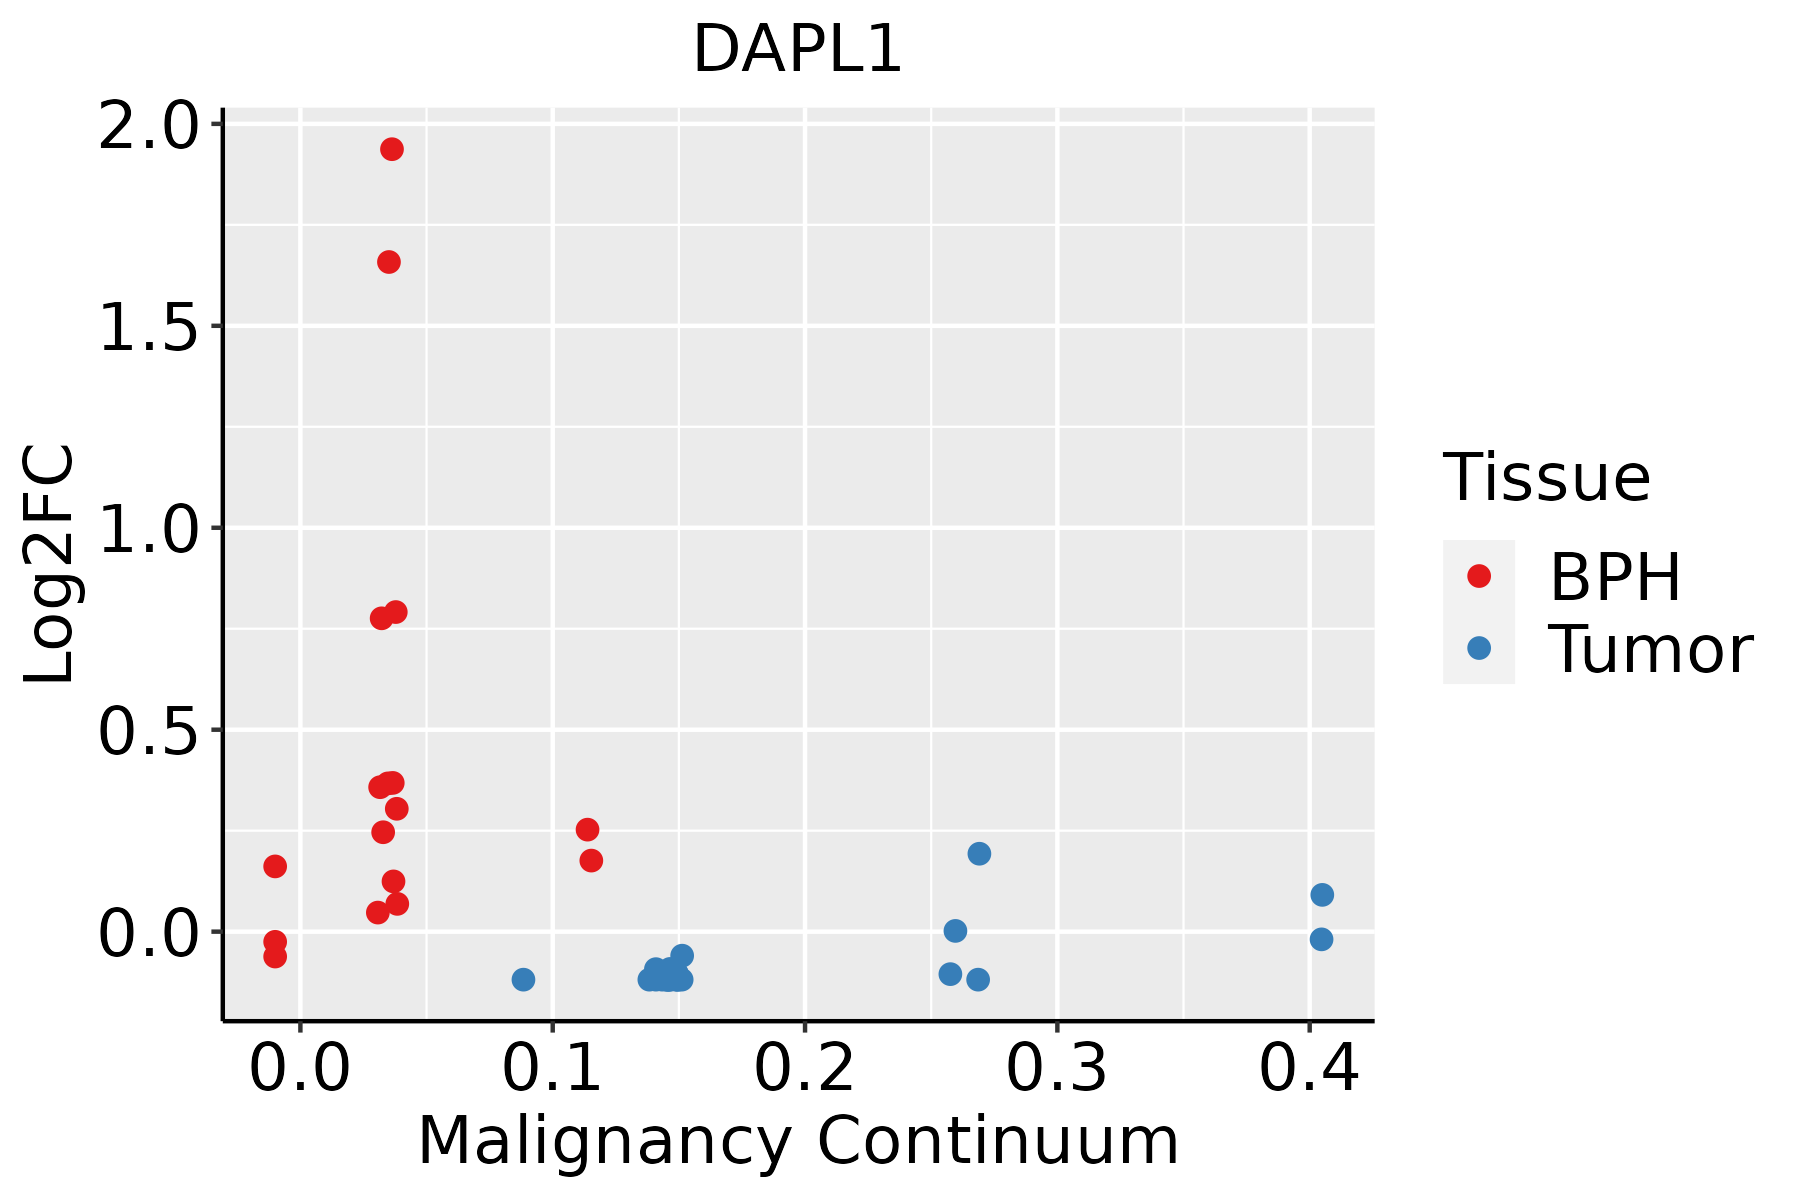 | BPH: Benign Prostatic Hyperplasia |
| Skin | 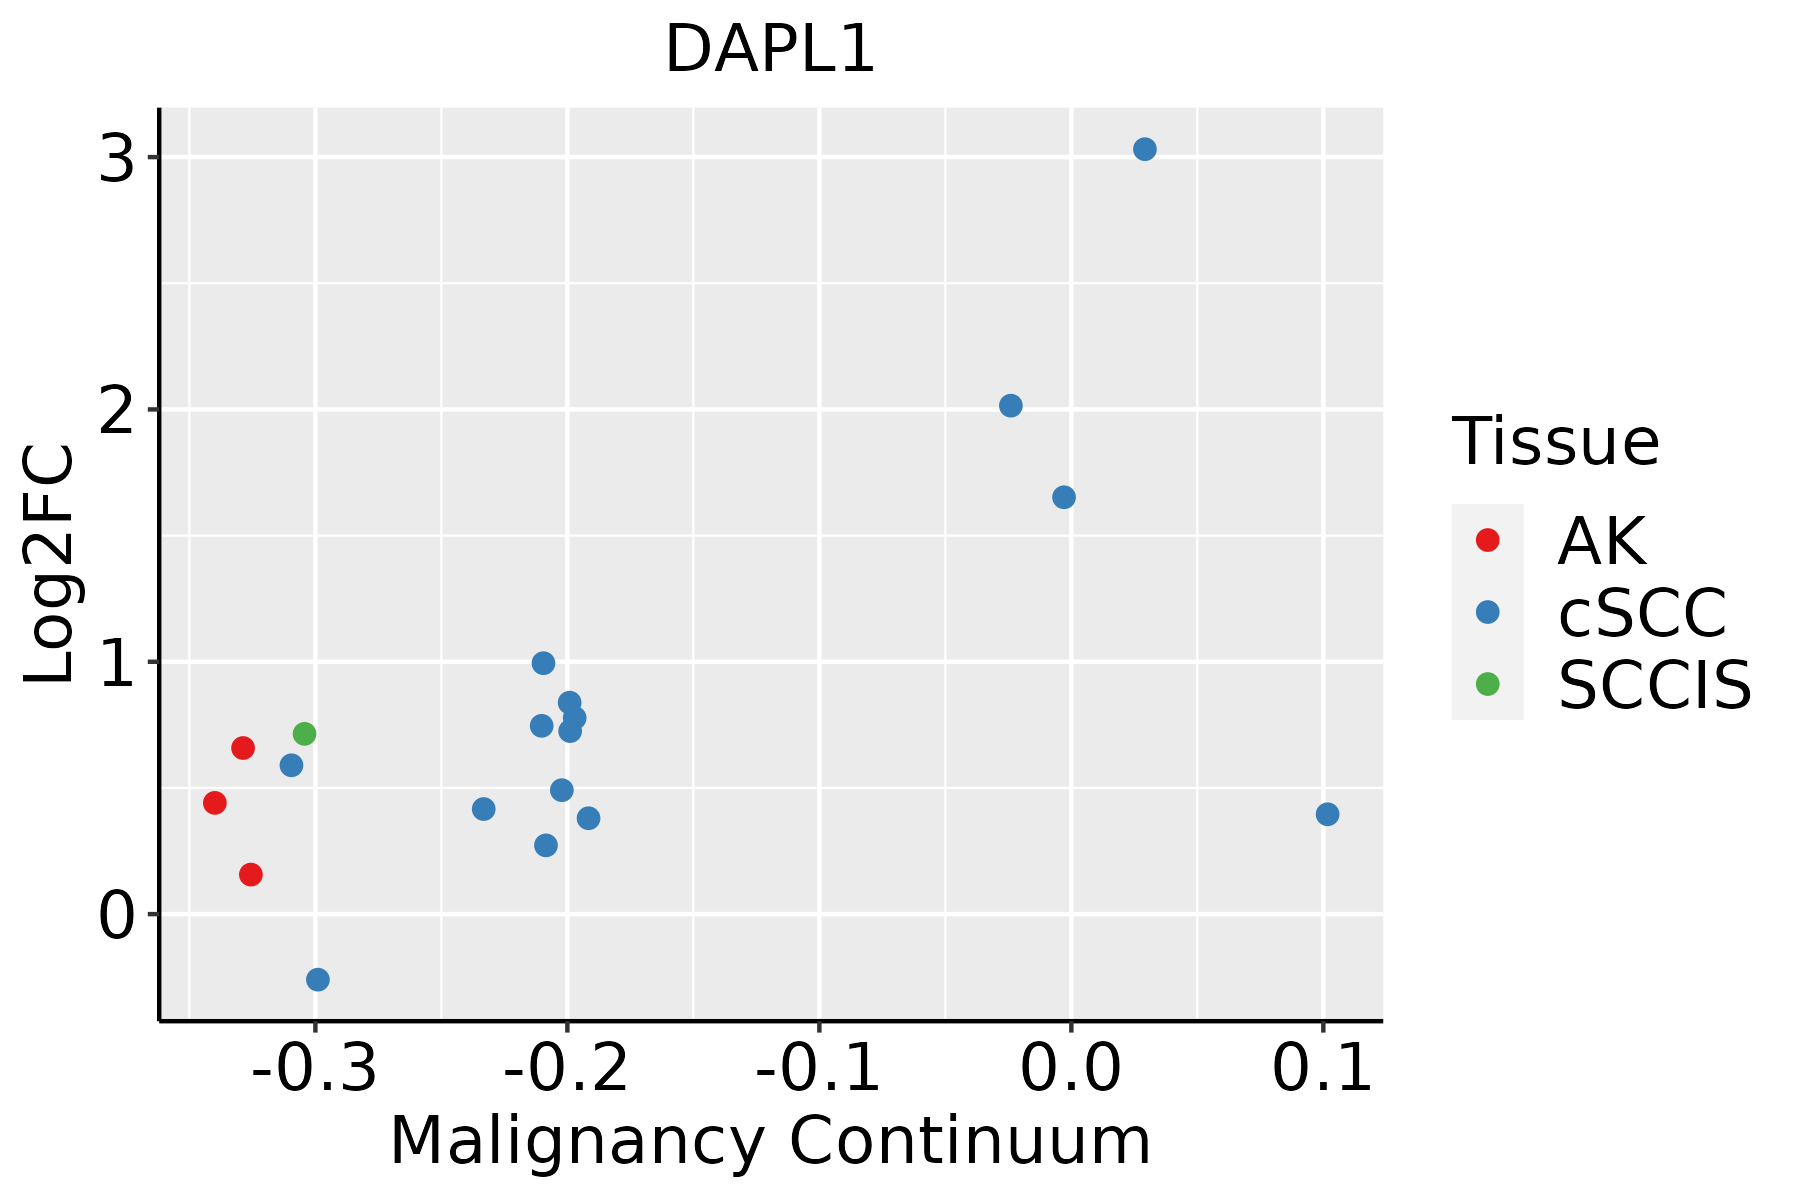 | AK: Actinic keratosis |
| cSCC: Cutaneous squamous cell carcinoma | ||
| SCCIS:squamous cell carcinoma in situ | ||
| Thyroid | 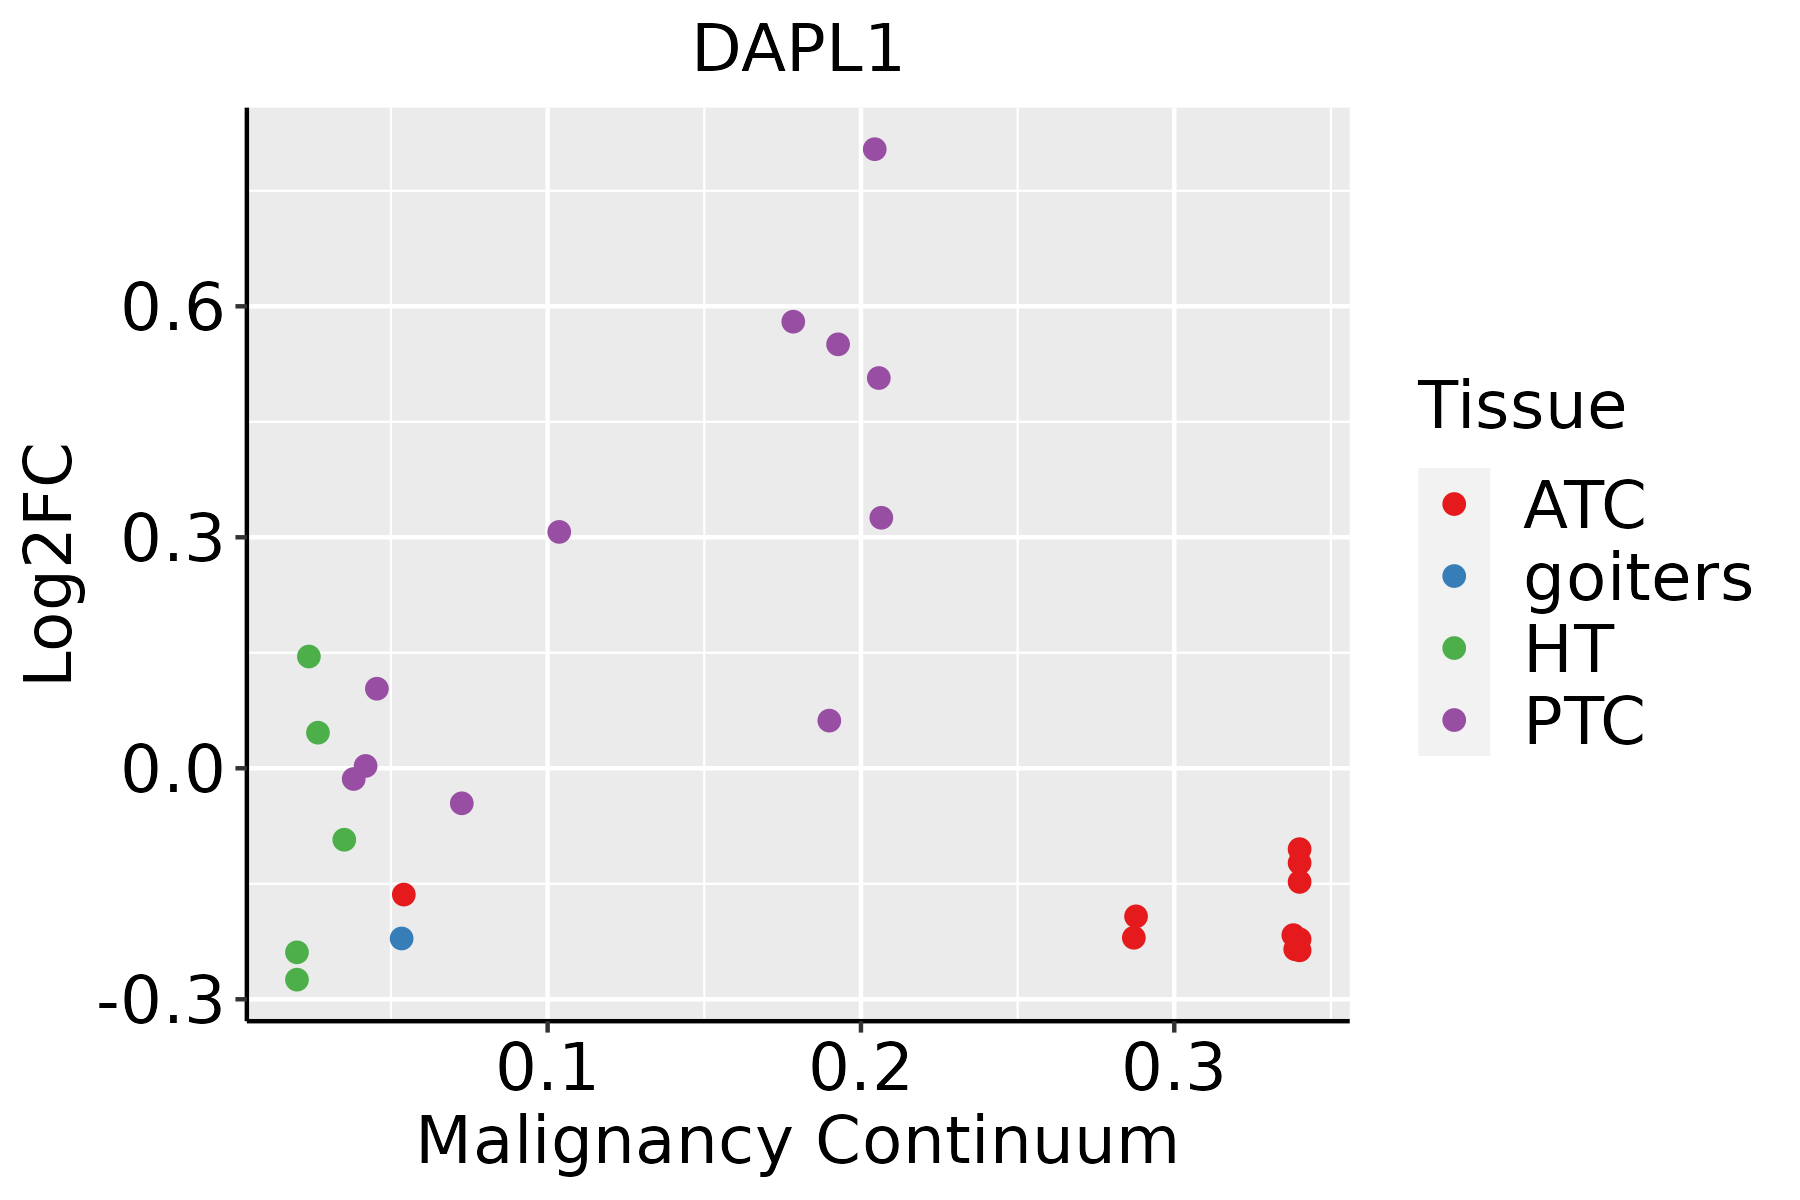 | ATC: Anaplastic thyroid cancer |
| HT: Hashimoto's thyroiditis | ||
| PTC: Papillary thyroid cancer |
| ∗log2FC in expression of this searched gene in stem-like cells from each diseased tissue sample relative to stem-like cells in normal samples in each tissue plotted against the malignancy continuum. Samples are colored based on if they are from different disease stage. |
Top |
Malignant transformation related pathway analysis |
| Find out the enriched GO biological processes and KEGG pathways involved in transition from healthy to precancer to cancer |
| Tissue | Disease Stage | Enriched GO biological Processes |
| Colorectum | AD |  |
| Colorectum | SER |  |
| Colorectum | MSS |  |
| Colorectum | MSI-H |  |
| Colorectum | FAP |  |
| ∗Top 15 enriched GO BP terms are showed in the bar plot of each disease state in each tissue. Each row represents a significant GO biological process which is colored according to the -log10(p.adjust). |
| Page: 1 2 3 4 5 6 7 8 9 |
| GO ID | Tissue | Disease Stage | Description | Gene Ratio | Bg Ratio | pvalue | p.adjust | Count |
| GO:007149610 | Cervix | CC | cellular response to external stimulus | 78/2311 | 320/18723 | 1.82e-09 | 1.98e-07 | 78 |
| GO:003133010 | Cervix | CC | negative regulation of cellular catabolic process | 63/2311 | 262/18723 | 1.10e-07 | 5.68e-06 | 63 |
| GO:00316689 | Cervix | CC | cellular response to extracellular stimulus | 59/2311 | 246/18723 | 3.03e-07 | 1.24e-05 | 59 |
| GO:000989510 | Cervix | CC | negative regulation of catabolic process | 69/2311 | 320/18723 | 2.15e-06 | 6.55e-05 | 69 |
| GO:003166710 | Cervix | CC | response to nutrient levels | 92/2311 | 474/18723 | 5.80e-06 | 1.42e-04 | 92 |
| GO:00092678 | Cervix | CC | cellular response to starvation | 39/2311 | 156/18723 | 1.04e-05 | 2.32e-04 | 39 |
| GO:00425948 | Cervix | CC | response to starvation | 46/2311 | 197/18723 | 1.24e-05 | 2.59e-04 | 46 |
| GO:00316698 | Cervix | CC | cellular response to nutrient levels | 49/2311 | 215/18723 | 1.32e-05 | 2.68e-04 | 49 |
| GO:00105067 | Cervix | CC | regulation of autophagy | 61/2311 | 317/18723 | 2.61e-04 | 2.87e-03 | 61 |
| GO:007149615 | Cervix | HSIL_HPV | cellular response to external stimulus | 26/737 | 320/18723 | 4.09e-04 | 6.25e-03 | 26 |
| GO:003166715 | Cervix | HSIL_HPV | response to nutrient levels | 32/737 | 474/18723 | 2.22e-03 | 2.25e-02 | 32 |
| GO:007149624 | Cervix | N_HPV | cellular response to external stimulus | 23/534 | 320/18723 | 5.03e-05 | 1.15e-03 | 23 |
| GO:003166724 | Cervix | N_HPV | response to nutrient levels | 29/534 | 474/18723 | 1.04e-04 | 2.08e-03 | 29 |
| GO:003166815 | Cervix | N_HPV | cellular response to extracellular stimulus | 18/534 | 246/18723 | 2.60e-04 | 4.13e-03 | 18 |
| GO:003166915 | Cervix | N_HPV | cellular response to nutrient levels | 15/534 | 215/18723 | 1.34e-03 | 1.45e-02 | 15 |
| GO:003133015 | Cervix | N_HPV | negative regulation of cellular catabolic process | 16/534 | 262/18723 | 3.63e-03 | 2.91e-02 | 16 |
| GO:004259413 | Cervix | N_HPV | response to starvation | 13/534 | 197/18723 | 4.39e-03 | 3.33e-02 | 13 |
| GO:000926714 | Cervix | N_HPV | cellular response to starvation | 11/534 | 156/18723 | 5.20e-03 | 3.80e-02 | 11 |
| GO:000989520 | Esophagus | HGIN | negative regulation of catabolic process | 87/2587 | 320/18723 | 1.74e-10 | 1.68e-08 | 87 |
| GO:003133026 | Esophagus | HGIN | negative regulation of cellular catabolic process | 74/2587 | 262/18723 | 6.27e-10 | 5.30e-08 | 74 |
| Page: 1 2 3 4 5 6 7 8 |
| Pathway ID | Tissue | Disease Stage | Description | Gene Ratio | Bg Ratio | pvalue | p.adjust | qvalue | Count |
| Page: 1 |
Top |
Cell-cell communication analysis |
| Identification of potential cell-cell interactions between two cell types and their ligand-receptor pairs for different disease states |
| Ligand | Receptor | LRpair | Pathway | Tissue | Disease Stage |
| Page: 1 |
Top |
Single-cell gene regulatory network inference analysis |
| Find out the significant the regulons (TFs) and the target genes of each regulon across cell types for different disease states |
| TF | Cell Type | Tissue | Disease Stage | Target Gene | RSS | Regulon Activity |
| ∗The dot plots of a searched regulon are shown for all cell subpopulations in each disease state of each tissue based on the regulon specific score inferred using pySCENIC and by calculating the average expression. |
| Page: 1 |
Top |
Somatic mutation of malignant transformation related genes |
| Annotation of somatic variants for genes involved in malignant transformation |
| Hugo Symbol | Variant Class | Variant Classification | dbSNP RS | HGVSc | HGVSp | HGVSp Short | SWISSPROT | BIOTYPE | SIFT | PolyPhen | Tumor Sample Barcode | Tissue | Histology | Sex | Age | Stage | Therapy Types | Drugs | Outcome |
| DAPL1 | SNV | Missense_Mutation | novel | c.218N>C | p.Asp74His | p.D74H | protein_coding | tolerated_low_confidence(0.21) | benign(0.003) | TCGA-JW-A5VL-01 | Cervix | cervical & endocervical cancer | Female | <65 | I/II | Unknown | Unknown | SD | |
| DAPL1 | SNV | Missense_Mutation | novel | c.263N>A | p.Ala88Asp | p.A88D | A0PJW8 | protein_coding | deleterious(0) | possibly_damaging(0.571) | TCGA-CA-6717-01 | Colorectum | colon adenocarcinoma | Male | <65 | I/II | Chemotherapy | oxaliplatin | CR |
| DAPL1 | SNV | Missense_Mutation | rs745794395 | c.314N>A | p.Arg105Gln | p.R105Q | A0PJW8 | protein_coding | deleterious(0.02) | benign(0.027) | TCGA-F5-6814-01 | Colorectum | rectum adenocarcinoma | Male | <65 | I/II | Unknown | Unknown | SD |
| DAPL1 | insertion | Frame_Shift_Ins | rs773376018 | c.120_121insA | p.Thr43AsnfsTer23 | p.T43Nfs*23 | A0PJW8 | protein_coding | TCGA-AA-3713-01 | Colorectum | colon adenocarcinoma | Male | >=65 | III/IV | Chemotherapy | 5-fluorouracil | PR | ||
| DAPL1 | SNV | Missense_Mutation | rs745794395 | c.314N>A | p.Arg105Gln | p.R105Q | A0PJW8 | protein_coding | deleterious(0.02) | benign(0.027) | TCGA-A5-A2K5-01 | Endometrium | uterine corpus endometrioid carcinoma | Female | >=65 | I/II | Unknown | Unknown | SD |
| DAPL1 | SNV | Missense_Mutation | rs745794395 | c.314N>A | p.Arg105Gln | p.R105Q | A0PJW8 | protein_coding | deleterious(0.02) | benign(0.027) | TCGA-B5-A11N-01 | Endometrium | uterine corpus endometrioid carcinoma | Female | >=65 | I/II | Unknown | Unknown | SD |
| DAPL1 | SNV | Missense_Mutation | rs775660380 | c.171A>G | p.Ile57Met | p.I57M | A0PJW8 | protein_coding | tolerated(1) | benign(0.005) | TCGA-55-A4DG-01 | Lung | lung adenocarcinoma | Male | >=65 | I/II | Unknown | Unknown | SD |
| DAPL1 | SNV | Missense_Mutation | novel | c.71N>A | p.Gly24Glu | p.G24E | A0PJW8 | protein_coding | deleterious(0.02) | possibly_damaging(0.744) | TCGA-21-1079-01 | Lung | lung squamous cell carcinoma | Male | >=65 | III/IV | Unknown | Unknown | PD |
| DAPL1 | insertion | Frame_Shift_Ins | novel | c.146_146+1insTGCCATTGCAAAT | p.Val54CysfsTer16 | p.V54Cfs*16 | A0PJW8 | protein_coding | TCGA-77-6845-01 | Lung | lung squamous cell carcinoma | Male | >=65 | I/II | Unknown | Unknown | SD | ||
| DAPL1 | SNV | Missense_Mutation | rs745794395 | c.314N>A | p.Arg105Gln | p.R105Q | A0PJW8 | protein_coding | deleterious(0.02) | benign(0.027) | TCGA-TN-A7HL-01 | Oral cavity | head & neck squamous cell carcinoma | Male | <65 | I/II | Chemotherapy | cisplatin | CR |
| Page: 1 2 |
Top |
Related drugs of malignant transformation related genes |
| Identification of chemicals and drugs interact with genes involved in malignant transfromation |
| (DGIdb 4.0) |
| Entrez ID | Symbol | Category | Interaction Types | Drug Claim Name | Drug Name | PMIDs |
| Page: 1 |

Copyright 2023-Present -The University of Texas Health Science Center at Houston |