
|
|||||
|
 | |
| |
| |
| |
| |
| |
|
Gene: DAPK3 |
Gene summary for DAPK3 |
| Gene information | Species | Human | Gene symbol | DAPK3 | Gene ID | 1613 |
| Gene name | death associated protein kinase 3 | |
| Gene Alias | DLK | |
| Cytomap | 19p13.3 | |
| Gene Type | protein-coding | GO ID | GO:0000278 | UniProtAcc | B3KNJ3 |
Top |
Malignant transformation analysis |
| Identification of the aberrant gene expression in precancerous and cancerous lesions by comparing the gene expression of stem-like cells in diseased tissues with normal stem cells |
| Entrez ID | Symbol | Replicates | Species | Organ | Tissue | Adj P-value | Log2FC | Malignancy |
| 1613 | DAPK3 | HTA11_3410_2000001011 | Human | Colorectum | AD | 1.34e-22 | 6.15e-01 | 0.0155 |
| 1613 | DAPK3 | HTA11_2487_2000001011 | Human | Colorectum | SER | 9.27e-18 | 6.49e-01 | -0.1808 |
| 1613 | DAPK3 | HTA11_2951_2000001011 | Human | Colorectum | AD | 3.91e-08 | 8.20e-01 | 0.0216 |
| 1613 | DAPK3 | HTA11_1938_2000001011 | Human | Colorectum | AD | 2.08e-35 | 1.05e+00 | -0.0811 |
| 1613 | DAPK3 | HTA11_78_2000001011 | Human | Colorectum | AD | 3.13e-02 | 2.80e-01 | -0.1088 |
| 1613 | DAPK3 | HTA11_347_2000001011 | Human | Colorectum | AD | 1.11e-18 | 5.44e-01 | -0.1954 |
| 1613 | DAPK3 | HTA11_411_2000001011 | Human | Colorectum | SER | 1.77e-07 | 1.06e+00 | -0.2602 |
| 1613 | DAPK3 | HTA11_2112_2000001011 | Human | Colorectum | SER | 3.67e-05 | 6.83e-01 | -0.2196 |
| 1613 | DAPK3 | HTA11_3361_2000001011 | Human | Colorectum | AD | 1.21e-22 | 8.03e-01 | -0.1207 |
| 1613 | DAPK3 | HTA11_83_2000001011 | Human | Colorectum | SER | 8.85e-14 | 6.70e-01 | -0.1526 |
| 1613 | DAPK3 | HTA11_696_2000001011 | Human | Colorectum | AD | 1.16e-50 | 1.18e+00 | -0.1464 |
| 1613 | DAPK3 | HTA11_866_2000001011 | Human | Colorectum | AD | 4.72e-20 | 5.49e-01 | -0.1001 |
| 1613 | DAPK3 | HTA11_1391_2000001011 | Human | Colorectum | AD | 2.52e-32 | 9.51e-01 | -0.059 |
| 1613 | DAPK3 | HTA11_2992_2000001011 | Human | Colorectum | SER | 1.71e-14 | 9.23e-01 | -0.1706 |
| 1613 | DAPK3 | HTA11_5212_2000001011 | Human | Colorectum | AD | 9.40e-11 | 7.01e-01 | -0.2061 |
| 1613 | DAPK3 | HTA11_5216_2000001011 | Human | Colorectum | SER | 2.33e-24 | 1.56e+00 | -0.1462 |
| 1613 | DAPK3 | HTA11_546_2000001011 | Human | Colorectum | AD | 1.90e-15 | 7.58e-01 | -0.0842 |
| 1613 | DAPK3 | HTA11_866_3004761011 | Human | Colorectum | AD | 2.77e-03 | 2.69e-01 | 0.096 |
| 1613 | DAPK3 | HTA11_7663_2000001011 | Human | Colorectum | SER | 6.52e-03 | 4.93e-01 | 0.0131 |
| 1613 | DAPK3 | HTA11_10711_2000001011 | Human | Colorectum | AD | 1.84e-02 | 2.54e-01 | 0.0338 |
| Page: 1 2 3 4 5 6 7 8 |
| Tissue | Expression Dynamics | Abbreviation |
| Colorectum (GSE201348) | 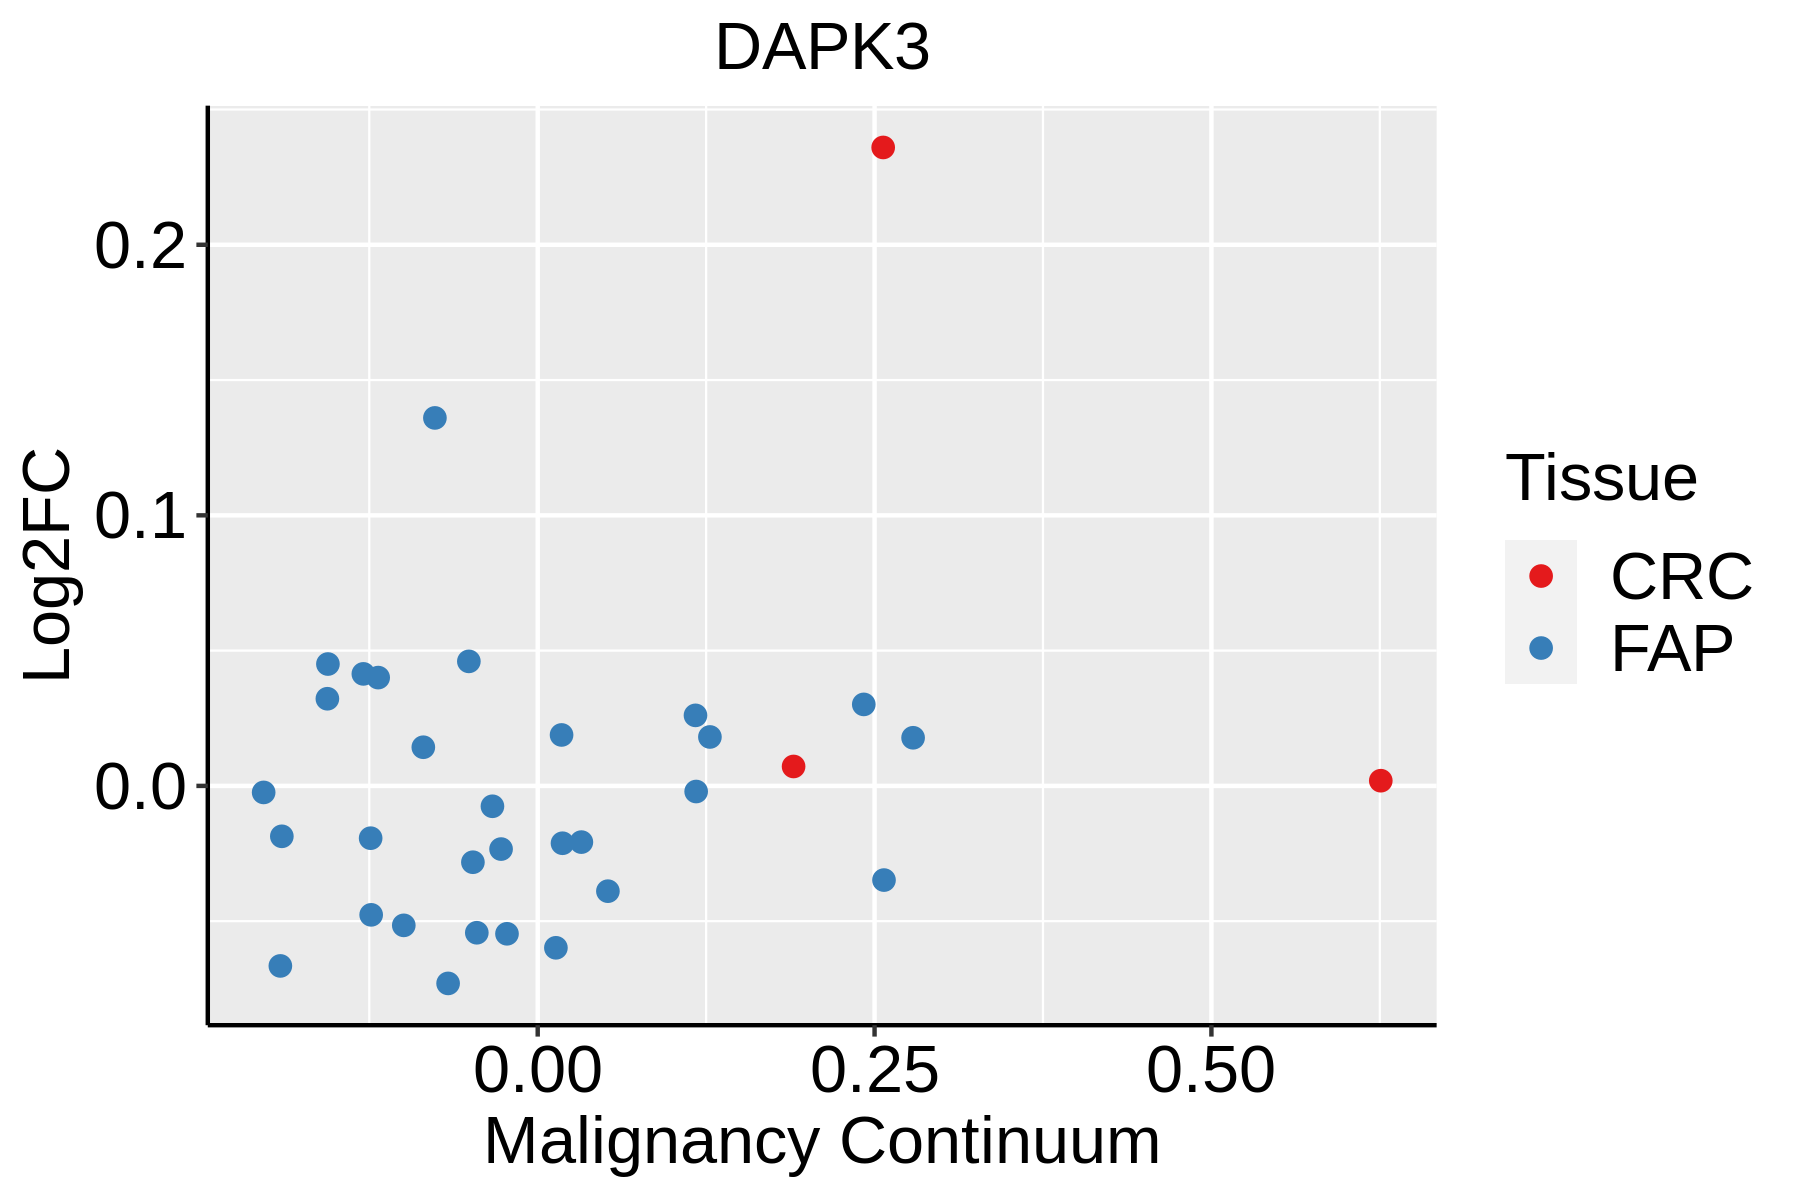 | FAP: Familial adenomatous polyposis |
| CRC: Colorectal cancer | ||
| Colorectum (HTA11) |  | AD: Adenomas |
| SER: Sessile serrated lesions | ||
| MSI-H: Microsatellite-high colorectal cancer | ||
| MSS: Microsatellite stable colorectal cancer | ||
| Esophagus |  | ESCC: Esophageal squamous cell carcinoma |
| HGIN: High-grade intraepithelial neoplasias | ||
| LGIN: Low-grade intraepithelial neoplasias | ||
| Liver |  | HCC: Hepatocellular carcinoma |
| NAFLD: Non-alcoholic fatty liver disease | ||
| Lung | 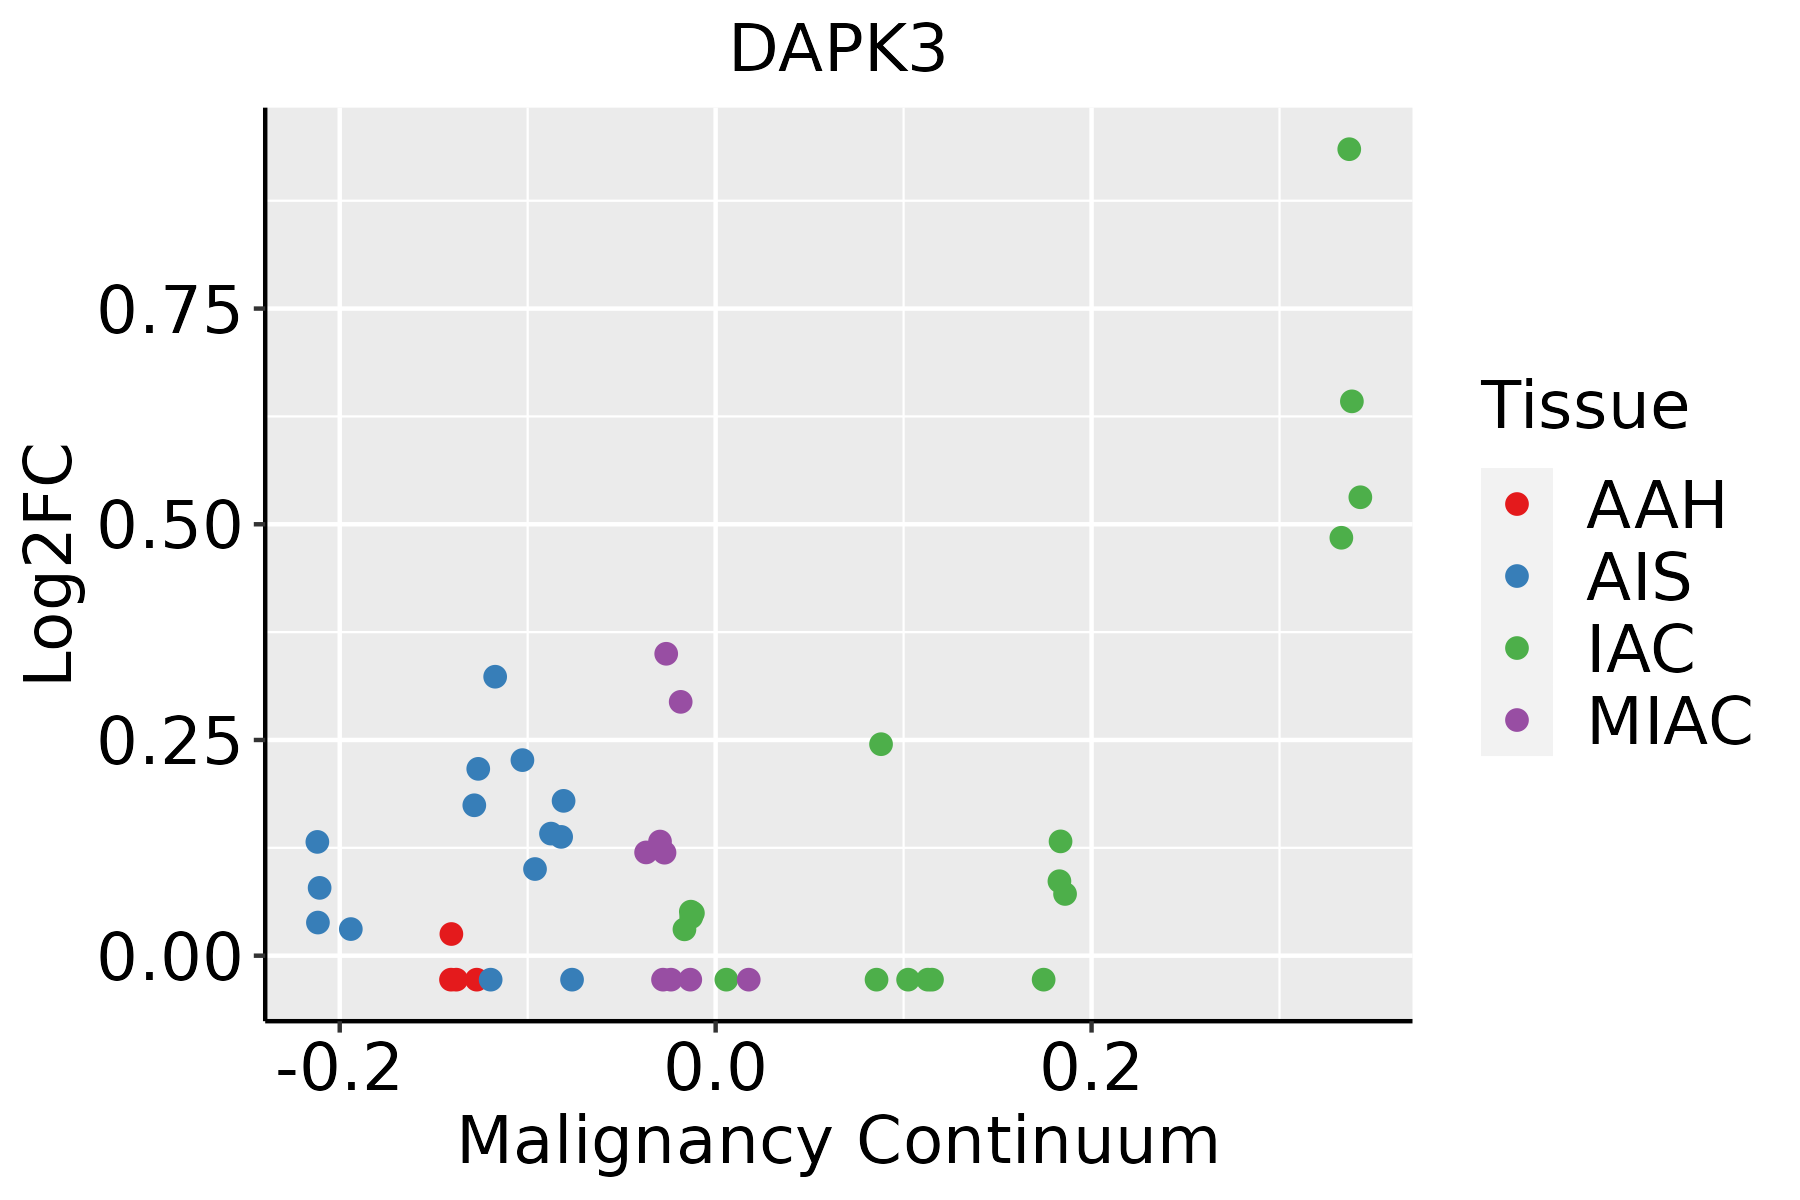 | AAH: Atypical adenomatous hyperplasia |
| AIS: Adenocarcinoma in situ | ||
| IAC: Invasive lung adenocarcinoma | ||
| MIA: Minimally invasive adenocarcinoma | ||
| Oral Cavity | 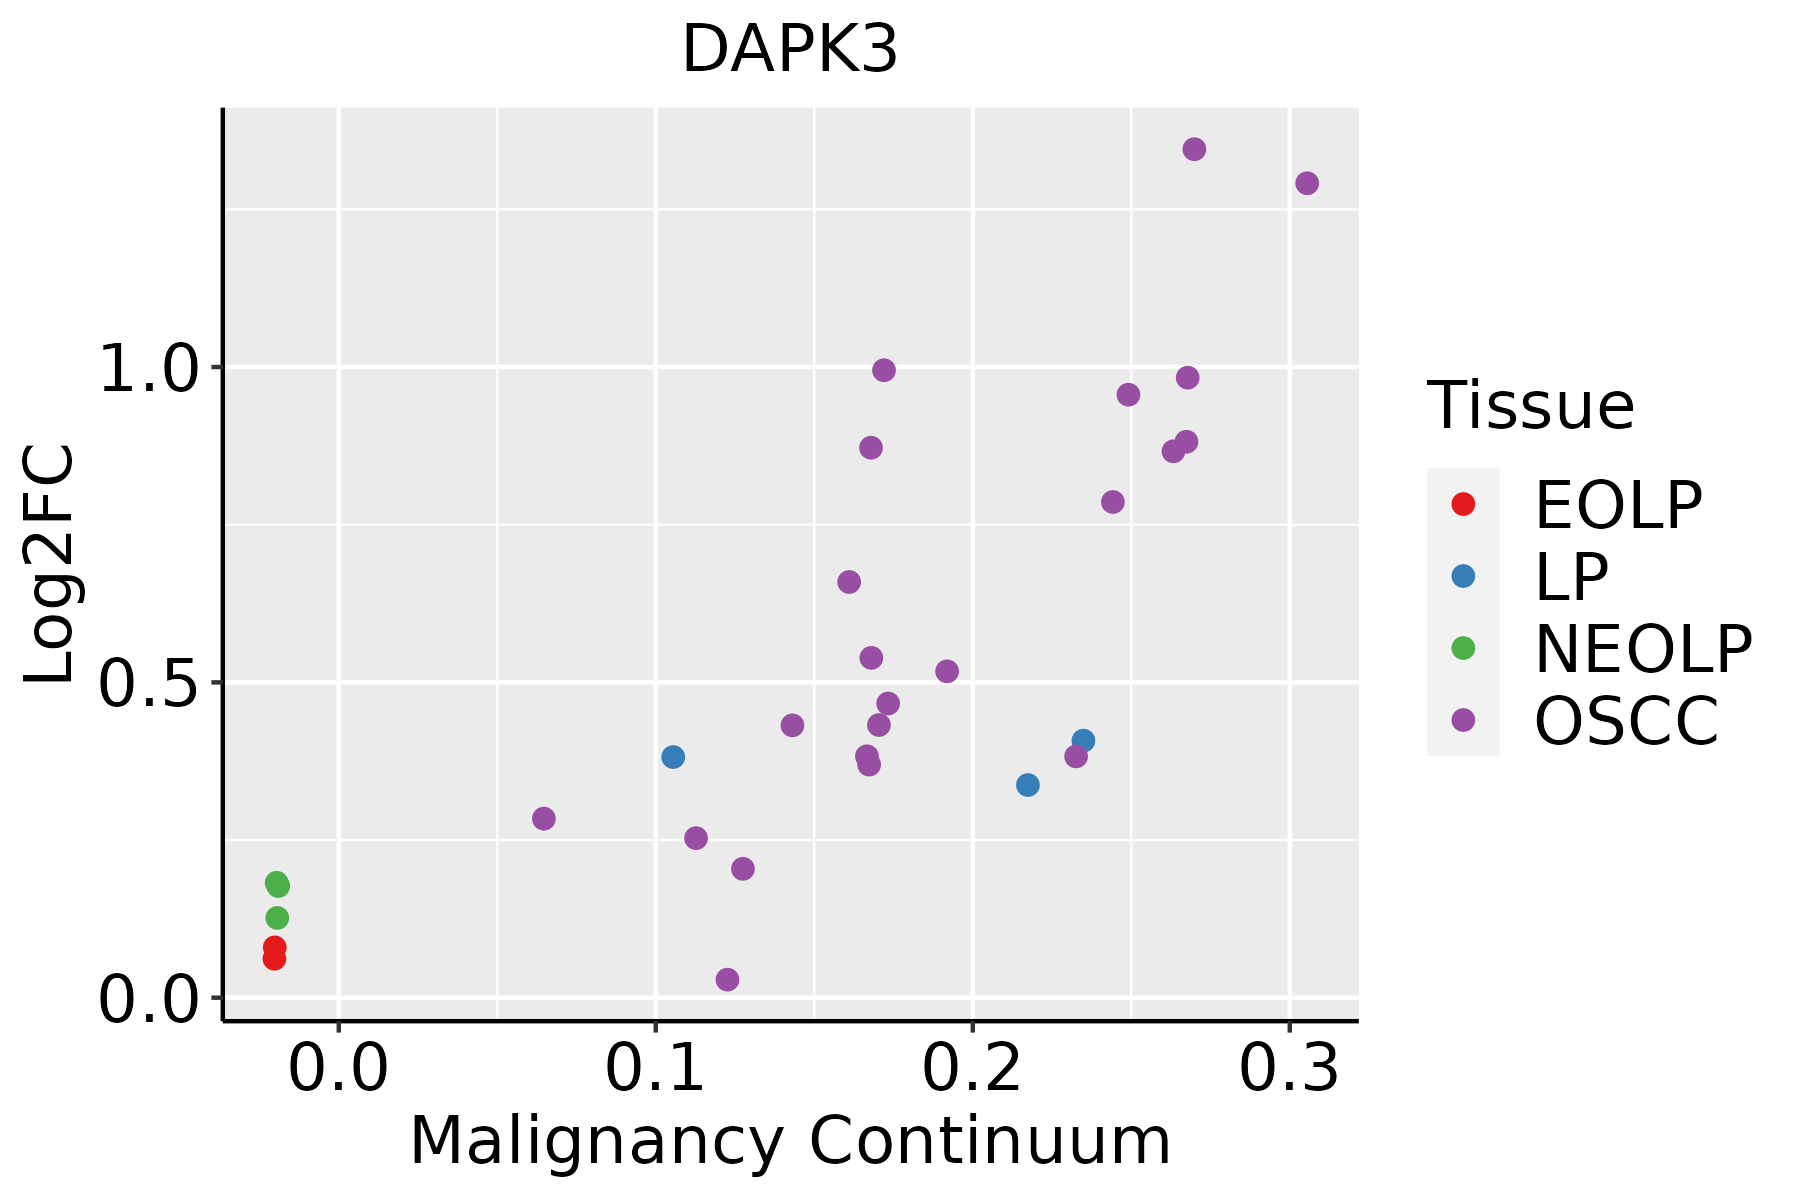 | EOLP: Erosive Oral lichen planus |
| LP: leukoplakia | ||
| NEOLP: Non-erosive oral lichen planus | ||
| OSCC: Oral squamous cell carcinoma | ||
| Skin | 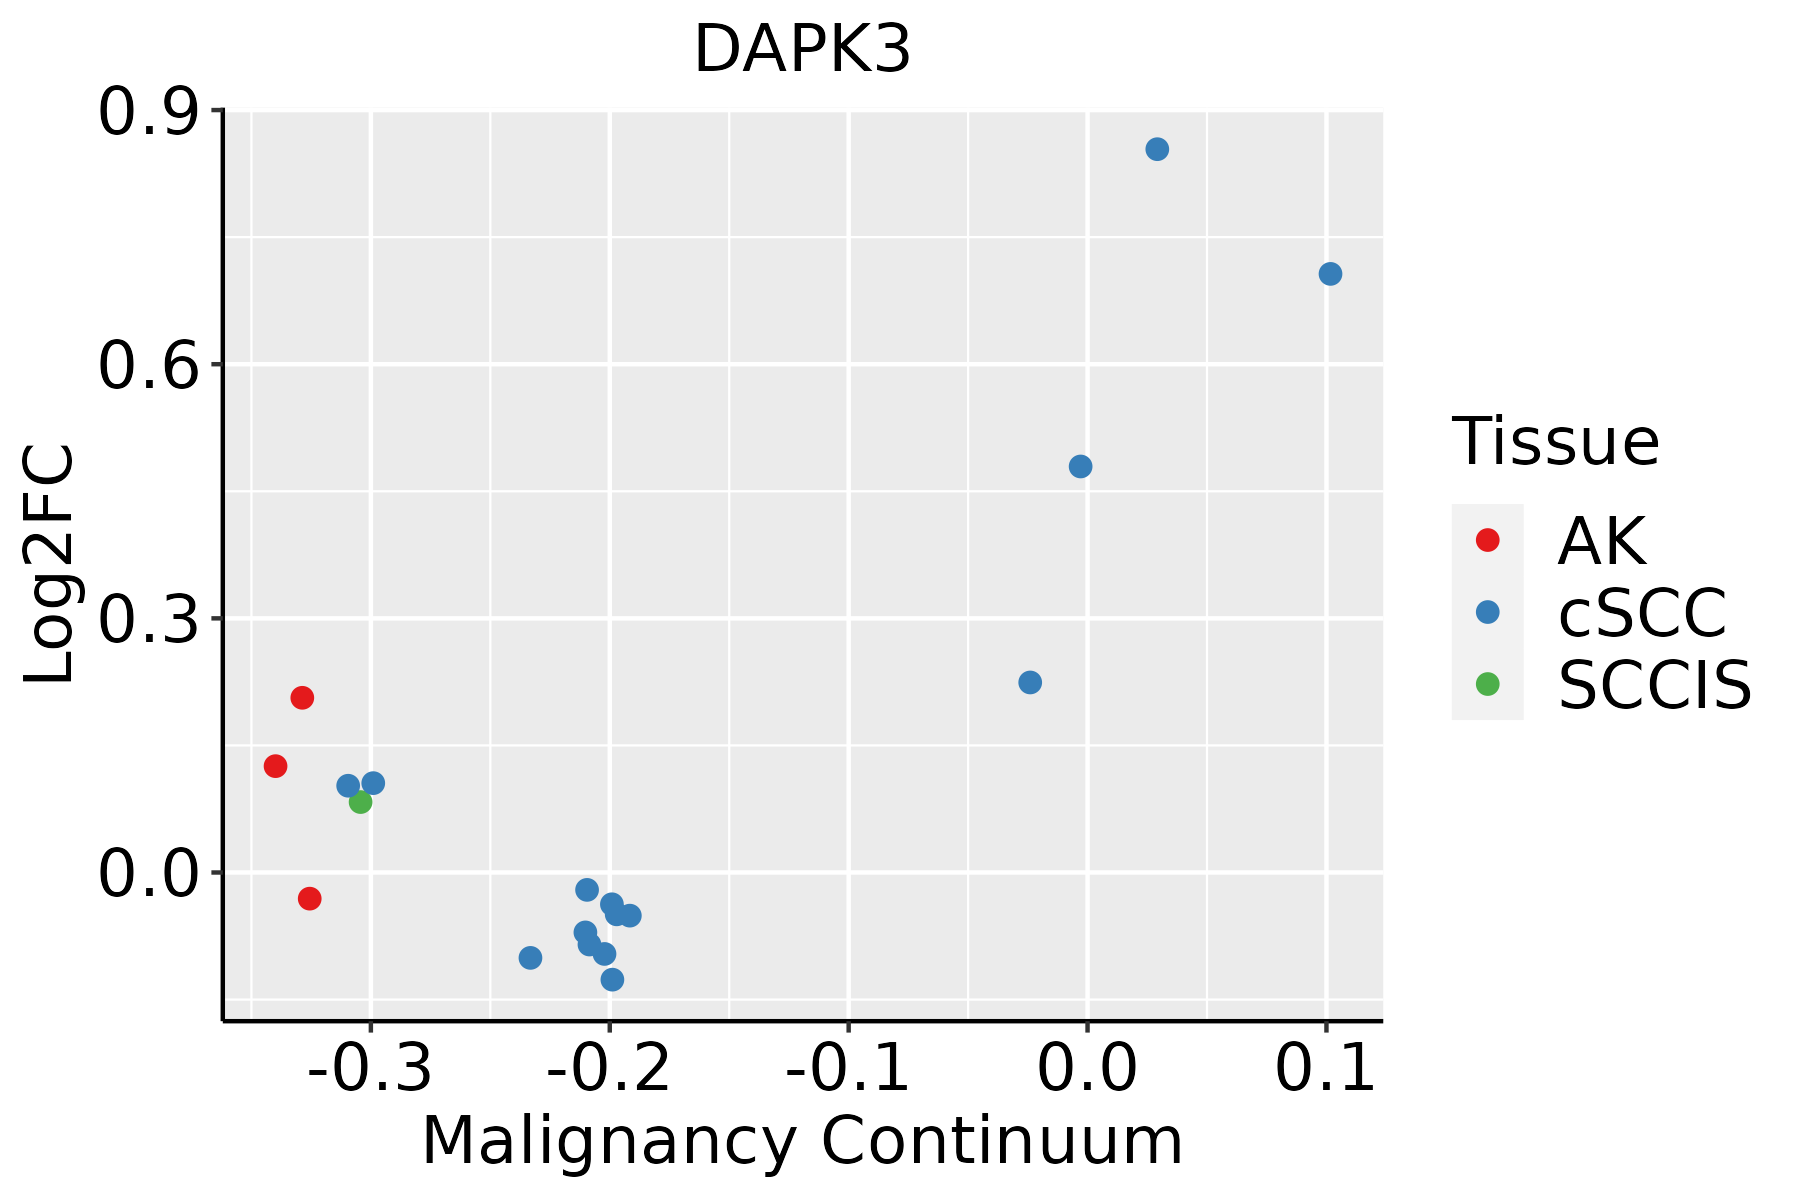 | AK: Actinic keratosis |
| cSCC: Cutaneous squamous cell carcinoma | ||
| SCCIS:squamous cell carcinoma in situ | ||
| Thyroid | 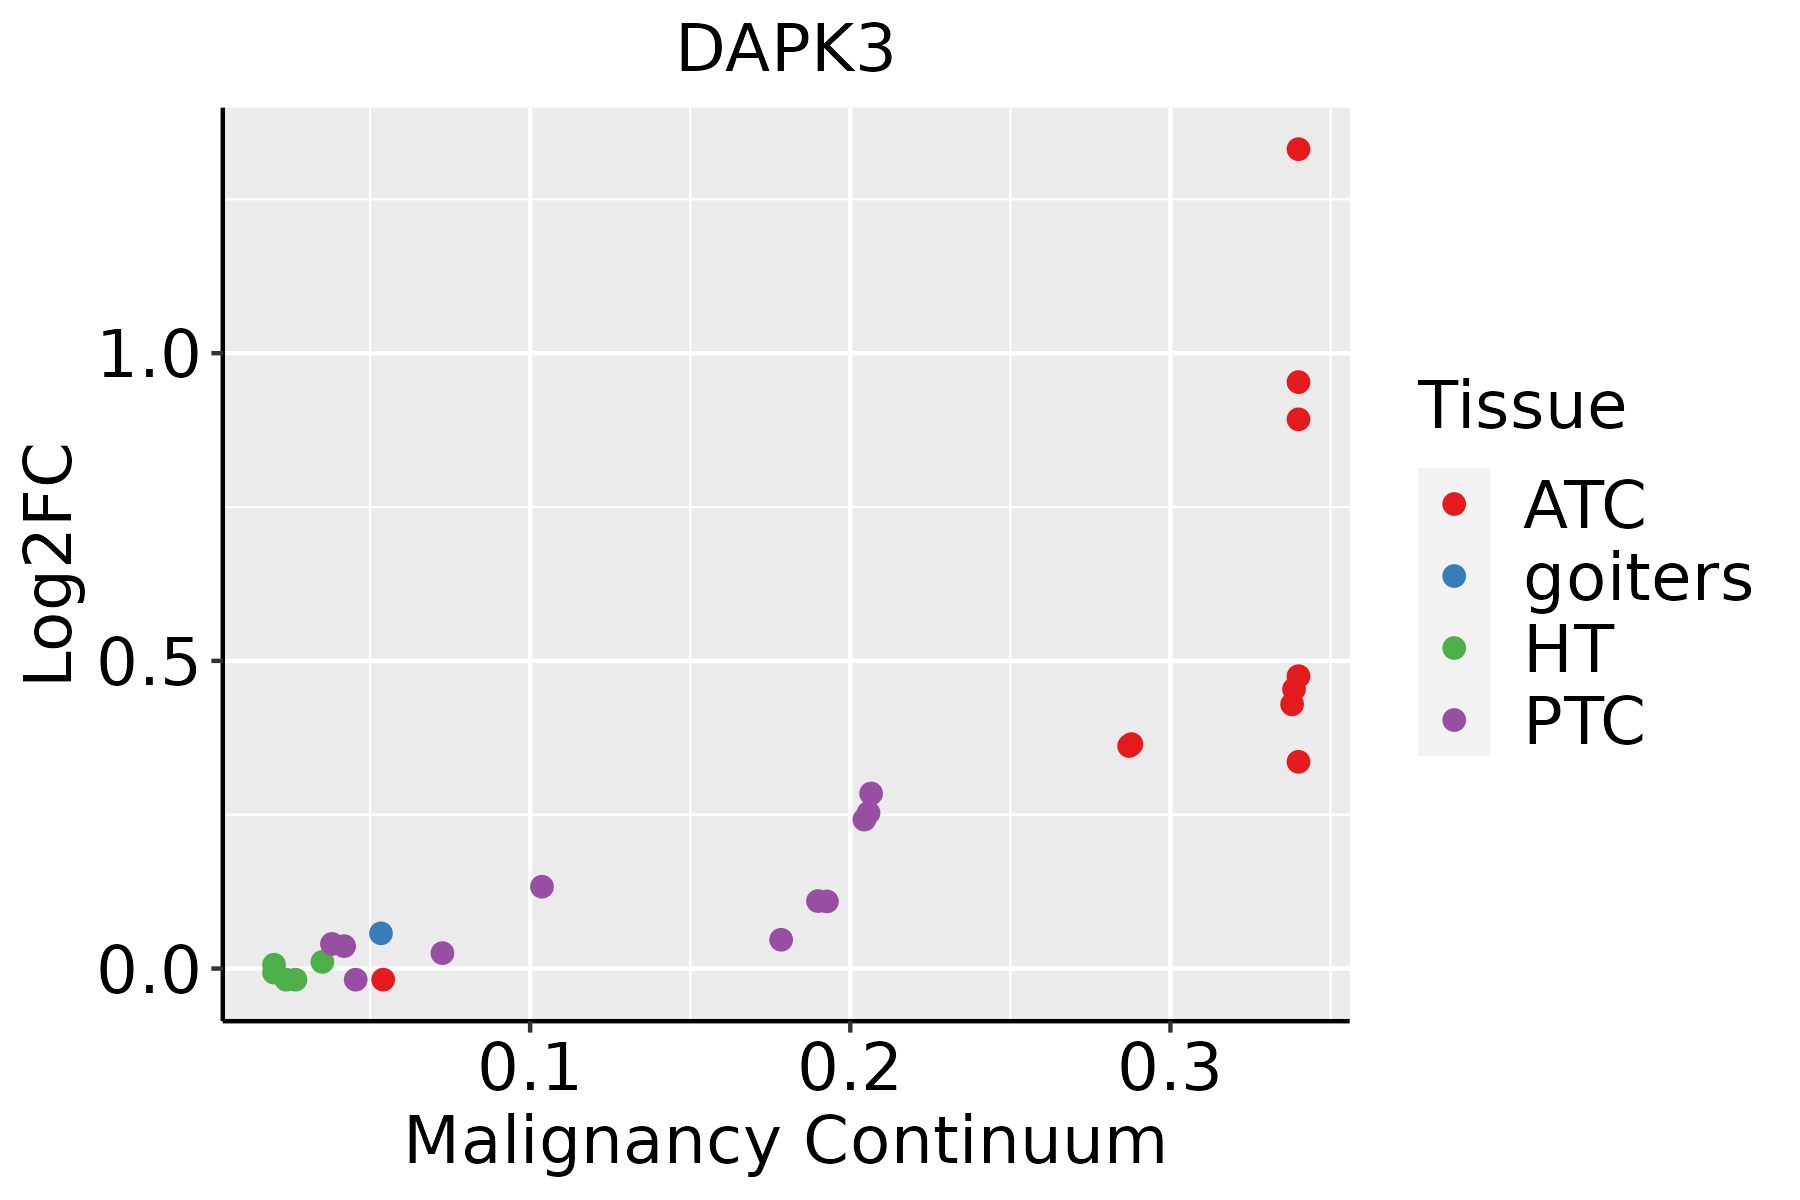 | ATC: Anaplastic thyroid cancer |
| HT: Hashimoto's thyroiditis | ||
| PTC: Papillary thyroid cancer |
| ∗log2FC in expression of this searched gene in stem-like cells from each diseased tissue sample relative to stem-like cells in normal samples in each tissue plotted against the malignancy continuum. Samples are colored based on if they are from different disease stage. |
Top |
Malignant transformation related pathway analysis |
| Find out the enriched GO biological processes and KEGG pathways involved in transition from healthy to precancer to cancer |
| Tissue | Disease Stage | Enriched GO biological Processes |
| Colorectum | AD |  |
| Colorectum | SER |  |
| Colorectum | MSS |  |
| Colorectum | MSI-H |  |
| Colorectum | FAP |  |
| ∗Top 15 enriched GO BP terms are showed in the bar plot of each disease state in each tissue. Each row represents a significant GO biological process which is colored according to the -log10(p.adjust). |
| Page: 1 2 3 4 5 6 7 8 9 |
| GO ID | Tissue | Disease Stage | Description | Gene Ratio | Bg Ratio | pvalue | p.adjust | Count |
| GO:1902903 | Colorectum | AD | regulation of supramolecular fiber organization | 139/3918 | 383/18723 | 2.01e-12 | 3.19e-10 | 139 |
| GO:0032970 | Colorectum | AD | regulation of actin filament-based process | 142/3918 | 397/18723 | 4.05e-12 | 5.90e-10 | 142 |
| GO:0032956 | Colorectum | AD | regulation of actin cytoskeleton organization | 127/3918 | 358/18723 | 1.03e-10 | 1.04e-08 | 127 |
| GO:0022604 | Colorectum | AD | regulation of cell morphogenesis | 109/3918 | 309/18723 | 3.08e-09 | 2.07e-07 | 109 |
| GO:0010506 | Colorectum | AD | regulation of autophagy | 111/3918 | 317/18723 | 3.57e-09 | 2.35e-07 | 111 |
| GO:0034329 | Colorectum | AD | cell junction assembly | 136/3918 | 420/18723 | 2.02e-08 | 1.15e-06 | 136 |
| GO:2001233 | Colorectum | AD | regulation of apoptotic signaling pathway | 119/3918 | 356/18723 | 2.14e-08 | 1.21e-06 | 119 |
| GO:0010810 | Colorectum | AD | regulation of cell-substrate adhesion | 81/3918 | 221/18723 | 4.80e-08 | 2.55e-06 | 81 |
| GO:0150115 | Colorectum | AD | cell-substrate junction organization | 44/3918 | 101/18723 | 2.38e-07 | 9.81e-06 | 44 |
| GO:0031589 | Colorectum | AD | cell-substrate adhesion | 116/3918 | 363/18723 | 4.68e-07 | 1.76e-05 | 116 |
| GO:0007044 | Colorectum | AD | cell-substrate junction assembly | 41/3918 | 95/18723 | 8.20e-07 | 2.85e-05 | 41 |
| GO:0006417 | Colorectum | AD | regulation of translation | 141/3918 | 468/18723 | 1.32e-06 | 4.22e-05 | 141 |
| GO:0001952 | Colorectum | AD | regulation of cell-matrix adhesion | 50/3918 | 128/18723 | 2.05e-06 | 6.05e-05 | 50 |
| GO:0008360 | Colorectum | AD | regulation of cell shape | 56/3918 | 154/18723 | 7.01e-06 | 1.73e-04 | 56 |
| GO:0030111 | Colorectum | AD | regulation of Wnt signaling pathway | 102/3918 | 328/18723 | 8.51e-06 | 2.03e-04 | 102 |
| GO:0016055 | Colorectum | AD | Wnt signaling pathway | 130/3918 | 444/18723 | 1.60e-05 | 3.37e-04 | 130 |
| GO:0198738 | Colorectum | AD | cell-cell signaling by wnt | 130/3918 | 446/18723 | 2.02e-05 | 4.10e-04 | 130 |
| GO:0046777 | Colorectum | AD | protein autophosphorylation | 74/3918 | 227/18723 | 2.48e-05 | 4.76e-04 | 74 |
| GO:0031532 | Colorectum | AD | actin cytoskeleton reorganization | 41/3918 | 107/18723 | 2.81e-05 | 5.28e-04 | 41 |
| GO:0007160 | Colorectum | AD | cell-matrix adhesion | 75/3918 | 233/18723 | 3.56e-05 | 6.45e-04 | 75 |
| Page: 1 2 3 4 5 6 7 8 9 10 11 12 13 14 15 16 17 18 19 20 21 22 23 24 25 26 27 |
| Pathway ID | Tissue | Disease Stage | Description | Gene Ratio | Bg Ratio | pvalue | p.adjust | qvalue | Count |
| hsa04140 | Colorectum | AD | Autophagy - animal | 49/2092 | 141/8465 | 4.58e-03 | 2.20e-02 | 1.40e-02 | 49 |
| hsa041401 | Colorectum | AD | Autophagy - animal | 49/2092 | 141/8465 | 4.58e-03 | 2.20e-02 | 1.40e-02 | 49 |
| hsa041402 | Colorectum | SER | Autophagy - animal | 39/1580 | 141/8465 | 5.43e-03 | 3.28e-02 | 2.38e-02 | 39 |
| hsa041403 | Colorectum | SER | Autophagy - animal | 39/1580 | 141/8465 | 5.43e-03 | 3.28e-02 | 2.38e-02 | 39 |
| hsa041404 | Colorectum | MSS | Autophagy - animal | 45/1875 | 141/8465 | 4.42e-03 | 1.90e-02 | 1.16e-02 | 45 |
| hsa041405 | Colorectum | MSS | Autophagy - animal | 45/1875 | 141/8465 | 4.42e-03 | 1.90e-02 | 1.16e-02 | 45 |
| hsa0414010 | Esophagus | ESCC | Autophagy - animal | 101/4205 | 141/8465 | 7.60e-08 | 6.21e-07 | 3.18e-07 | 101 |
| hsa0521910 | Esophagus | ESCC | Bladder cancer | 35/4205 | 41/8465 | 1.91e-06 | 1.15e-05 | 5.87e-06 | 35 |
| hsa0414015 | Esophagus | ESCC | Autophagy - animal | 101/4205 | 141/8465 | 7.60e-08 | 6.21e-07 | 3.18e-07 | 101 |
| hsa0521917 | Esophagus | ESCC | Bladder cancer | 35/4205 | 41/8465 | 1.91e-06 | 1.15e-05 | 5.87e-06 | 35 |
| hsa041406 | Liver | Cirrhotic | Autophagy - animal | 65/2530 | 141/8465 | 3.10e-05 | 2.47e-04 | 1.52e-04 | 65 |
| hsa052194 | Liver | Cirrhotic | Bladder cancer | 25/2530 | 41/8465 | 3.48e-05 | 2.57e-04 | 1.59e-04 | 25 |
| hsa0414011 | Liver | Cirrhotic | Autophagy - animal | 65/2530 | 141/8465 | 3.10e-05 | 2.47e-04 | 1.52e-04 | 65 |
| hsa0521911 | Liver | Cirrhotic | Bladder cancer | 25/2530 | 41/8465 | 3.48e-05 | 2.57e-04 | 1.59e-04 | 25 |
| hsa0414021 | Liver | HCC | Autophagy - animal | 99/4020 | 141/8465 | 3.08e-08 | 4.70e-07 | 2.61e-07 | 99 |
| hsa052192 | Liver | HCC | Bladder cancer | 30/4020 | 41/8465 | 7.37e-04 | 2.94e-03 | 1.63e-03 | 30 |
| hsa0414031 | Liver | HCC | Autophagy - animal | 99/4020 | 141/8465 | 3.08e-08 | 4.70e-07 | 2.61e-07 | 99 |
| hsa052193 | Liver | HCC | Bladder cancer | 30/4020 | 41/8465 | 7.37e-04 | 2.94e-03 | 1.63e-03 | 30 |
| hsa052195 | Lung | IAC | Bladder cancer | 13/1053 | 41/8465 | 9.74e-04 | 7.32e-03 | 4.86e-03 | 13 |
| hsa041407 | Lung | IAC | Autophagy - animal | 28/1053 | 141/8465 | 7.64e-03 | 3.03e-02 | 2.01e-02 | 28 |
| Page: 1 2 |
Top |
Cell-cell communication analysis |
| Identification of potential cell-cell interactions between two cell types and their ligand-receptor pairs for different disease states |
| Ligand | Receptor | LRpair | Pathway | Tissue | Disease Stage |
| Page: 1 |
Top |
Single-cell gene regulatory network inference analysis |
| Find out the significant the regulons (TFs) and the target genes of each regulon across cell types for different disease states |
| TF | Cell Type | Tissue | Disease Stage | Target Gene | RSS | Regulon Activity |
| ∗The dot plots of a searched regulon are shown for all cell subpopulations in each disease state of each tissue based on the regulon specific score inferred using pySCENIC and by calculating the average expression. |
| Page: 1 |
Top |
Somatic mutation of malignant transformation related genes |
| Annotation of somatic variants for genes involved in malignant transformation |
| Hugo Symbol | Variant Class | Variant Classification | dbSNP RS | HGVSc | HGVSp | HGVSp Short | SWISSPROT | BIOTYPE | SIFT | PolyPhen | Tumor Sample Barcode | Tissue | Histology | Sex | Age | Stage | Therapy Types | Drugs | Outcome |
| DAPK3 | SNV | Missense_Mutation | novel | c.703N>A | p.Asp235Asn | p.D235N | O43293 | protein_coding | tolerated(0.07) | benign(0.062) | TCGA-2W-A8YY-01 | Cervix | cervical & endocervical cancer | Female | <65 | I/II | Chemotherapy | cisplatin | CR |
| DAPK3 | SNV | Missense_Mutation | novel | c.522C>G | p.Phe174Leu | p.F174L | O43293 | protein_coding | tolerated(0.19) | benign(0.047) | TCGA-EA-A3HU-01 | Cervix | cervical & endocervical cancer | Female | <65 | I/II | Unknown | Unknown | SD |
| DAPK3 | SNV | Missense_Mutation | novel | c.531C>G | p.Ile177Met | p.I177M | O43293 | protein_coding | tolerated(0.18) | benign(0.323) | TCGA-JW-A5VL-01 | Cervix | cervical & endocervical cancer | Female | <65 | I/II | Unknown | Unknown | SD |
| DAPK3 | SNV | Missense_Mutation | c.988G>C | p.Glu330Gln | p.E330Q | O43293 | protein_coding | deleterious(0.02) | benign(0.417) | TCGA-Q1-A73O-01 | Cervix | cervical & endocervical cancer | Female | <65 | I/II | Chemotherapy | cisplatin | CR | |
| DAPK3 | SNV | Missense_Mutation | rs547931912 | c.785N>A | p.Arg262Gln | p.R262Q | O43293 | protein_coding | deleterious(0.05) | benign(0.012) | TCGA-AA-3815-01 | Colorectum | colon adenocarcinoma | Female | >=65 | I/II | Unknown | Unknown | SD |
| DAPK3 | SNV | Missense_Mutation | c.527N>T | p.Asn176Ile | p.N176I | O43293 | protein_coding | deleterious(0) | possibly_damaging(0.887) | TCGA-CK-4951-01 | Colorectum | colon adenocarcinoma | Female | >=65 | I/II | Unknown | Unknown | PD | |
| DAPK3 | SNV | Missense_Mutation | c.493N>A | p.Ala165Thr | p.A165T | O43293 | protein_coding | deleterious(0) | possibly_damaging(0.901) | TCGA-CK-6746-01 | Colorectum | colon adenocarcinoma | Female | >=65 | I/II | Unknown | Unknown | SD | |
| DAPK3 | SNV | Missense_Mutation | c.146N>C | p.Leu49Pro | p.L49P | O43293 | protein_coding | tolerated(0.21) | benign(0.096) | TCGA-G4-6586-01 | Colorectum | colon adenocarcinoma | Female | >=65 | I/II | Unknown | Unknown | SD | |
| DAPK3 | SNV | Missense_Mutation | c.647N>T | p.Pro216Leu | p.P216L | O43293 | protein_coding | deleterious(0) | probably_damaging(1) | TCGA-AG-A02N-01 | Colorectum | rectum adenocarcinoma | Male | >=65 | I/II | Chemotherapy | folinic | CR | |
| DAPK3 | SNV | Missense_Mutation | c.463N>A | p.Pro155Thr | p.P155T | O43293 | protein_coding | deleterious(0.02) | benign(0.247) | TCGA-CI-6621-01 | Colorectum | rectum adenocarcinoma | Male | <65 | III/IV | Unknown | Unknown | SD |
| Page: 1 2 3 4 5 |
Top |
Related drugs of malignant transformation related genes |
| Identification of chemicals and drugs interact with genes involved in malignant transfromation |
| (DGIdb 4.0) |
| Entrez ID | Symbol | Category | Interaction Types | Drug Claim Name | Drug Name | PMIDs |
| 1613 | DAPK3 | ENZYME, KINASE, SERINE THREONINE KINASE, DRUGGABLE GENOME | AST-487 | AST-487 | ||
| 1613 | DAPK3 | ENZYME, KINASE, SERINE THREONINE KINASE, DRUGGABLE GENOME | PI-103 | PI-103 | ||
| 1613 | DAPK3 | ENZYME, KINASE, SERINE THREONINE KINASE, DRUGGABLE GENOME | CENISERTIB | CENISERTIB | ||
| 1613 | DAPK3 | ENZYME, KINASE, SERINE THREONINE KINASE, DRUGGABLE GENOME | ENTRECTINIB | ENTRECTINIB | ||
| 1613 | DAPK3 | ENZYME, KINASE, SERINE THREONINE KINASE, DRUGGABLE GENOME | PF-562271 | PF-00562271 | ||
| 1613 | DAPK3 | ENZYME, KINASE, SERINE THREONINE KINASE, DRUGGABLE GENOME | DNDI1417467 | CHEMBL1997335 | ||
| 1613 | DAPK3 | ENZYME, KINASE, SERINE THREONINE KINASE, DRUGGABLE GENOME | SP-600125 | SP-600125 | 23634759 | |
| 1613 | DAPK3 | ENZYME, KINASE, SERINE THREONINE KINASE, DRUGGABLE GENOME | 681640 | CHEMBL379975 | ||
| 1613 | DAPK3 | ENZYME, KINASE, SERINE THREONINE KINASE, DRUGGABLE GENOME | TAMATINIB | R-406 | ||
| 1613 | DAPK3 | ENZYME, KINASE, SERINE THREONINE KINASE, DRUGGABLE GENOME | AG-1879 | CHEMBL406845 |
| Page: 1 2 3 |

Copyright 2023-Present -The University of Texas Health Science Center at Houston |