
|
|||||
|
 | |
| |
| |
| |
| |
| |
|
Gene: DAPK2 |
Gene summary for DAPK2 |
| Gene information | Species | Human | Gene symbol | DAPK2 | Gene ID | 23604 |
| Gene name | death associated protein kinase 2 | |
| Gene Alias | DRP-1 | |
| Cytomap | 15q22.31 | |
| Gene Type | protein-coding | GO ID | GO:0002376 | UniProtAcc | A0A024R603 |
Top |
Malignant transformation analysis |
| Identification of the aberrant gene expression in precancerous and cancerous lesions by comparing the gene expression of stem-like cells in diseased tissues with normal stem cells |
| Entrez ID | Symbol | Replicates | Species | Organ | Tissue | Adj P-value | Log2FC | Malignancy |
| 23604 | DAPK2 | HTA11_3410_2000001011 | Human | Colorectum | AD | 4.44e-09 | -4.90e-01 | 0.0155 |
| 23604 | DAPK2 | HTA11_7862_2000001011 | Human | Colorectum | AD | 3.08e-02 | -5.80e-01 | -0.0179 |
| 23604 | DAPK2 | HTA11_8622_2000001021 | Human | Colorectum | SER | 2.42e-02 | -6.13e-01 | 0.0528 |
| 23604 | DAPK2 | HTA11_99999970781_79442 | Human | Colorectum | MSS | 7.01e-13 | -5.19e-01 | 0.294 |
| 23604 | DAPK2 | HTA11_99999971662_82457 | Human | Colorectum | MSS | 5.95e-12 | -5.34e-01 | 0.3859 |
| 23604 | DAPK2 | HTA11_99999974143_84620 | Human | Colorectum | MSS | 2.41e-10 | -4.78e-01 | 0.3005 |
| 23604 | DAPK2 | F007 | Human | Colorectum | FAP | 7.70e-06 | 4.17e-01 | 0.1176 |
| 23604 | DAPK2 | A002-C-010 | Human | Colorectum | FAP | 4.17e-07 | 3.66e-01 | 0.242 |
| 23604 | DAPK2 | A001-C-207 | Human | Colorectum | FAP | 4.55e-16 | 6.06e-01 | 0.1278 |
| 23604 | DAPK2 | A015-C-203 | Human | Colorectum | FAP | 3.15e-35 | 4.24e-01 | -0.1294 |
| 23604 | DAPK2 | A015-C-204 | Human | Colorectum | FAP | 1.13e-12 | 4.49e-01 | -0.0228 |
| 23604 | DAPK2 | A014-C-040 | Human | Colorectum | FAP | 1.70e-05 | 3.08e-01 | -0.1184 |
| 23604 | DAPK2 | A002-C-201 | Human | Colorectum | FAP | 2.15e-21 | 4.48e-01 | 0.0324 |
| 23604 | DAPK2 | A002-C-203 | Human | Colorectum | FAP | 1.07e-28 | 6.81e-01 | 0.2786 |
| 23604 | DAPK2 | A001-C-119 | Human | Colorectum | FAP | 1.68e-04 | 1.45e-02 | -0.1557 |
| 23604 | DAPK2 | A001-C-108 | Human | Colorectum | FAP | 2.19e-36 | 7.21e-01 | -0.0272 |
| 23604 | DAPK2 | A002-C-021 | Human | Colorectum | FAP | 8.08e-19 | 5.74e-01 | 0.1171 |
| 23604 | DAPK2 | A002-C-205 | Human | Colorectum | FAP | 9.98e-23 | 1.97e-01 | -0.1236 |
| 23604 | DAPK2 | A014-C-108 | Human | Colorectum | FAP | 1.18e-06 | 4.64e-01 | -0.124 |
| 23604 | DAPK2 | A001-C-104 | Human | Colorectum | FAP | 7.44e-19 | 5.43e-01 | 0.0184 |
| Page: 1 2 3 4 |
| Tissue | Expression Dynamics | Abbreviation |
| Colorectum (GSE201348) |  | FAP: Familial adenomatous polyposis |
| CRC: Colorectal cancer | ||
| Colorectum (HTA11) |  | AD: Adenomas |
| SER: Sessile serrated lesions | ||
| MSI-H: Microsatellite-high colorectal cancer | ||
| MSS: Microsatellite stable colorectal cancer | ||
| Lung | 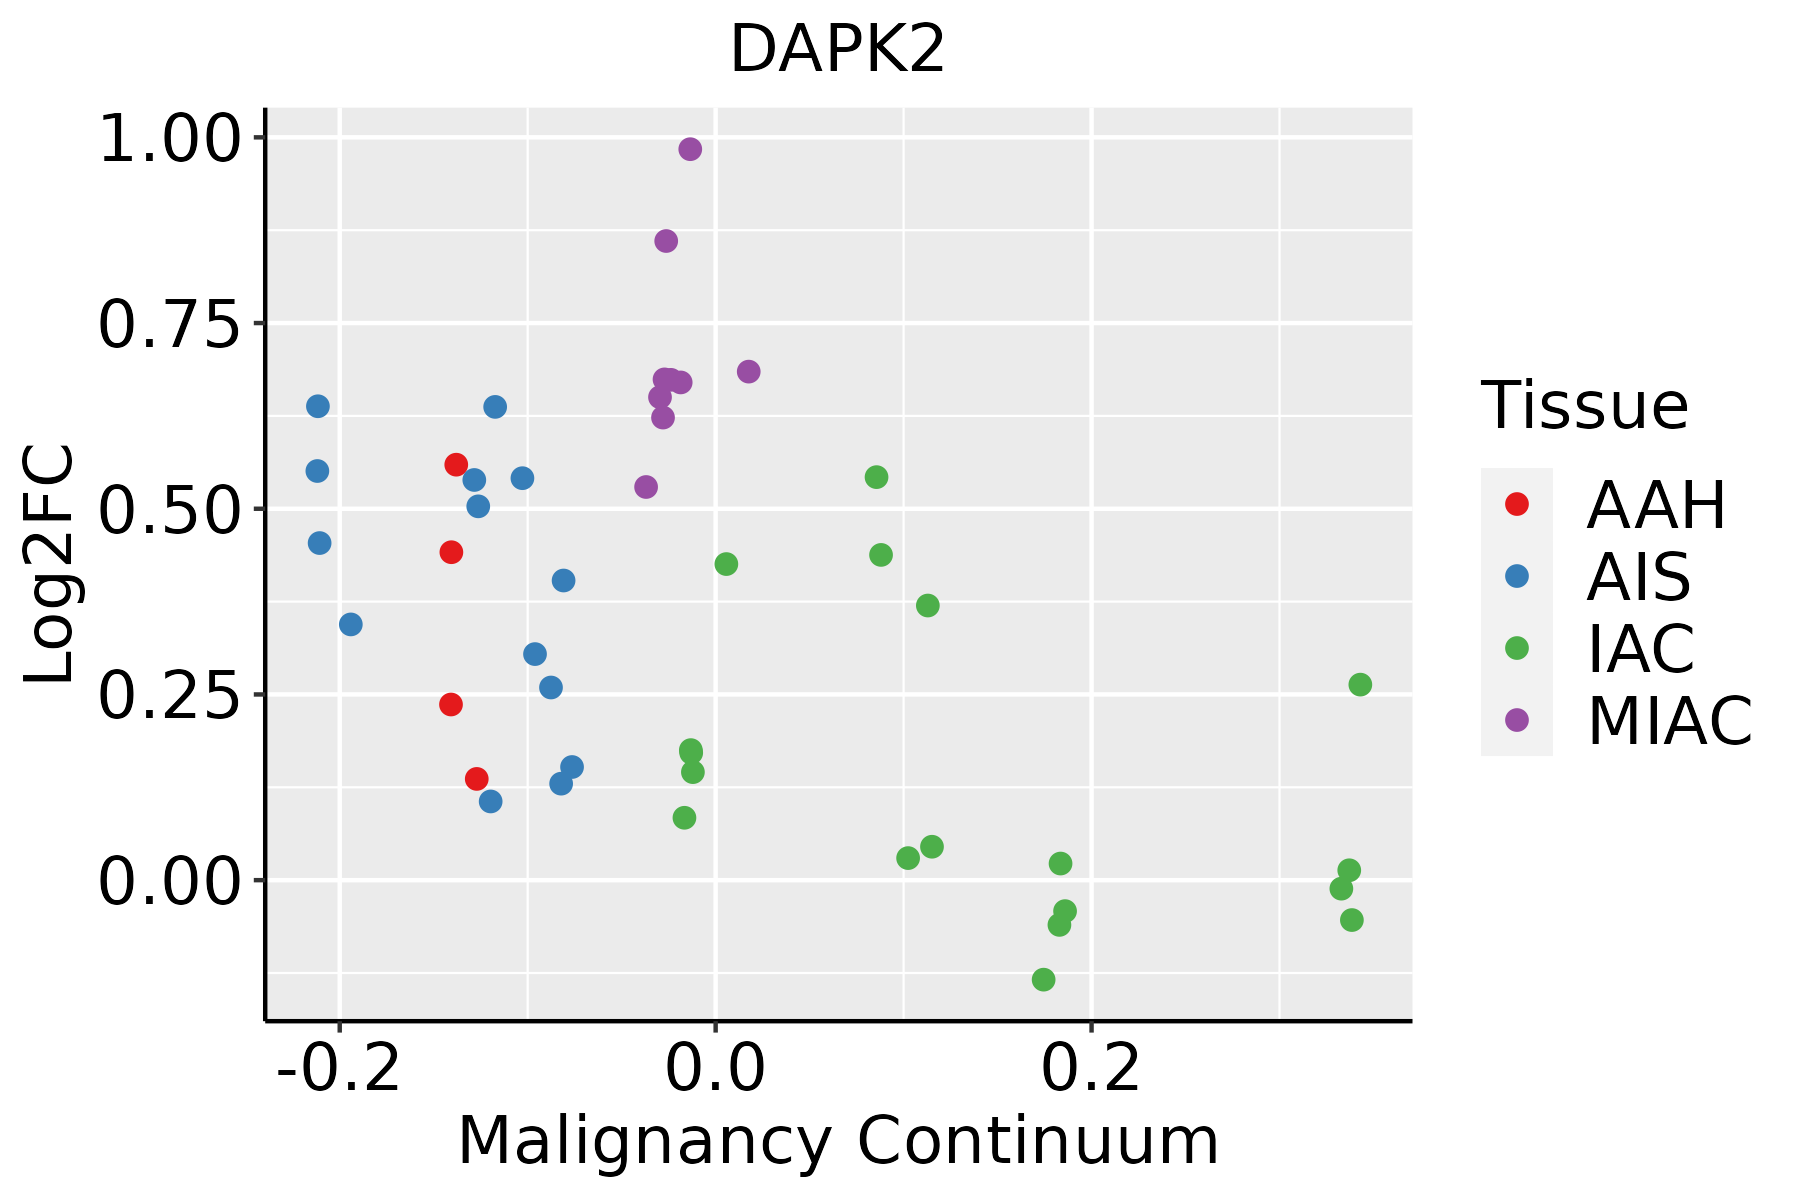 | AAH: Atypical adenomatous hyperplasia |
| AIS: Adenocarcinoma in situ | ||
| IAC: Invasive lung adenocarcinoma | ||
| MIA: Minimally invasive adenocarcinoma | ||
| Skin | 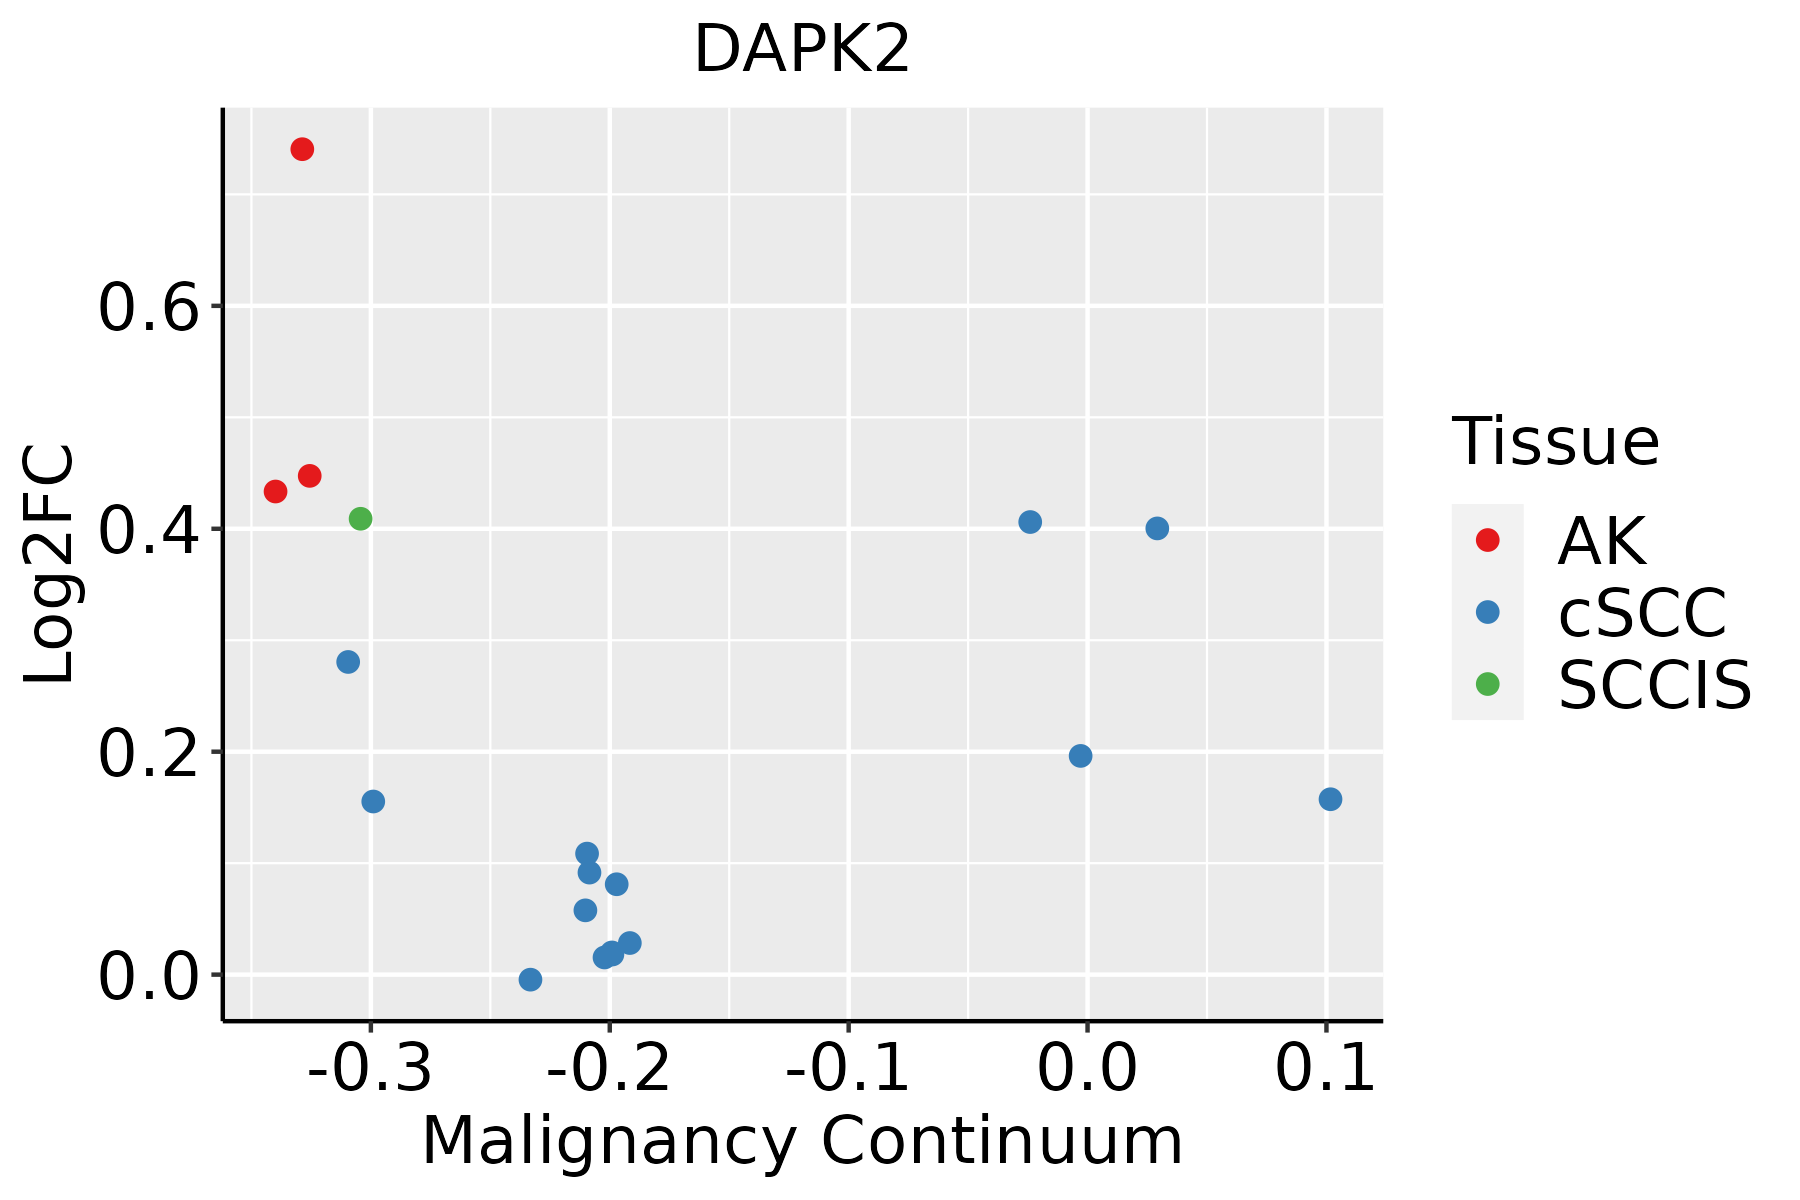 | AK: Actinic keratosis |
| cSCC: Cutaneous squamous cell carcinoma | ||
| SCCIS:squamous cell carcinoma in situ | ||
| Thyroid |  | ATC: Anaplastic thyroid cancer |
| HT: Hashimoto's thyroiditis | ||
| PTC: Papillary thyroid cancer |
| ∗log2FC in expression of this searched gene in stem-like cells from each diseased tissue sample relative to stem-like cells in normal samples in each tissue plotted against the malignancy continuum. Samples are colored based on if they are from different disease stage. |
Top |
Malignant transformation related pathway analysis |
| Find out the enriched GO biological processes and KEGG pathways involved in transition from healthy to precancer to cancer |
| Tissue | Disease Stage | Enriched GO biological Processes |
| Colorectum | AD |  |
| Colorectum | SER |  |
| Colorectum | MSS |  |
| Colorectum | MSI-H |  |
| Colorectum | FAP |  |
| ∗Top 15 enriched GO BP terms are showed in the bar plot of each disease state in each tissue. Each row represents a significant GO biological process which is colored according to the -log10(p.adjust). |
| Page: 1 2 3 4 5 6 7 8 9 |
| GO ID | Tissue | Disease Stage | Description | Gene Ratio | Bg Ratio | pvalue | p.adjust | Count |
| GO:0097193 | Colorectum | AD | intrinsic apoptotic signaling pathway | 108/3918 | 288/18723 | 6.25e-11 | 6.41e-09 | 108 |
| GO:0010506 | Colorectum | AD | regulation of autophagy | 111/3918 | 317/18723 | 3.57e-09 | 2.35e-07 | 111 |
| GO:2001242 | Colorectum | AD | regulation of intrinsic apoptotic signaling pathway | 67/3918 | 164/18723 | 4.94e-09 | 3.16e-07 | 67 |
| GO:2001233 | Colorectum | AD | regulation of apoptotic signaling pathway | 119/3918 | 356/18723 | 2.14e-08 | 1.21e-06 | 119 |
| GO:0046777 | Colorectum | AD | protein autophosphorylation | 74/3918 | 227/18723 | 2.48e-05 | 4.76e-04 | 74 |
| GO:20012421 | Colorectum | SER | regulation of intrinsic apoptotic signaling pathway | 59/2897 | 164/18723 | 8.42e-11 | 1.20e-08 | 59 |
| GO:00971931 | Colorectum | SER | intrinsic apoptotic signaling pathway | 87/2897 | 288/18723 | 1.67e-10 | 2.32e-08 | 87 |
| GO:20012331 | Colorectum | SER | regulation of apoptotic signaling pathway | 101/2897 | 356/18723 | 3.05e-10 | 4.07e-08 | 101 |
| GO:00467771 | Colorectum | SER | protein autophosphorylation | 60/2897 | 227/18723 | 1.36e-05 | 4.25e-04 | 60 |
| GO:00105061 | Colorectum | SER | regulation of autophagy | 74/2897 | 317/18723 | 1.39e-04 | 2.77e-03 | 74 |
| GO:00971932 | Colorectum | MSS | intrinsic apoptotic signaling pathway | 102/3467 | 288/18723 | 6.06e-12 | 9.82e-10 | 102 |
| GO:20012422 | Colorectum | MSS | regulation of intrinsic apoptotic signaling pathway | 66/3467 | 164/18723 | 6.70e-11 | 7.47e-09 | 66 |
| GO:20012332 | Colorectum | MSS | regulation of apoptotic signaling pathway | 116/3467 | 356/18723 | 1.02e-10 | 1.06e-08 | 116 |
| GO:00105062 | Colorectum | MSS | regulation of autophagy | 95/3467 | 317/18723 | 4.36e-07 | 1.71e-05 | 95 |
| GO:00467772 | Colorectum | MSS | protein autophosphorylation | 63/3467 | 227/18723 | 3.96e-04 | 4.91e-03 | 63 |
| GO:00105063 | Colorectum | FAP | regulation of autophagy | 80/2622 | 317/18723 | 6.43e-08 | 4.54e-06 | 80 |
| GO:00971934 | Colorectum | FAP | intrinsic apoptotic signaling pathway | 66/2622 | 288/18723 | 2.76e-05 | 6.33e-04 | 66 |
| GO:00467773 | Colorectum | FAP | protein autophosphorylation | 52/2622 | 227/18723 | 1.88e-04 | 2.76e-03 | 52 |
| GO:20012334 | Colorectum | FAP | regulation of apoptotic signaling pathway | 74/2622 | 356/18723 | 2.65e-04 | 3.60e-03 | 74 |
| GO:20012424 | Colorectum | FAP | regulation of intrinsic apoptotic signaling pathway | 39/2622 | 164/18723 | 5.21e-04 | 5.91e-03 | 39 |
| Page: 1 2 3 4 5 6 7 |
| Pathway ID | Tissue | Disease Stage | Description | Gene Ratio | Bg Ratio | pvalue | p.adjust | qvalue | Count |
| hsa04140 | Colorectum | AD | Autophagy - animal | 49/2092 | 141/8465 | 4.58e-03 | 2.20e-02 | 1.40e-02 | 49 |
| hsa041401 | Colorectum | AD | Autophagy - animal | 49/2092 | 141/8465 | 4.58e-03 | 2.20e-02 | 1.40e-02 | 49 |
| hsa041402 | Colorectum | SER | Autophagy - animal | 39/1580 | 141/8465 | 5.43e-03 | 3.28e-02 | 2.38e-02 | 39 |
| hsa041403 | Colorectum | SER | Autophagy - animal | 39/1580 | 141/8465 | 5.43e-03 | 3.28e-02 | 2.38e-02 | 39 |
| hsa041404 | Colorectum | MSS | Autophagy - animal | 45/1875 | 141/8465 | 4.42e-03 | 1.90e-02 | 1.16e-02 | 45 |
| hsa041405 | Colorectum | MSS | Autophagy - animal | 45/1875 | 141/8465 | 4.42e-03 | 1.90e-02 | 1.16e-02 | 45 |
| hsa052195 | Lung | IAC | Bladder cancer | 13/1053 | 41/8465 | 9.74e-04 | 7.32e-03 | 4.86e-03 | 13 |
| hsa041407 | Lung | IAC | Autophagy - animal | 28/1053 | 141/8465 | 7.64e-03 | 3.03e-02 | 2.01e-02 | 28 |
| hsa0521912 | Lung | IAC | Bladder cancer | 13/1053 | 41/8465 | 9.74e-04 | 7.32e-03 | 4.86e-03 | 13 |
| hsa0414012 | Lung | IAC | Autophagy - animal | 28/1053 | 141/8465 | 7.64e-03 | 3.03e-02 | 2.01e-02 | 28 |
| hsa0414022 | Lung | AIS | Autophagy - animal | 26/961 | 141/8465 | 8.23e-03 | 3.71e-02 | 2.37e-02 | 26 |
| hsa0414032 | Lung | AIS | Autophagy - animal | 26/961 | 141/8465 | 8.23e-03 | 3.71e-02 | 2.37e-02 | 26 |
| Page: 1 |
Top |
Cell-cell communication analysis |
| Identification of potential cell-cell interactions between two cell types and their ligand-receptor pairs for different disease states |
| Ligand | Receptor | LRpair | Pathway | Tissue | Disease Stage |
| Page: 1 |
Top |
Single-cell gene regulatory network inference analysis |
| Find out the significant the regulons (TFs) and the target genes of each regulon across cell types for different disease states |
| TF | Cell Type | Tissue | Disease Stage | Target Gene | RSS | Regulon Activity |
| ∗The dot plots of a searched regulon are shown for all cell subpopulations in each disease state of each tissue based on the regulon specific score inferred using pySCENIC and by calculating the average expression. |
| Page: 1 |
Top |
Somatic mutation of malignant transformation related genes |
| Annotation of somatic variants for genes involved in malignant transformation |
| Hugo Symbol | Variant Class | Variant Classification | dbSNP RS | HGVSc | HGVSp | HGVSp Short | SWISSPROT | BIOTYPE | SIFT | PolyPhen | Tumor Sample Barcode | Tissue | Histology | Sex | Age | Stage | Therapy Types | Drugs | Outcome |
| DAPK2 | SNV | Missense_Mutation | c.899N>A | p.Val300Glu | p.V300E | Q9UIK4 | protein_coding | deleterious(0.05) | benign(0.026) | TCGA-A1-A0SH-01 | Breast | breast invasive carcinoma | Female | <65 | I/II | Chemotherapy | tc | SD | |
| DAPK2 | SNV | Missense_Mutation | novel | c.1058N>G | p.Glu353Gly | p.E353G | Q9UIK4 | protein_coding | deleterious(0) | benign(0.142) | TCGA-A2-A3XT-01 | Breast | breast invasive carcinoma | Female | <65 | I/II | Chemotherapy | cyclophosphamide | PR |
| DAPK2 | SNV | Missense_Mutation | c.1028N>G | p.Asp343Gly | p.D343G | Q9UIK4 | protein_coding | tolerated(0.26) | benign(0.035) | TCGA-D8-A1XK-01 | Breast | breast invasive carcinoma | Female | <65 | I/II | Chemotherapy | doxorubicine+cyclophosphamide | SD | |
| DAPK2 | SNV | Missense_Mutation | c.807N>C | p.Glu269Asp | p.E269D | Q9UIK4 | protein_coding | tolerated(1) | benign(0) | TCGA-E2-A1IH-01 | Breast | breast invasive carcinoma | Female | >=65 | I/II | Hormone Therapy | aromasin | SD | |
| DAPK2 | SNV | Missense_Mutation | novel | c.772N>A | p.Ala258Thr | p.A258T | Q9UIK4 | protein_coding | deleterious(0) | probably_damaging(0.999) | TCGA-2W-A8YY-01 | Cervix | cervical & endocervical cancer | Female | <65 | I/II | Chemotherapy | cisplatin | CR |
| DAPK2 | SNV | Missense_Mutation | novel | c.367N>A | p.Glu123Lys | p.E123K | Q9UIK4 | protein_coding | deleterious(0.01) | probably_damaging(0.961) | TCGA-VS-A8EK-01 | Cervix | cervical & endocervical cancer | Female | >=65 | I/II | Chemotherapy | cisplatin | PD |
| DAPK2 | SNV | Missense_Mutation | novel | c.37N>T | p.Pro13Ser | p.P13S | Q9UIK4 | protein_coding | tolerated(0.77) | benign(0) | TCGA-AZ-4315-01 | Colorectum | colon adenocarcinoma | Male | <65 | I/II | Unknown | Unknown | SD |
| DAPK2 | SNV | Missense_Mutation | rs749221840 | c.788N>A | p.Arg263Gln | p.R263Q | Q9UIK4 | protein_coding | tolerated(0.43) | benign(0.042) | TCGA-AZ-6601-01 | Colorectum | colon adenocarcinoma | Male | >=65 | I/II | Unknown | Unknown | PD |
| DAPK2 | SNV | Missense_Mutation | c.54G>C | p.Lys18Asn | p.K18N | Q9UIK4 | protein_coding | tolerated(0.89) | benign(0) | TCGA-CM-5862-01 | Colorectum | colon adenocarcinoma | Male | >=65 | I/II | Unknown | Unknown | PD | |
| DAPK2 | deletion | Frame_Shift_Del | c.677delC | p.Pro226LeufsTer17 | p.P226Lfs*17 | Q9UIK4 | protein_coding | TCGA-5M-AAT6-01 | Colorectum | colon adenocarcinoma | Female | <65 | III/IV | Unknown | Unknown | PD |
| Page: 1 2 3 4 |
Top |
Related drugs of malignant transformation related genes |
| Identification of chemicals and drugs interact with genes involved in malignant transfromation |
| (DGIdb 4.0) |
| Entrez ID | Symbol | Category | Interaction Types | Drug Claim Name | Drug Name | PMIDs |
| Page: 1 |

Copyright 2023-Present -The University of Texas Health Science Center at Houston |