
|
|||||
|
 | |
| |
| |
| |
| |
| |
|
Gene: DAPK1 |
Gene summary for DAPK1 |
| Gene information | Species | Human | Gene symbol | DAPK1 | Gene ID | 1612 |
| Gene name | death associated protein kinase 1 | |
| Gene Alias | DAPK | |
| Cytomap | 9q21.33 | |
| Gene Type | protein-coding | GO ID | GO:0002347 | UniProtAcc | P53355 |
Top |
Malignant transformation analysis |
| Identification of the aberrant gene expression in precancerous and cancerous lesions by comparing the gene expression of stem-like cells in diseased tissues with normal stem cells |
| Entrez ID | Symbol | Replicates | Species | Organ | Tissue | Adj P-value | Log2FC | Malignancy |
| 1612 | DAPK1 | NAFLD1 | Human | Liver | NAFLD | 6.57e-03 | 4.71e-01 | -0.04 |
| 1612 | DAPK1 | S43 | Human | Liver | Cirrhotic | 1.99e-06 | -1.15e-01 | -0.0187 |
| 1612 | DAPK1 | HCC1_Meng | Human | Liver | HCC | 6.13e-26 | -2.26e-01 | 0.0246 |
| 1612 | DAPK1 | HCC2_Meng | Human | Liver | HCC | 1.14e-22 | -9.69e-02 | 0.0107 |
| 1612 | DAPK1 | cirrhotic1 | Human | Liver | Cirrhotic | 3.88e-03 | -1.30e-01 | 0.0202 |
| 1612 | DAPK1 | cirrhotic2 | Human | Liver | Cirrhotic | 8.24e-06 | -1.07e-01 | 0.0201 |
| 1612 | DAPK1 | Pt13.a | Human | Liver | HCC | 1.11e-02 | -2.14e-01 | 0.021 |
| 1612 | DAPK1 | Pt13.b | Human | Liver | HCC | 6.18e-04 | -2.78e-01 | 0.0251 |
| 1612 | DAPK1 | S016 | Human | Liver | HCC | 1.12e-03 | -2.79e-01 | 0.2243 |
| 1612 | DAPK1 | S027 | Human | Liver | HCC | 2.17e-03 | 7.50e-01 | 0.2446 |
| 1612 | DAPK1 | S028 | Human | Liver | HCC | 2.85e-02 | 4.54e-01 | 0.2503 |
| 1612 | DAPK1 | S029 | Human | Liver | HCC | 2.86e-04 | 5.90e-01 | 0.2581 |
| 1612 | DAPK1 | RNA-P17T-P17T-2 | Human | Lung | IAC | 1.60e-02 | -1.12e-01 | 0.3371 |
| 1612 | DAPK1 | RNA-P17T-P17T-4 | Human | Lung | IAC | 1.69e-05 | 8.07e-02 | 0.343 |
| 1612 | DAPK1 | RNA-P17T-P17T-6 | Human | Lung | IAC | 6.60e-07 | 1.97e-01 | 0.3385 |
| 1612 | DAPK1 | RNA-P17T-P17T-8 | Human | Lung | IAC | 2.29e-05 | 2.00e-03 | 0.3329 |
| 1612 | DAPK1 | RNA-P25T1-P25T1-1 | Human | Lung | AIS | 9.06e-08 | 3.90e-01 | -0.2116 |
| 1612 | DAPK1 | RNA-P25T1-P25T1-3 | Human | Lung | AIS | 5.49e-04 | 5.11e-01 | -0.2107 |
| 1612 | DAPK1 | RNA-P25T1-P25T1-4 | Human | Lung | AIS | 3.96e-07 | 5.00e-01 | -0.2119 |
| 1612 | DAPK1 | RNA-P6T1-P6T1-4 | Human | Lung | MIAC | 3.76e-04 | 1.02e+00 | -0.0263 |
| Page: 1 2 |
| Tissue | Expression Dynamics | Abbreviation |
| Liver | 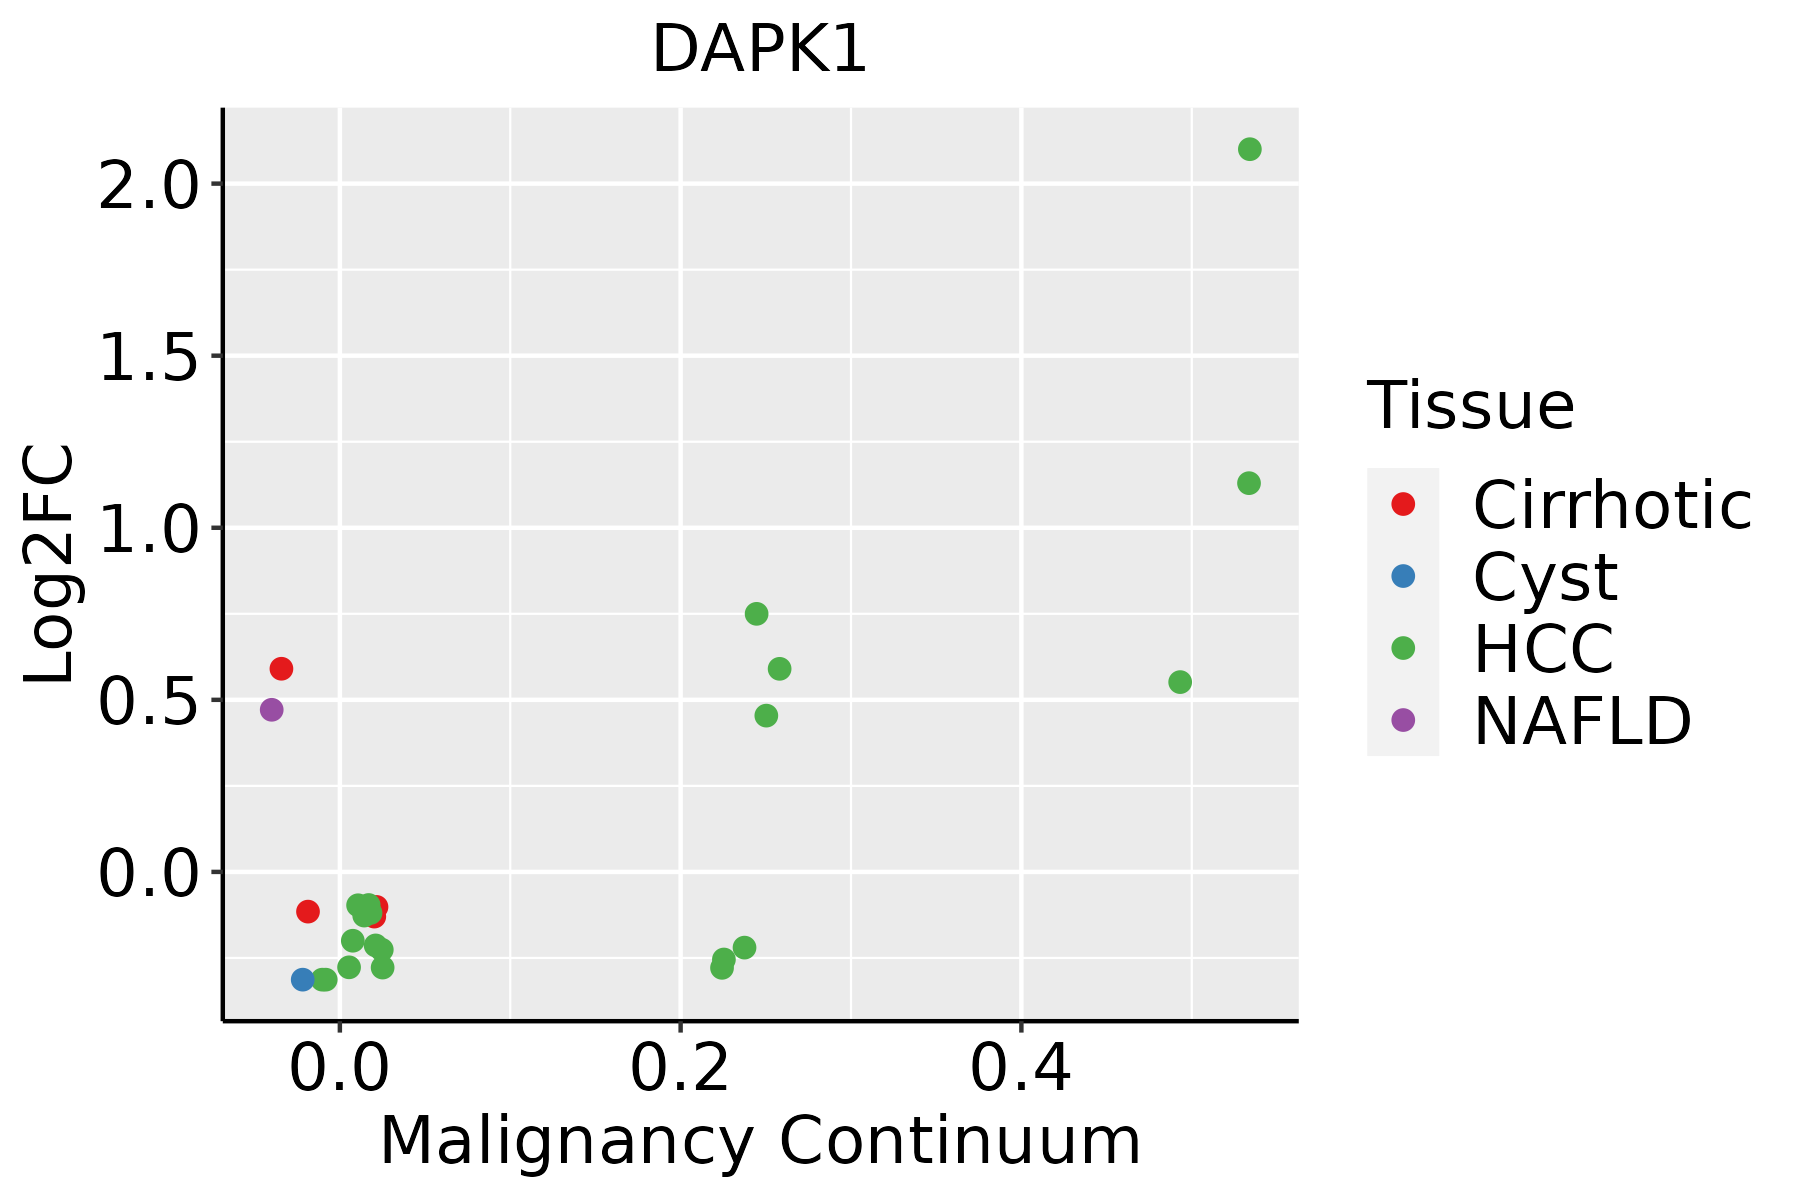 | HCC: Hepatocellular carcinoma |
| NAFLD: Non-alcoholic fatty liver disease | ||
| Lung | 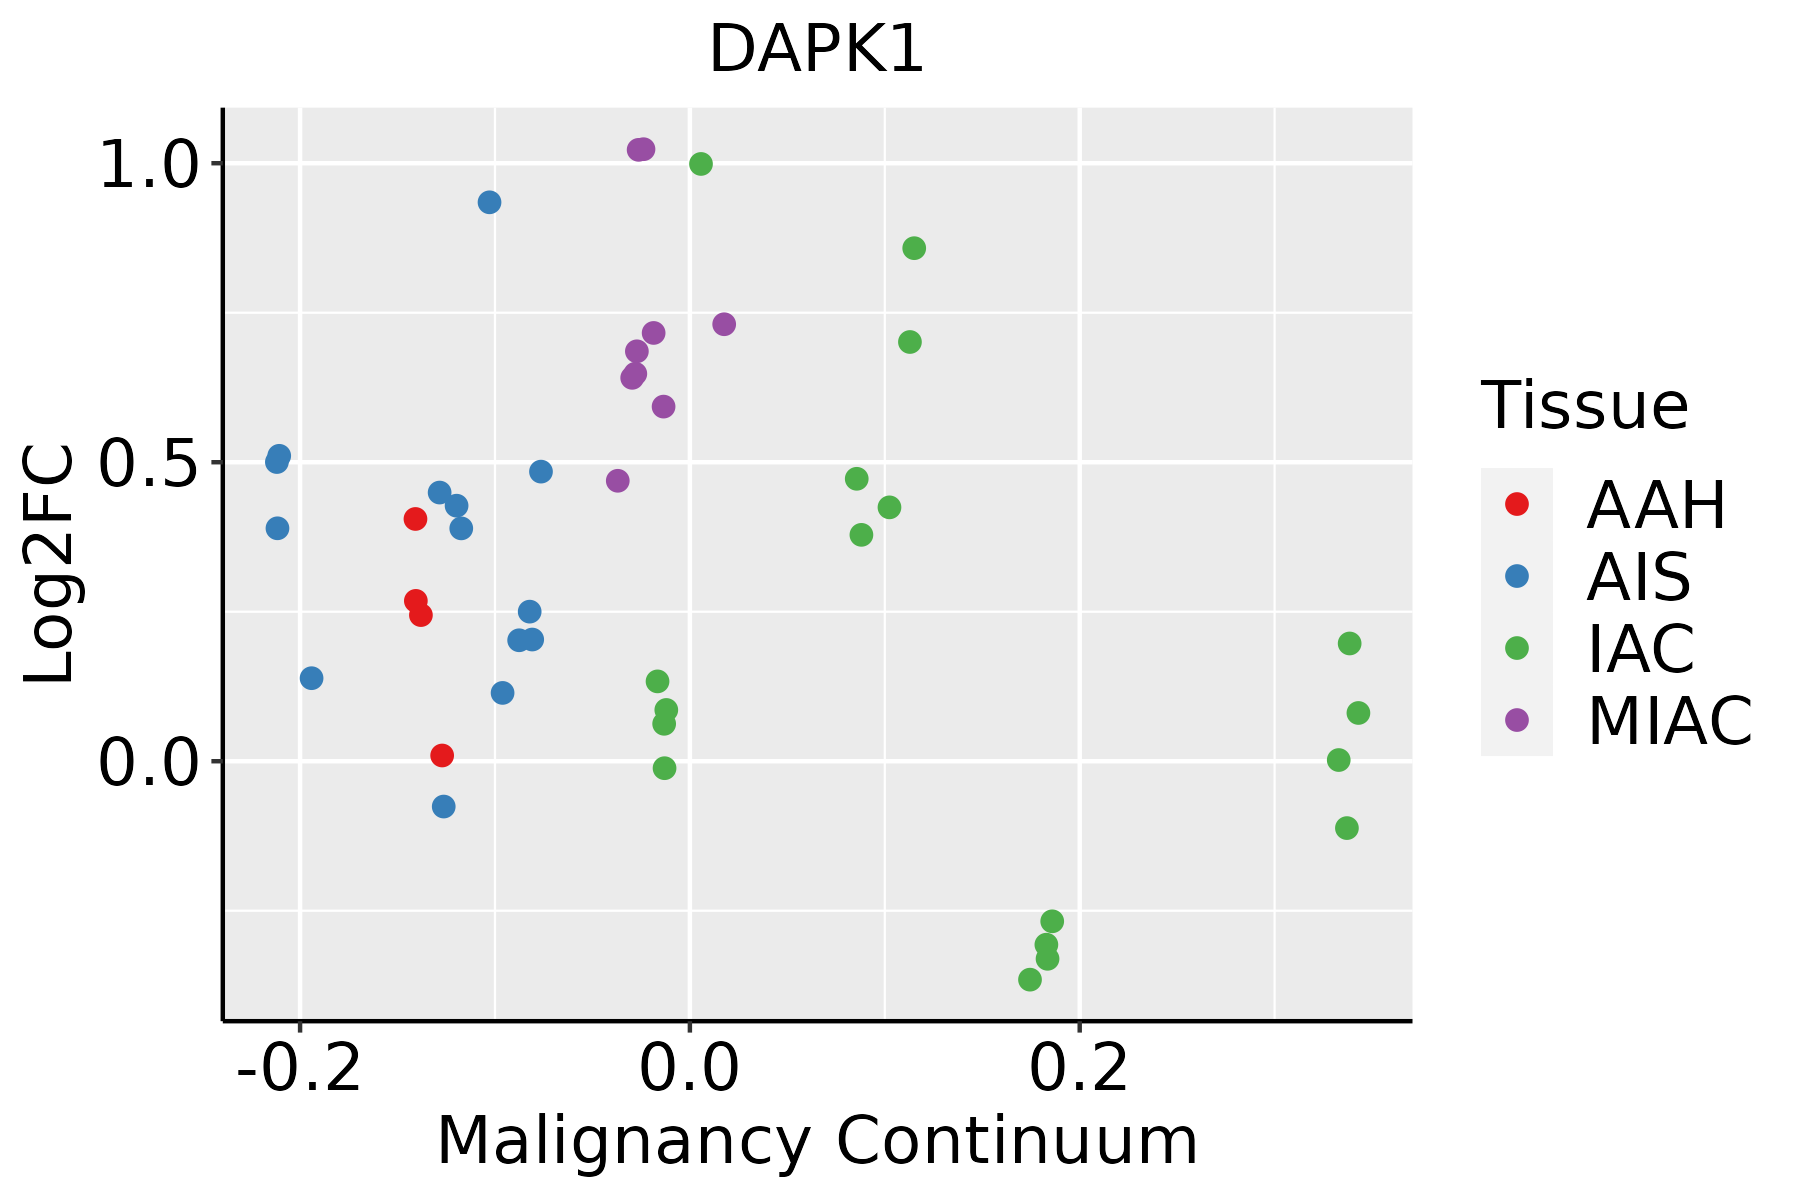 | AAH: Atypical adenomatous hyperplasia |
| AIS: Adenocarcinoma in situ | ||
| IAC: Invasive lung adenocarcinoma | ||
| MIA: Minimally invasive adenocarcinoma |
| ∗log2FC in expression of this searched gene in stem-like cells from each diseased tissue sample relative to stem-like cells in normal samples in each tissue plotted against the malignancy continuum. Samples are colored based on if they are from different disease stage. |
Top |
Malignant transformation related pathway analysis |
| Find out the enriched GO biological processes and KEGG pathways involved in transition from healthy to precancer to cancer |
| Tissue | Disease Stage | Enriched GO biological Processes |
| Colorectum | AD |  |
| Colorectum | SER |  |
| Colorectum | MSS |  |
| Colorectum | MSI-H |  |
| Colorectum | FAP |  |
| ∗Top 15 enriched GO BP terms are showed in the bar plot of each disease state in each tissue. Each row represents a significant GO biological process which is colored according to the -log10(p.adjust). |
| Page: 1 2 3 4 5 6 7 8 9 |
| GO ID | Tissue | Disease Stage | Description | Gene Ratio | Bg Ratio | pvalue | p.adjust | Count |
| GO:00098967 | Liver | NAFLD | positive regulation of catabolic process | 108/1882 | 492/18723 | 2.68e-15 | 3.14e-12 | 108 |
| GO:00313317 | Liver | NAFLD | positive regulation of cellular catabolic process | 92/1882 | 427/18723 | 1.01e-12 | 4.91e-10 | 92 |
| GO:00064177 | Liver | NAFLD | regulation of translation | 85/1882 | 468/18723 | 4.58e-08 | 4.54e-06 | 85 |
| GO:00069797 | Liver | NAFLD | response to oxidative stress | 78/1882 | 446/18723 | 7.85e-07 | 4.29e-05 | 78 |
| GO:00458627 | Liver | NAFLD | positive regulation of proteolysis | 65/1882 | 372/18723 | 6.58e-06 | 2.29e-04 | 65 |
| GO:00105065 | Liver | NAFLD | regulation of autophagy | 57/1882 | 317/18723 | 1.00e-05 | 3.18e-04 | 57 |
| GO:00525477 | Liver | NAFLD | regulation of peptidase activity | 72/1882 | 461/18723 | 1.03e-04 | 2.03e-03 | 72 |
| GO:00171483 | Liver | NAFLD | negative regulation of translation | 43/1882 | 245/18723 | 2.05e-04 | 3.56e-03 | 43 |
| GO:00525487 | Liver | NAFLD | regulation of endopeptidase activity | 67/1882 | 432/18723 | 2.17e-04 | 3.70e-03 | 67 |
| GO:00105083 | Liver | NAFLD | positive regulation of autophagy | 26/1882 | 124/18723 | 2.20e-04 | 3.74e-03 | 26 |
| GO:00342493 | Liver | NAFLD | negative regulation of cellular amide metabolic process | 46/1882 | 273/18723 | 3.27e-04 | 5.04e-03 | 46 |
| GO:00621977 | Liver | NAFLD | cellular response to chemical stress | 54/1882 | 337/18723 | 3.83e-04 | 5.73e-03 | 54 |
| GO:00345997 | Liver | NAFLD | cellular response to oxidative stress | 46/1882 | 288/18723 | 1.07e-03 | 1.25e-02 | 46 |
| GO:000989612 | Liver | Cirrhotic | positive regulation of catabolic process | 215/4634 | 492/18723 | 1.13e-20 | 3.56e-18 | 215 |
| GO:003133112 | Liver | Cirrhotic | positive regulation of cellular catabolic process | 190/4634 | 427/18723 | 1.94e-19 | 4.18e-17 | 190 |
| GO:000697912 | Liver | Cirrhotic | response to oxidative stress | 196/4634 | 446/18723 | 2.80e-19 | 5.86e-17 | 196 |
| GO:004586212 | Liver | Cirrhotic | positive regulation of proteolysis | 163/4634 | 372/18723 | 4.18e-16 | 5.14e-14 | 163 |
| GO:000641712 | Liver | Cirrhotic | regulation of translation | 194/4634 | 468/18723 | 7.28e-16 | 8.79e-14 | 194 |
| GO:006219712 | Liver | Cirrhotic | cellular response to chemical stress | 147/4634 | 337/18723 | 1.84e-14 | 1.72e-12 | 147 |
| GO:005254712 | Liver | Cirrhotic | regulation of peptidase activity | 185/4634 | 461/18723 | 1.32e-13 | 1.09e-11 | 185 |
| Page: 1 2 3 4 5 6 |
| Pathway ID | Tissue | Disease Stage | Description | Gene Ratio | Bg Ratio | pvalue | p.adjust | qvalue | Count |
| hsa041406 | Liver | Cirrhotic | Autophagy - animal | 65/2530 | 141/8465 | 3.10e-05 | 2.47e-04 | 1.52e-04 | 65 |
| hsa052194 | Liver | Cirrhotic | Bladder cancer | 25/2530 | 41/8465 | 3.48e-05 | 2.57e-04 | 1.59e-04 | 25 |
| hsa0414011 | Liver | Cirrhotic | Autophagy - animal | 65/2530 | 141/8465 | 3.10e-05 | 2.47e-04 | 1.52e-04 | 65 |
| hsa0521911 | Liver | Cirrhotic | Bladder cancer | 25/2530 | 41/8465 | 3.48e-05 | 2.57e-04 | 1.59e-04 | 25 |
| hsa0414021 | Liver | HCC | Autophagy - animal | 99/4020 | 141/8465 | 3.08e-08 | 4.70e-07 | 2.61e-07 | 99 |
| hsa052192 | Liver | HCC | Bladder cancer | 30/4020 | 41/8465 | 7.37e-04 | 2.94e-03 | 1.63e-03 | 30 |
| hsa0414031 | Liver | HCC | Autophagy - animal | 99/4020 | 141/8465 | 3.08e-08 | 4.70e-07 | 2.61e-07 | 99 |
| hsa052193 | Liver | HCC | Bladder cancer | 30/4020 | 41/8465 | 7.37e-04 | 2.94e-03 | 1.63e-03 | 30 |
| hsa052195 | Lung | IAC | Bladder cancer | 13/1053 | 41/8465 | 9.74e-04 | 7.32e-03 | 4.86e-03 | 13 |
| hsa041407 | Lung | IAC | Autophagy - animal | 28/1053 | 141/8465 | 7.64e-03 | 3.03e-02 | 2.01e-02 | 28 |
| hsa0521912 | Lung | IAC | Bladder cancer | 13/1053 | 41/8465 | 9.74e-04 | 7.32e-03 | 4.86e-03 | 13 |
| hsa0414012 | Lung | IAC | Autophagy - animal | 28/1053 | 141/8465 | 7.64e-03 | 3.03e-02 | 2.01e-02 | 28 |
| hsa0414022 | Lung | AIS | Autophagy - animal | 26/961 | 141/8465 | 8.23e-03 | 3.71e-02 | 2.37e-02 | 26 |
| hsa0414032 | Lung | AIS | Autophagy - animal | 26/961 | 141/8465 | 8.23e-03 | 3.71e-02 | 2.37e-02 | 26 |
| Page: 1 |
Top |
Cell-cell communication analysis |
| Identification of potential cell-cell interactions between two cell types and their ligand-receptor pairs for different disease states |
| Ligand | Receptor | LRpair | Pathway | Tissue | Disease Stage |
| Page: 1 |
Top |
Single-cell gene regulatory network inference analysis |
| Find out the significant the regulons (TFs) and the target genes of each regulon across cell types for different disease states |
| TF | Cell Type | Tissue | Disease Stage | Target Gene | RSS | Regulon Activity |
| ∗The dot plots of a searched regulon are shown for all cell subpopulations in each disease state of each tissue based on the regulon specific score inferred using pySCENIC and by calculating the average expression. |
| Page: 1 |
Top |
Somatic mutation of malignant transformation related genes |
| Annotation of somatic variants for genes involved in malignant transformation |
| Hugo Symbol | Variant Class | Variant Classification | dbSNP RS | HGVSc | HGVSp | HGVSp Short | SWISSPROT | BIOTYPE | SIFT | PolyPhen | Tumor Sample Barcode | Tissue | Histology | Sex | Age | Stage | Therapy Types | Drugs | Outcome |
| DAPK1 | SNV | Missense_Mutation | novel | c.893A>T | p.Lys298Met | p.K298M | P53355 | protein_coding | deleterious(0.01) | probably_damaging(0.992) | TCGA-A2-A0YI-01 | Breast | breast invasive carcinoma | Female | <65 | I/II | Unspecific | Femara | SD |
| DAPK1 | SNV | Missense_Mutation | rs748331719 | c.2288T>C | p.Met763Thr | p.M763T | P53355 | protein_coding | tolerated(1) | possibly_damaging(0.838) | TCGA-A2-A4S3-01 | Breast | breast invasive carcinoma | Female | <65 | I/II | Unknown | Unknown | SD |
| DAPK1 | SNV | Missense_Mutation | c.2491N>A | p.Asp831Asn | p.D831N | P53355 | protein_coding | tolerated(0.15) | benign(0.346) | TCGA-AC-A23H-01 | Breast | breast invasive carcinoma | Female | >=65 | I/II | Unknown | Unknown | PD | |
| DAPK1 | SNV | Missense_Mutation | c.928N>T | p.Arg310Cys | p.R310C | P53355 | protein_coding | tolerated(0.11) | possibly_damaging(0.698) | TCGA-AN-A046-01 | Breast | breast invasive carcinoma | Female | >=65 | I/II | Unknown | Unknown | SD | |
| DAPK1 | SNV | Missense_Mutation | rs371685332 | c.698N>G | p.Asn233Ser | p.N233S | P53355 | protein_coding | tolerated(0.09) | benign(0) | TCGA-AQ-A54N-01 | Breast | breast invasive carcinoma | Female | <65 | I/II | Unknown | Unknown | SD |
| DAPK1 | SNV | Missense_Mutation | rs371992448 | c.3928N>T | p.Arg1310Trp | p.R1310W | P53355 | protein_coding | deleterious(0) | probably_damaging(0.998) | TCGA-BH-A0E0-01 | Breast | breast invasive carcinoma | Female | <65 | III/IV | Chemotherapy | docetaxel | SD |
| DAPK1 | SNV | Missense_Mutation | c.4174N>A | p.Leu1392Met | p.L1392M | P53355 | protein_coding | deleterious(0.01) | probably_damaging(0.998) | TCGA-BH-A18U-01 | Breast | breast invasive carcinoma | Female | >=65 | III/IV | Unknown | Unknown | SD | |
| DAPK1 | SNV | Missense_Mutation | c.13N>G | p.Arg5Gly | p.R5G | P53355 | protein_coding | tolerated(0.53) | benign(0.023) | TCGA-D8-A1XK-01 | Breast | breast invasive carcinoma | Female | <65 | I/II | Chemotherapy | doxorubicine+cyclophosphamide | SD | |
| DAPK1 | SNV | Missense_Mutation | novel | c.742G>A | p.Ala248Thr | p.A248T | P53355 | protein_coding | deleterious(0) | possibly_damaging(0.454) | TCGA-OL-A6VO-01 | Breast | breast invasive carcinoma | Female | <65 | I/II | Chemotherapy | taxotere | CR |
| DAPK1 | insertion | Frame_Shift_Ins | novel | c.2399_2400insTCTGGGGAGGAGGCAGCTGTCCTGGT | p.Ala801LeufsTer12 | p.A801Lfs*12 | P53355 | protein_coding | TCGA-AR-A0TY-01 | Breast | breast invasive carcinoma | Female | <65 | I/II | Unspecific | Paclitaxel | PD |
| Page: 1 2 3 4 5 6 7 8 9 10 11 12 13 14 15 16 17 |
Top |
Related drugs of malignant transformation related genes |
| Identification of chemicals and drugs interact with genes involved in malignant transfromation |
| (DGIdb 4.0) |
| Entrez ID | Symbol | Category | Interaction Types | Drug Claim Name | Drug Name | PMIDs |
| 1612 | DAPK1 | KINASE, DRUGGABLE GENOME, SERINE THREONINE KINASE, ENZYME | inhibitor | 135652717 | STAUROSPORINE | |
| 1612 | DAPK1 | KINASE, DRUGGABLE GENOME, SERINE THREONINE KINASE, ENZYME | gemcitabine | GEMCITABINE | 22293537 |
| Page: 1 |

Copyright 2023-Present -The University of Texas Health Science Center at Houston |