
|
|||||
|
 | |
| |
| |
| |
| |
| |
|
Gene: DAP3 |
Gene summary for DAP3 |
| Gene information | Species | Human | Gene symbol | DAP3 | Gene ID | 7818 |
| Gene name | death associated protein 3 | |
| Gene Alias | DAP-3 | |
| Cytomap | 1q22 | |
| Gene Type | protein-coding | GO ID | GO:0006915 | UniProtAcc | P51398 |
Top |
Malignant transformation analysis |
| Identification of the aberrant gene expression in precancerous and cancerous lesions by comparing the gene expression of stem-like cells in diseased tissues with normal stem cells |
| Entrez ID | Symbol | Replicates | Species | Organ | Tissue | Adj P-value | Log2FC | Malignancy |
| 7818 | DAP3 | N_HPV_2 | Human | Cervix | N_HPV | 3.52e-03 | 9.04e-02 | -0.0131 |
| 7818 | DAP3 | CCI_1 | Human | Cervix | CC | 1.41e-09 | 1.04e+00 | 0.528 |
| 7818 | DAP3 | CCI_3 | Human | Cervix | CC | 1.39e-04 | 5.36e-01 | 0.516 |
| 7818 | DAP3 | T3 | Human | Cervix | CC | 3.03e-02 | 8.26e-02 | 0.1389 |
| 7818 | DAP3 | HTA11_347_2000001011 | Human | Colorectum | AD | 5.53e-04 | 4.30e-01 | -0.1954 |
| 7818 | DAP3 | HTA11_1391_2000001011 | Human | Colorectum | AD | 2.60e-09 | 7.65e-01 | -0.059 |
| 7818 | DAP3 | HTA11_99999970781_79442 | Human | Colorectum | MSS | 1.07e-05 | 5.56e-01 | 0.294 |
| 7818 | DAP3 | HTA11_99999971662_82457 | Human | Colorectum | MSS | 2.58e-05 | 5.41e-01 | 0.3859 |
| 7818 | DAP3 | A015-C-203 | Human | Colorectum | FAP | 1.14e-19 | -3.58e-01 | -0.1294 |
| 7818 | DAP3 | A015-C-204 | Human | Colorectum | FAP | 3.68e-09 | -3.82e-01 | -0.0228 |
| 7818 | DAP3 | A014-C-040 | Human | Colorectum | FAP | 4.54e-04 | -4.77e-01 | -0.1184 |
| 7818 | DAP3 | A002-C-201 | Human | Colorectum | FAP | 3.91e-10 | -2.19e-01 | 0.0324 |
| 7818 | DAP3 | A001-C-119 | Human | Colorectum | FAP | 2.92e-02 | -1.06e-01 | -0.1557 |
| 7818 | DAP3 | A001-C-108 | Human | Colorectum | FAP | 1.73e-12 | -2.21e-01 | -0.0272 |
| 7818 | DAP3 | A002-C-205 | Human | Colorectum | FAP | 4.00e-15 | -2.23e-01 | -0.1236 |
| 7818 | DAP3 | A001-C-104 | Human | Colorectum | FAP | 8.36e-03 | -1.84e-01 | 0.0184 |
| 7818 | DAP3 | A015-C-005 | Human | Colorectum | FAP | 1.81e-02 | -2.02e-01 | -0.0336 |
| 7818 | DAP3 | A015-C-006 | Human | Colorectum | FAP | 1.43e-10 | -2.75e-01 | -0.0994 |
| 7818 | DAP3 | A015-C-106 | Human | Colorectum | FAP | 1.56e-07 | -2.17e-01 | -0.0511 |
| 7818 | DAP3 | A002-C-114 | Human | Colorectum | FAP | 7.23e-14 | -3.61e-01 | -0.1561 |
| Page: 1 2 3 4 5 6 7 8 9 |
| Tissue | Expression Dynamics | Abbreviation |
| Cervix | 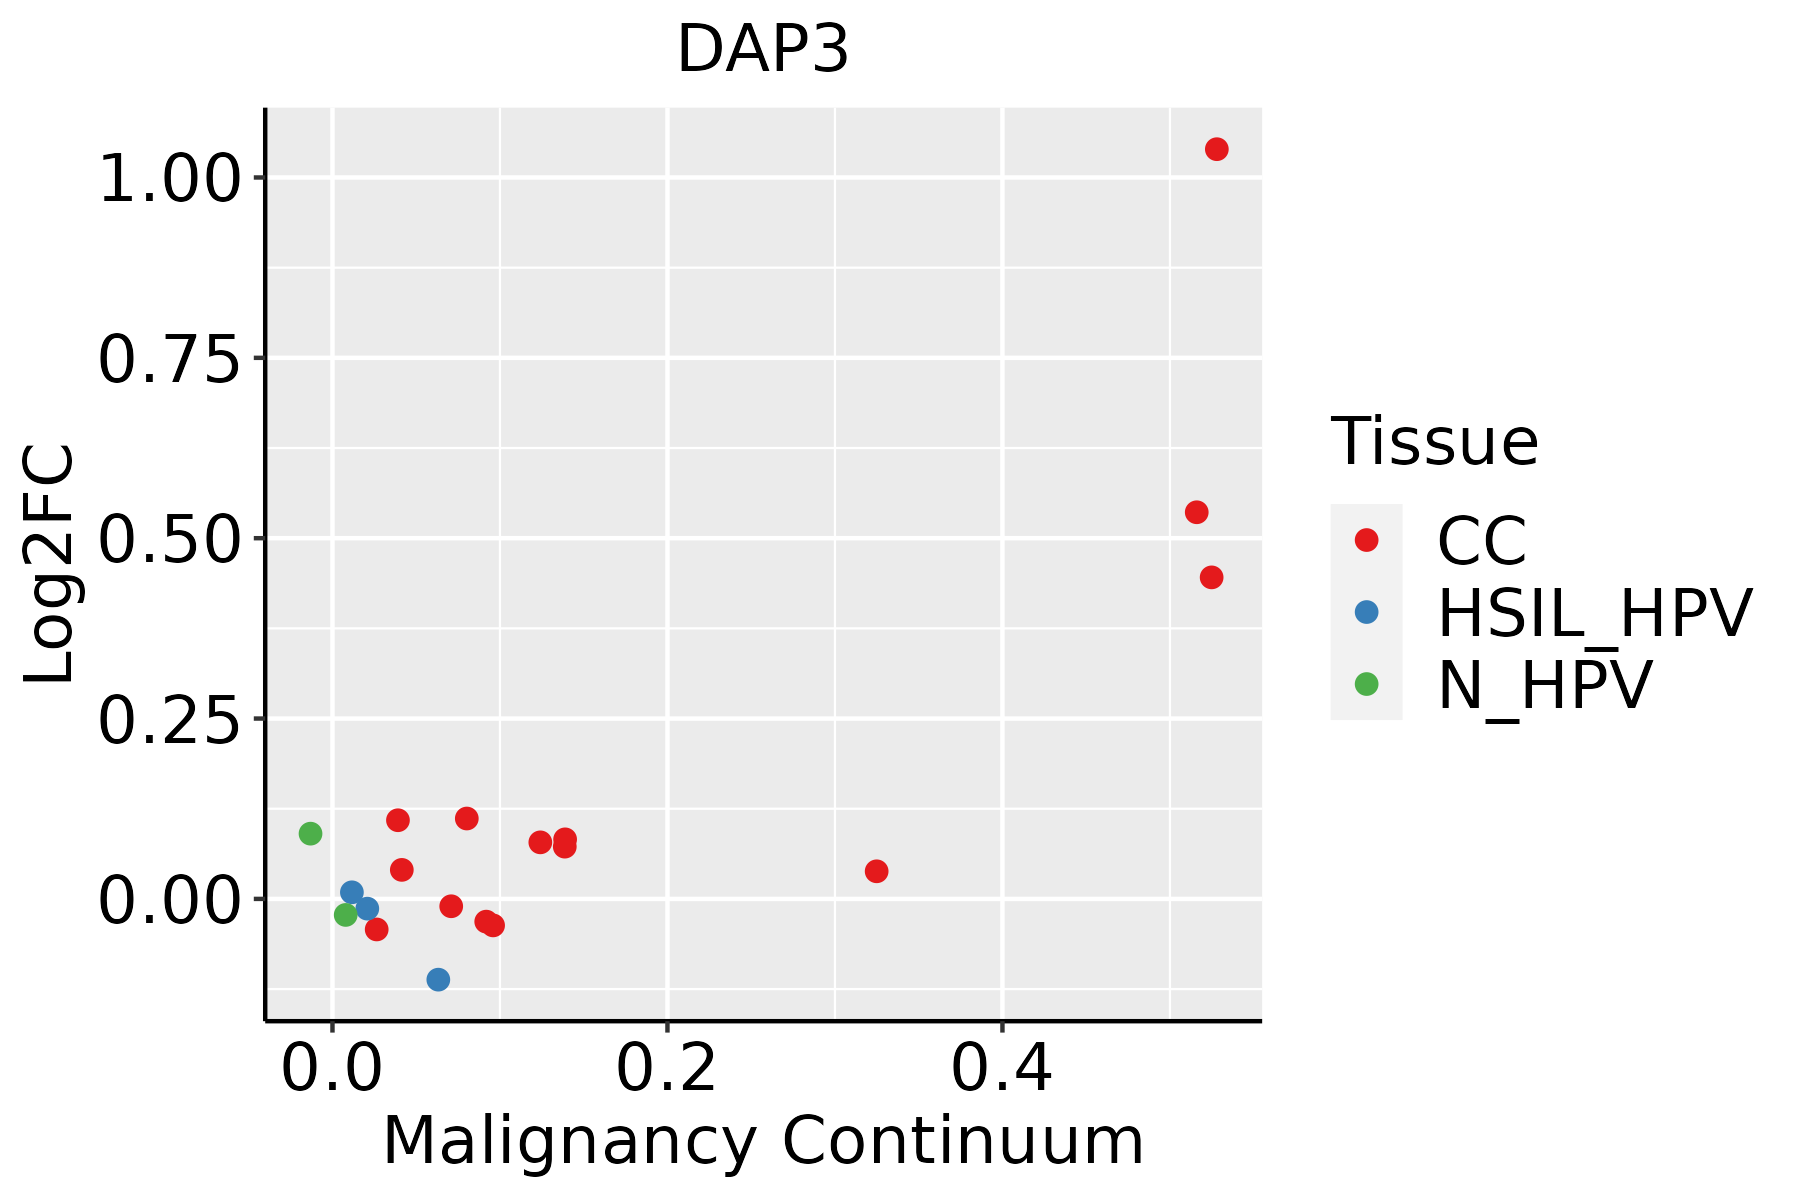 | CC: Cervix cancer |
| HSIL_HPV: HPV-infected high-grade squamous intraepithelial lesions | ||
| N_HPV: HPV-infected normal cervix | ||
| Colorectum (GSE201348) |  | FAP: Familial adenomatous polyposis |
| CRC: Colorectal cancer | ||
| Colorectum (HTA11) |  | AD: Adenomas |
| SER: Sessile serrated lesions | ||
| MSI-H: Microsatellite-high colorectal cancer | ||
| MSS: Microsatellite stable colorectal cancer | ||
| Esophagus | 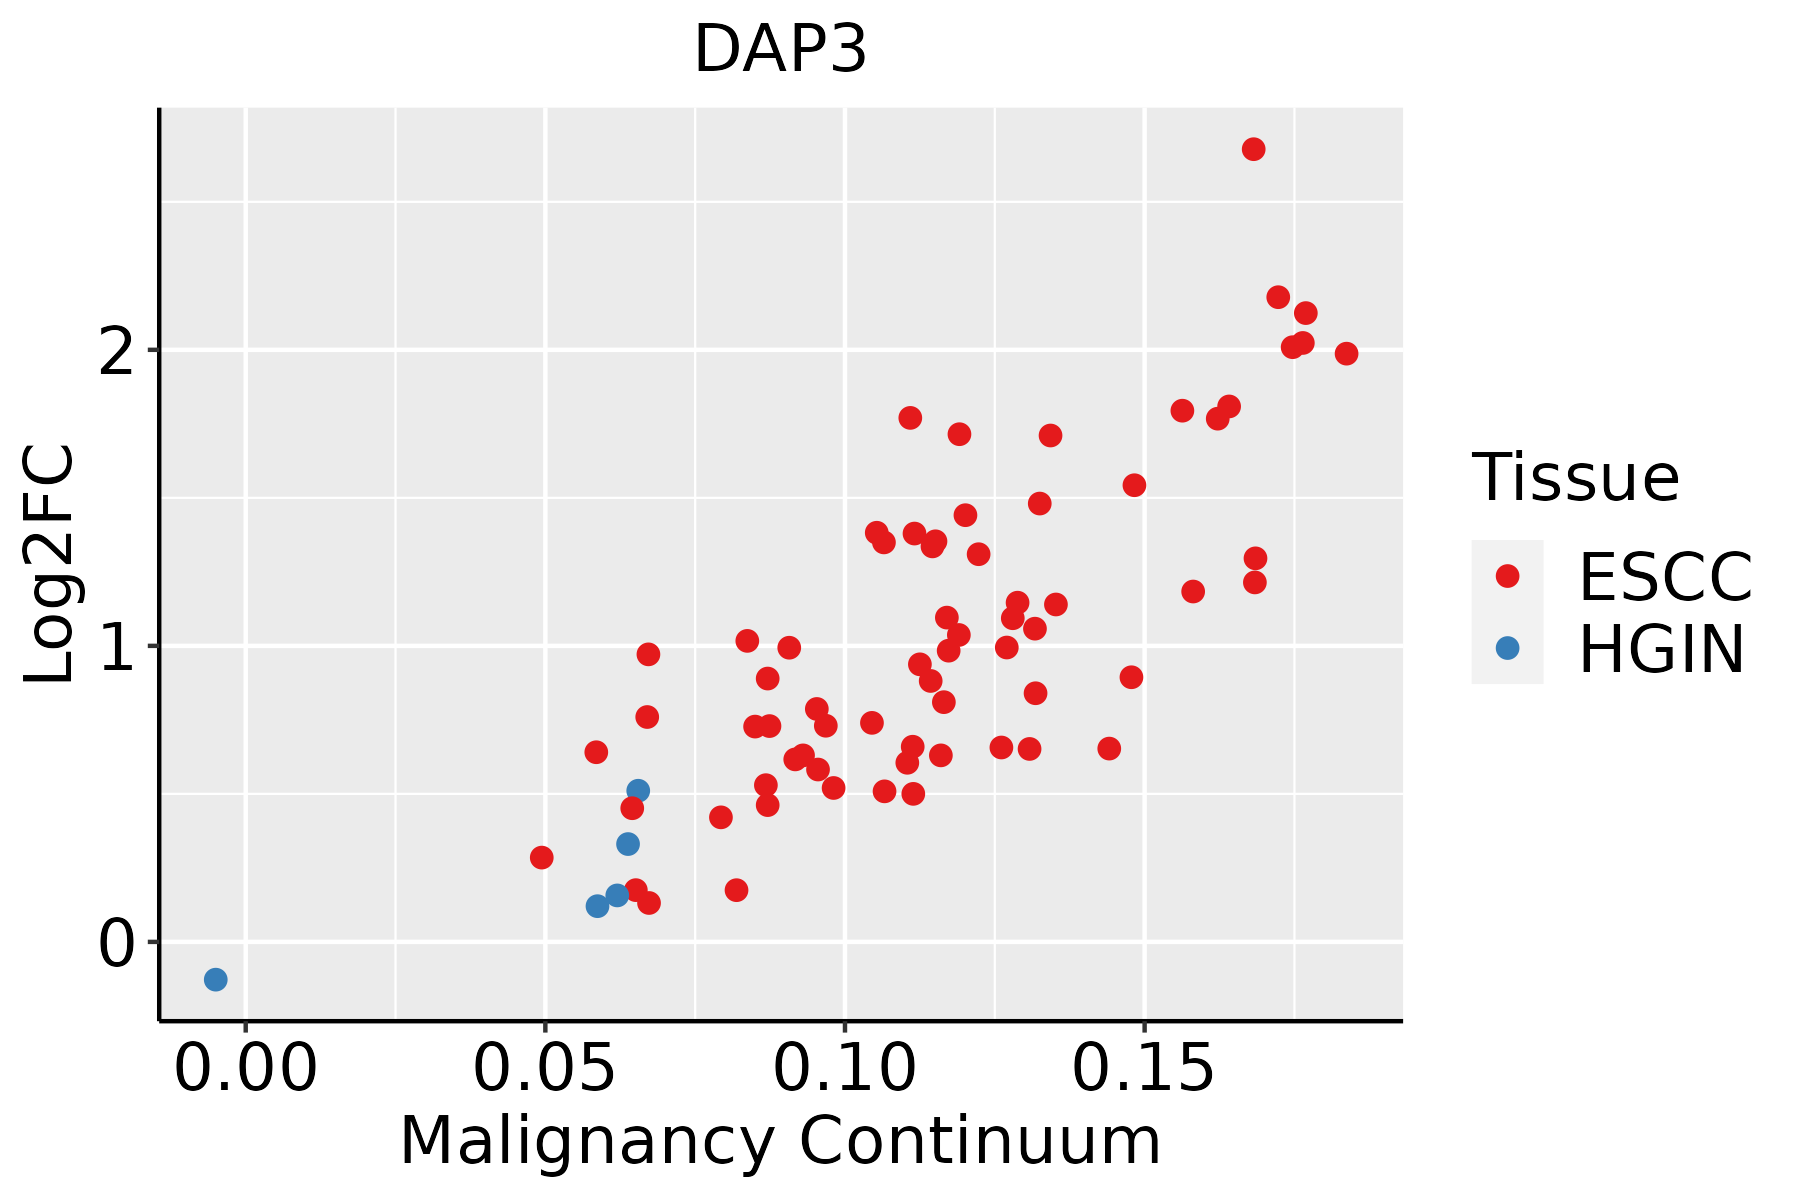 | ESCC: Esophageal squamous cell carcinoma |
| HGIN: High-grade intraepithelial neoplasias | ||
| LGIN: Low-grade intraepithelial neoplasias | ||
| Liver | 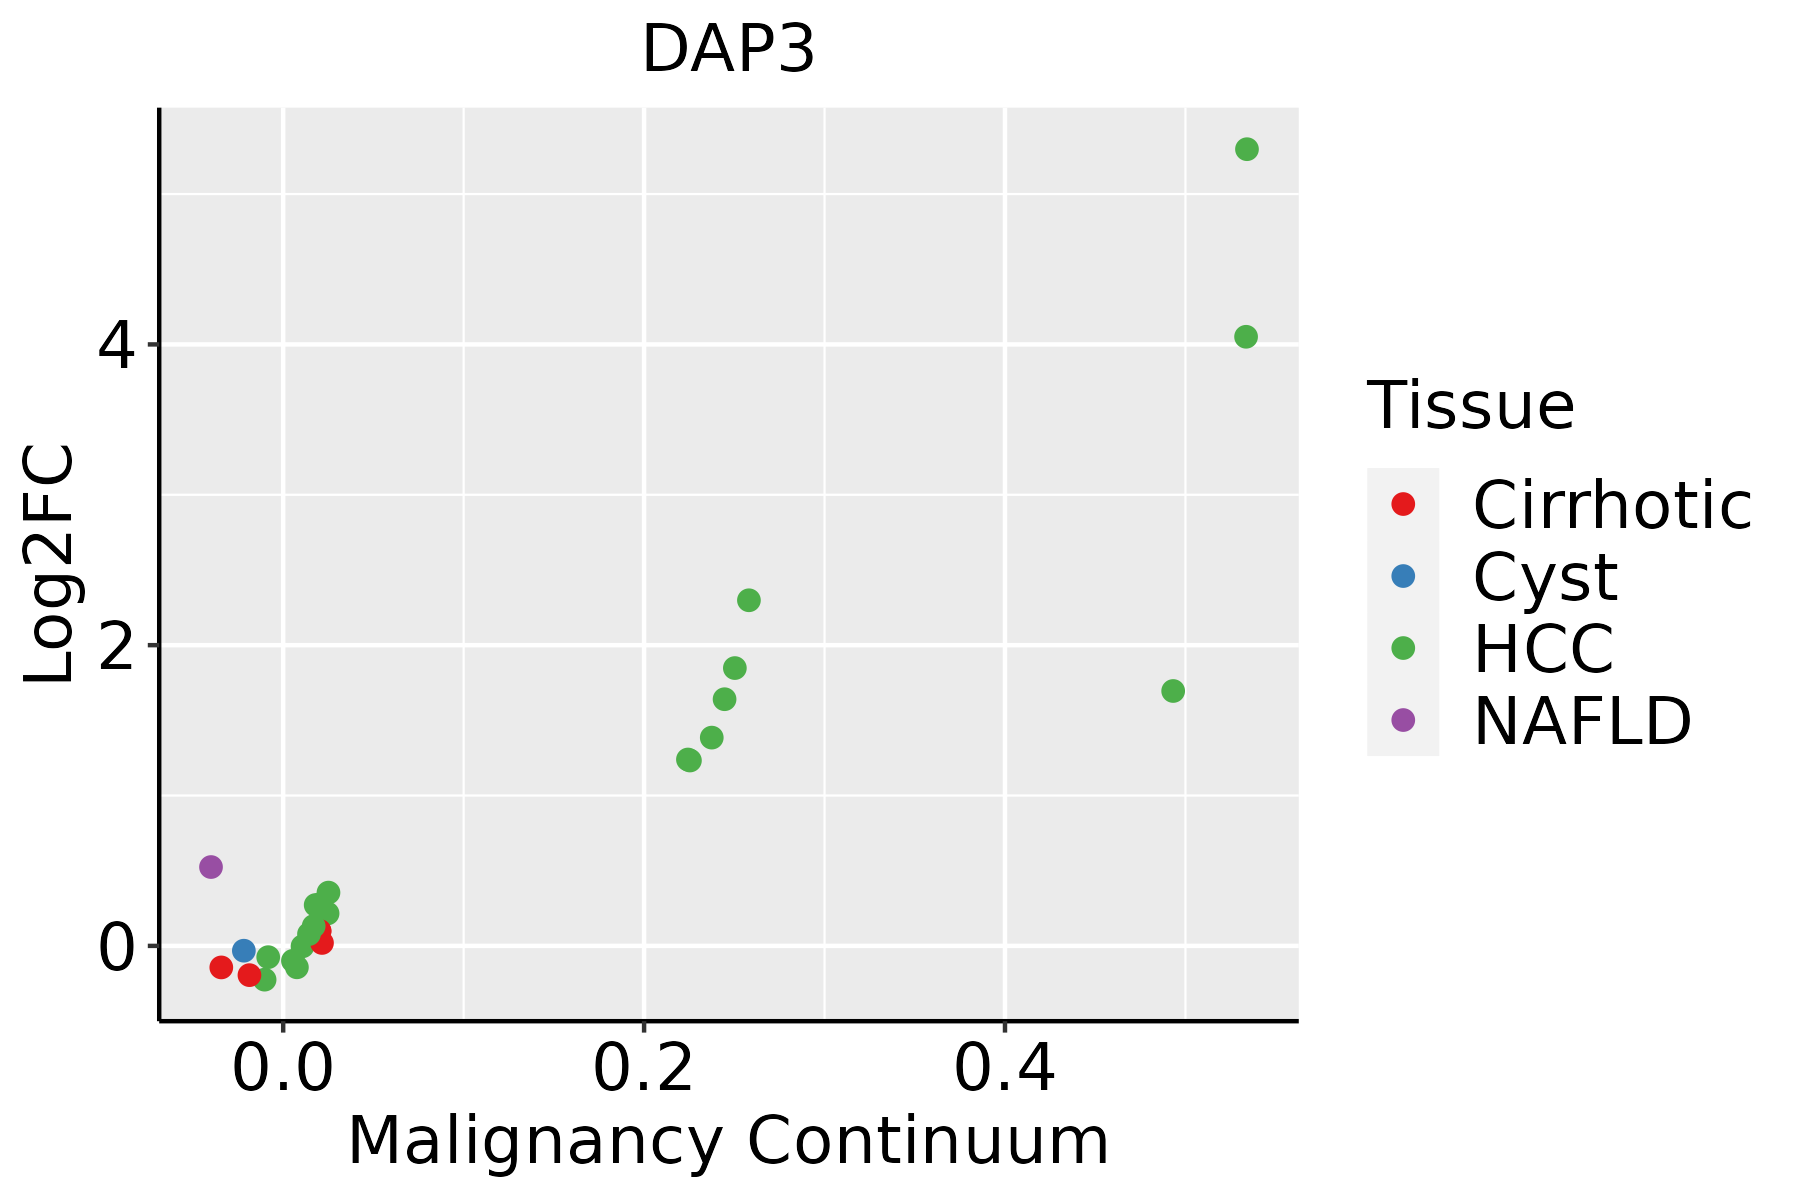 | HCC: Hepatocellular carcinoma |
| NAFLD: Non-alcoholic fatty liver disease | ||
| Lung | 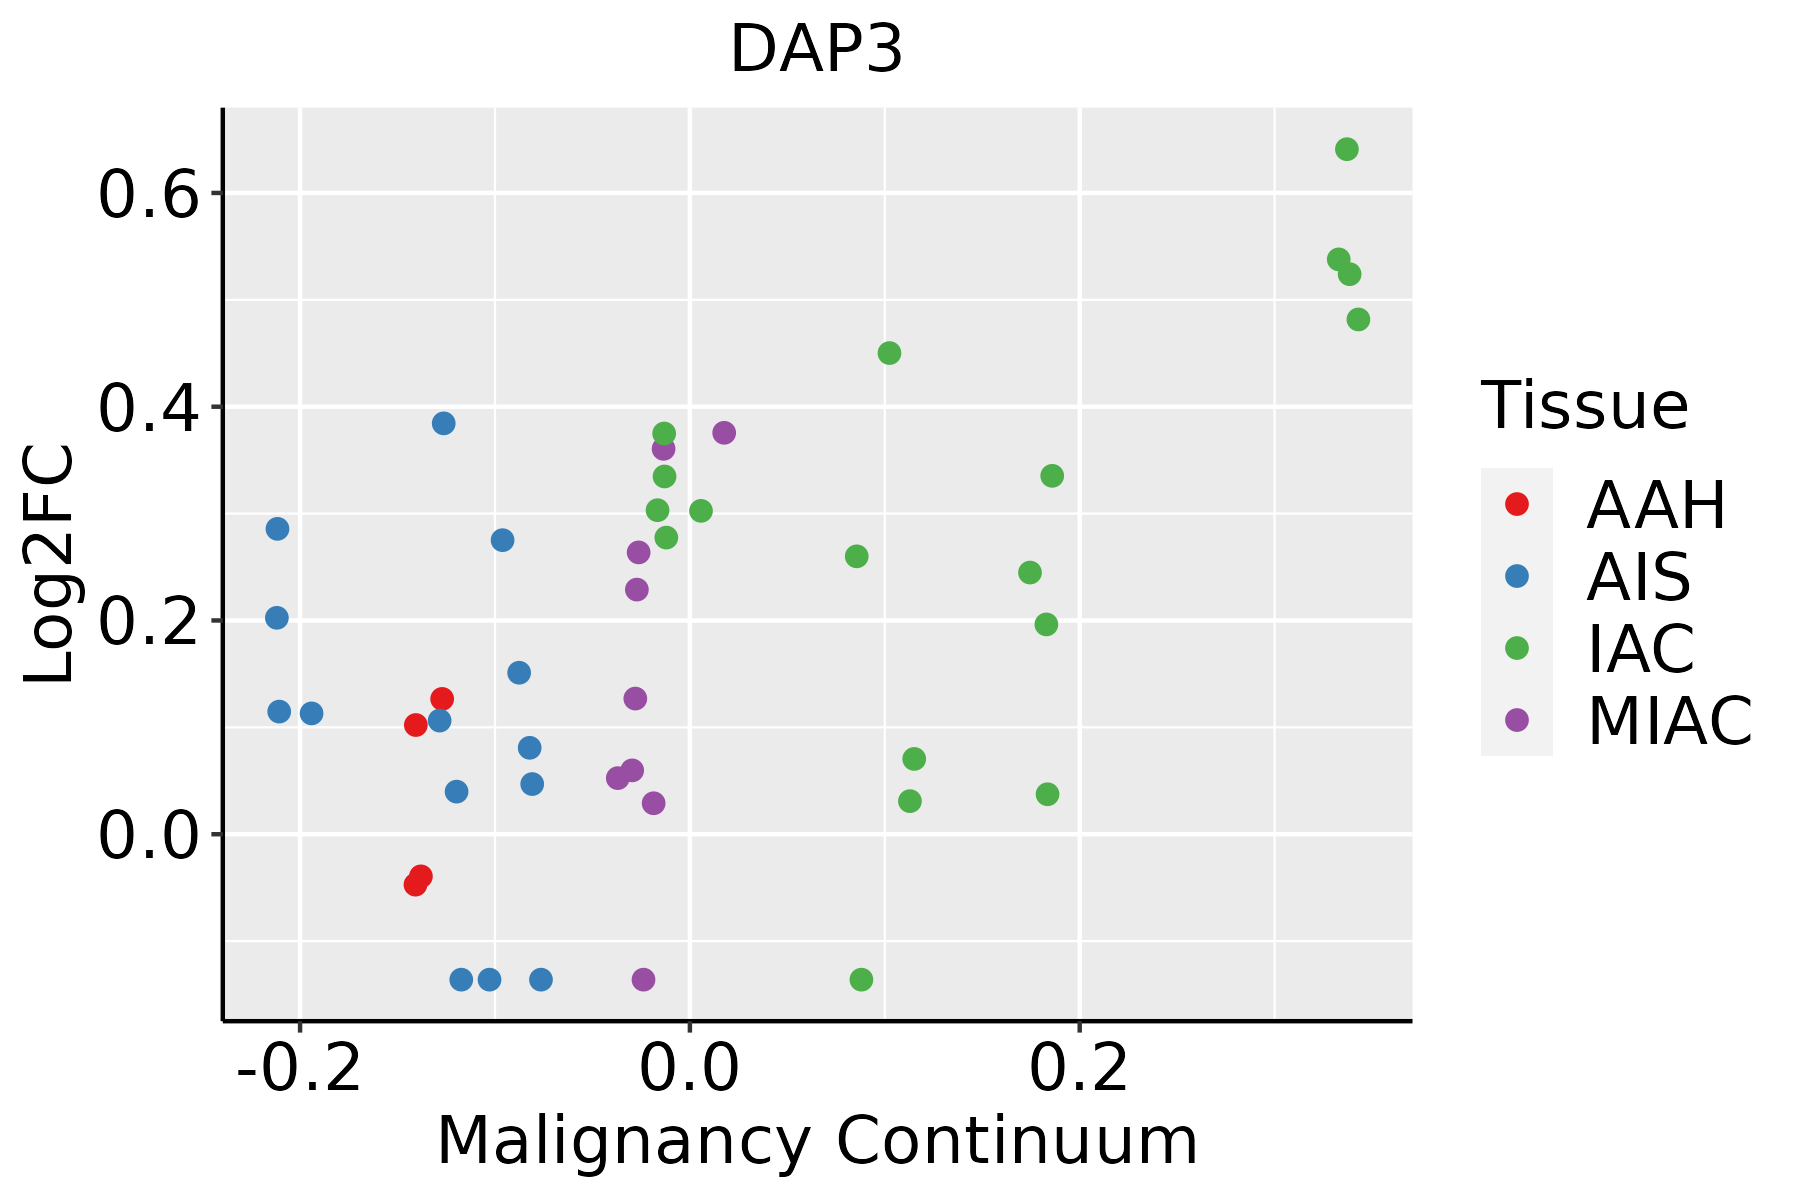 | AAH: Atypical adenomatous hyperplasia |
| AIS: Adenocarcinoma in situ | ||
| IAC: Invasive lung adenocarcinoma | ||
| MIA: Minimally invasive adenocarcinoma | ||
| Oral Cavity | 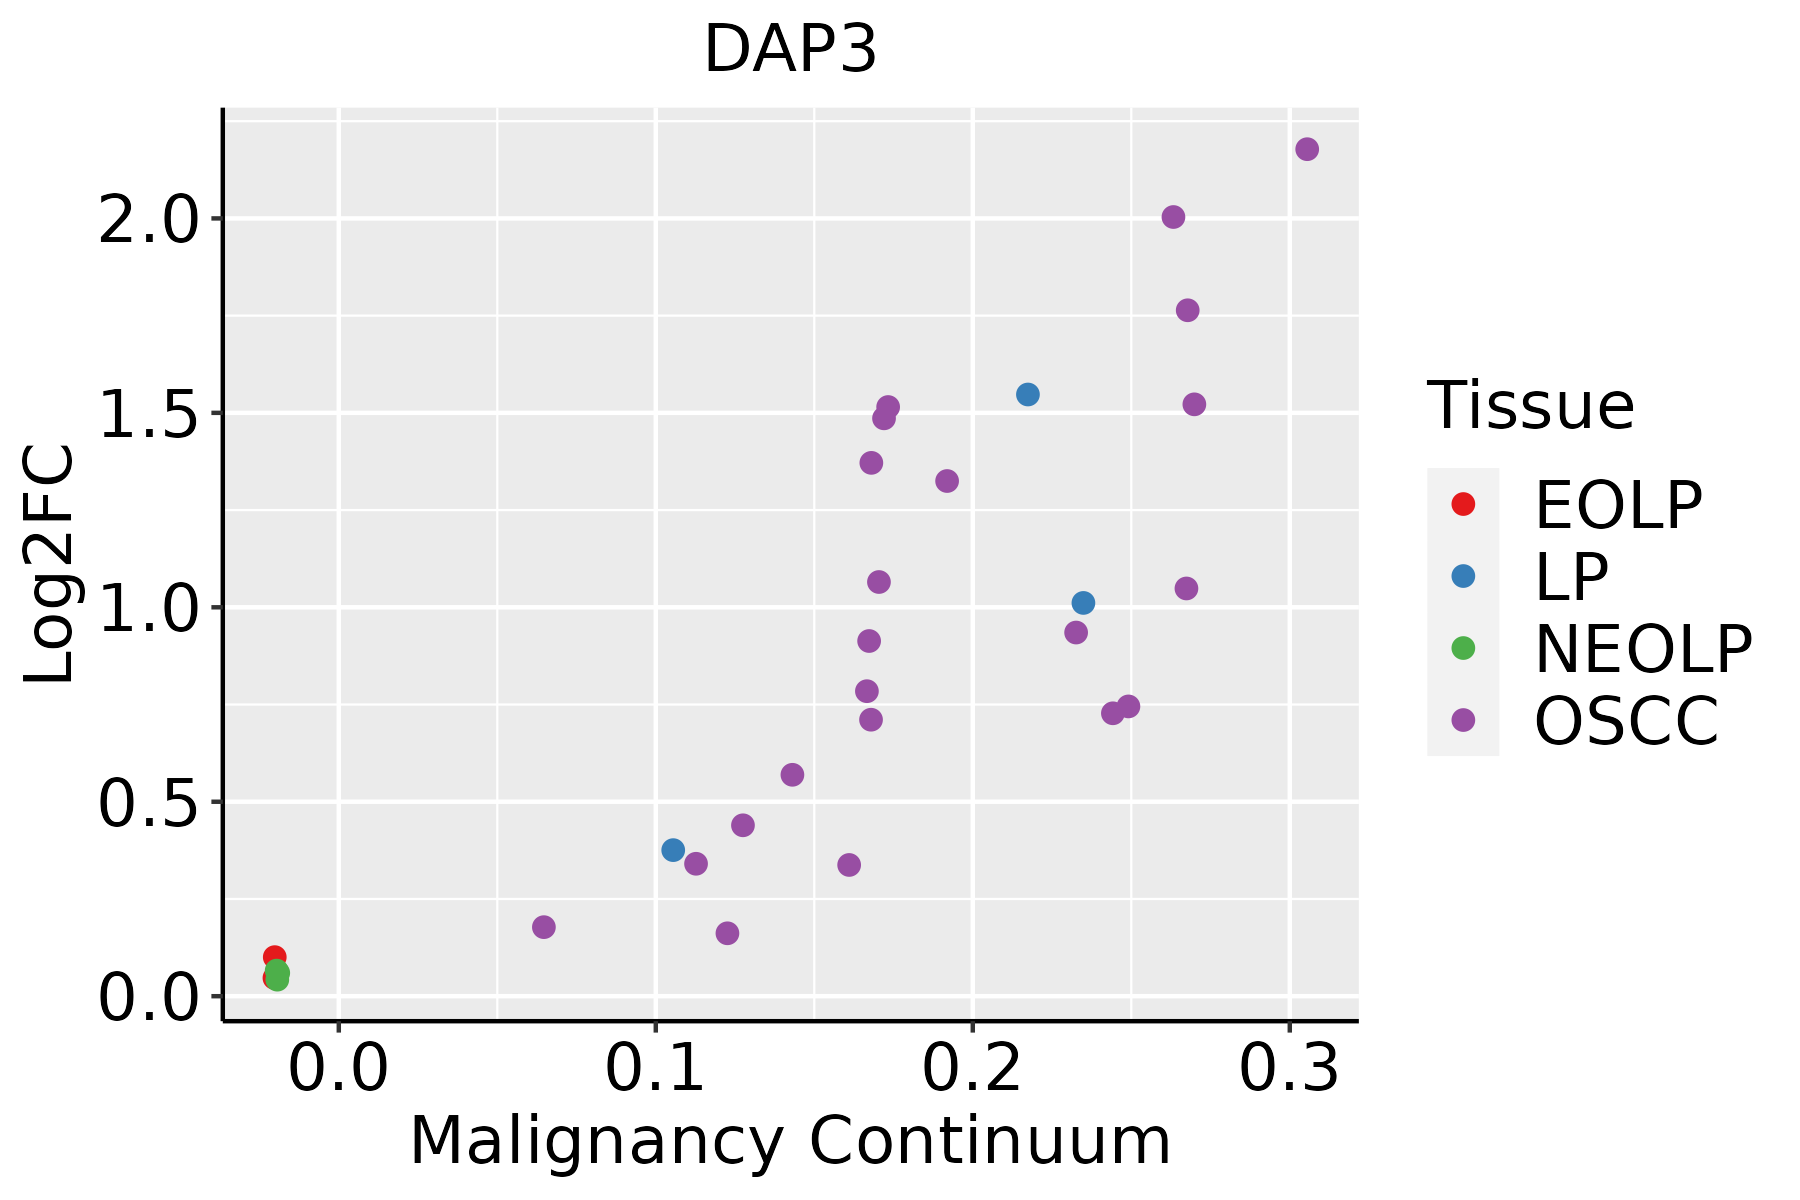 | EOLP: Erosive Oral lichen planus |
| LP: leukoplakia | ||
| NEOLP: Non-erosive oral lichen planus | ||
| OSCC: Oral squamous cell carcinoma | ||
| Skin | 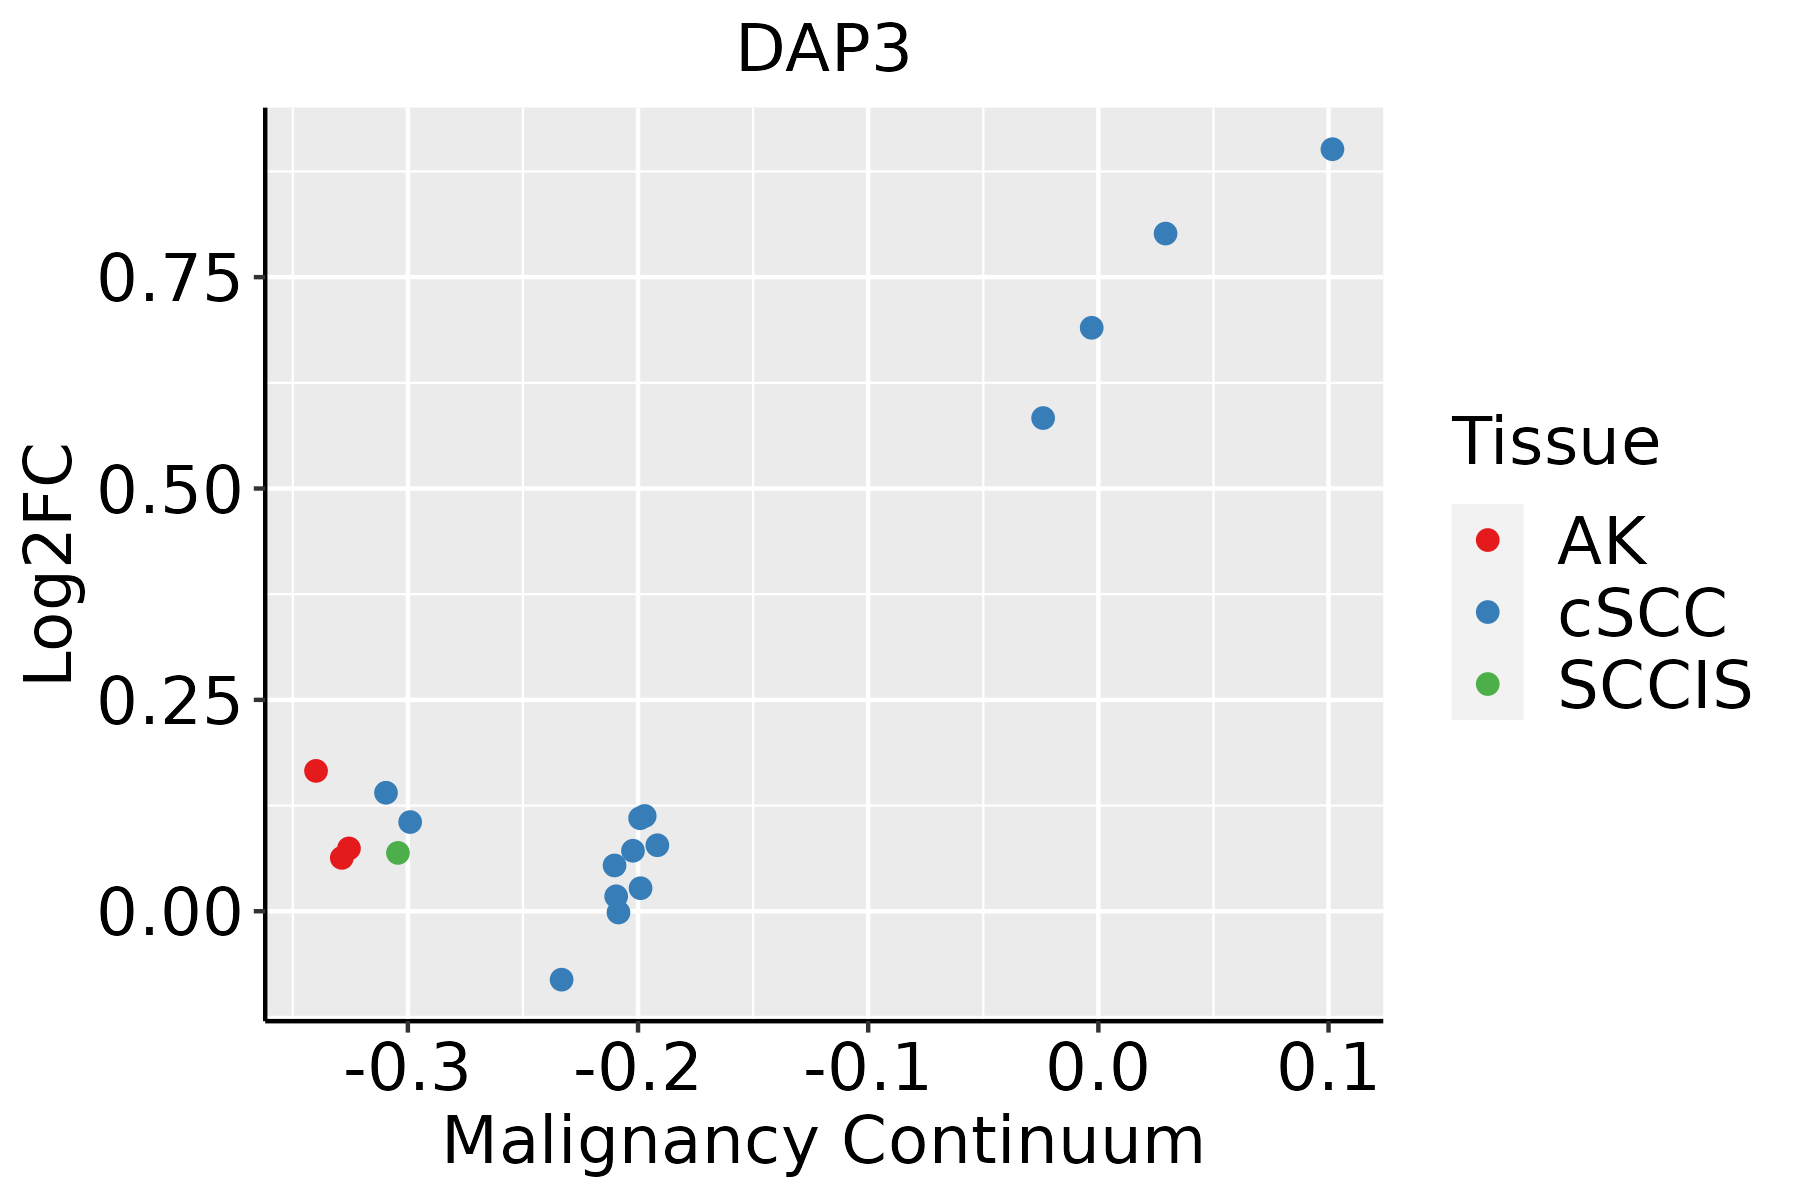 | AK: Actinic keratosis |
| cSCC: Cutaneous squamous cell carcinoma | ||
| SCCIS:squamous cell carcinoma in situ | ||
| Thyroid | 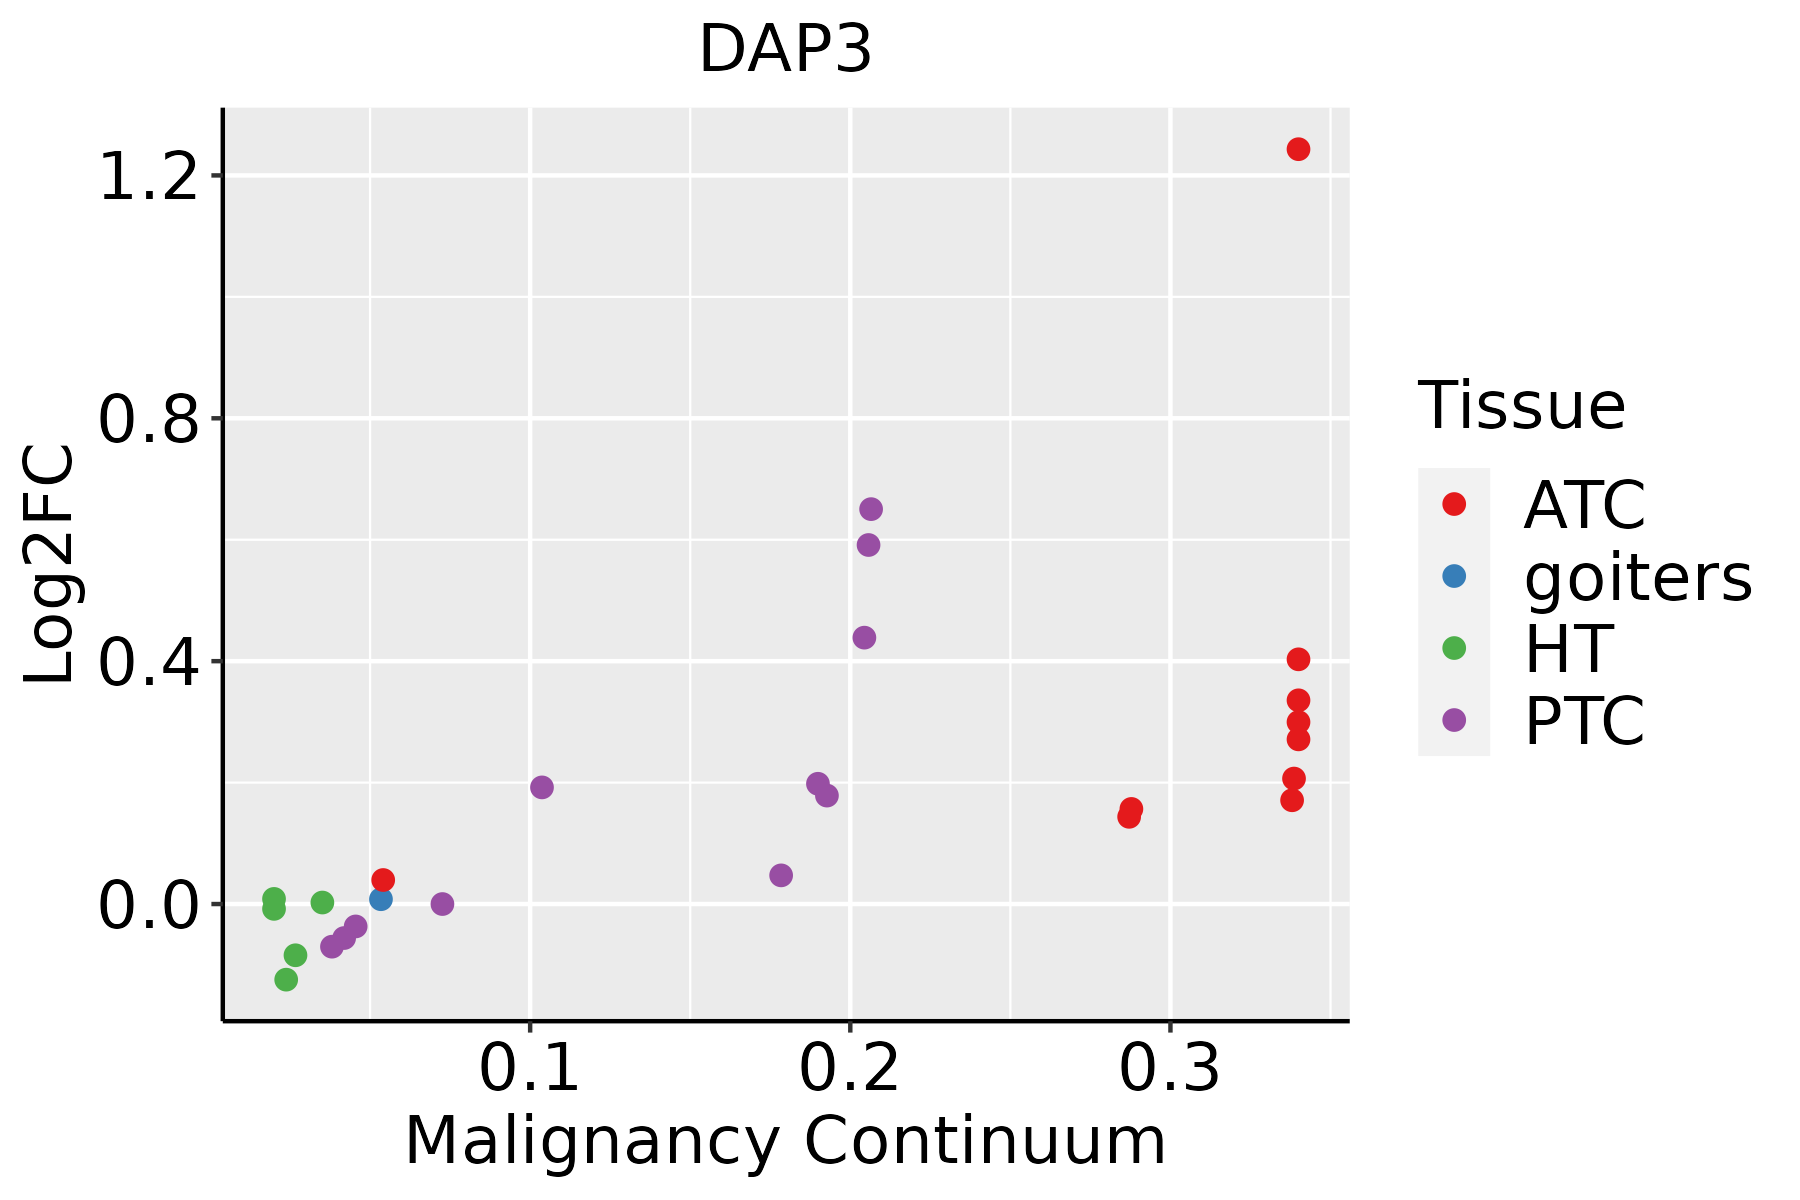 | ATC: Anaplastic thyroid cancer |
| HT: Hashimoto's thyroiditis | ||
| PTC: Papillary thyroid cancer |
| ∗log2FC in expression of this searched gene in stem-like cells from each diseased tissue sample relative to stem-like cells in normal samples in each tissue plotted against the malignancy continuum. Samples are colored based on if they are from different disease stage. |
Top |
Malignant transformation related pathway analysis |
| Find out the enriched GO biological processes and KEGG pathways involved in transition from healthy to precancer to cancer |
| Tissue | Disease Stage | Enriched GO biological Processes |
| Colorectum | AD |  |
| Colorectum | SER |  |
| Colorectum | MSS |  |
| Colorectum | MSI-H |  |
| Colorectum | FAP |  |
| ∗Top 15 enriched GO BP terms are showed in the bar plot of each disease state in each tissue. Each row represents a significant GO biological process which is colored according to the -log10(p.adjust). |
| Page: 1 2 3 4 5 6 7 8 9 |
| GO ID | Tissue | Disease Stage | Description | Gene Ratio | Bg Ratio | pvalue | p.adjust | Count |
| Page: 1 |
| Pathway ID | Tissue | Disease Stage | Description | Gene Ratio | Bg Ratio | pvalue | p.adjust | qvalue | Count |
| Page: 1 |
Top |
Cell-cell communication analysis |
| Identification of potential cell-cell interactions between two cell types and their ligand-receptor pairs for different disease states |
| Ligand | Receptor | LRpair | Pathway | Tissue | Disease Stage |
| Page: 1 |
Top |
Single-cell gene regulatory network inference analysis |
| Find out the significant the regulons (TFs) and the target genes of each regulon across cell types for different disease states |
| TF | Cell Type | Tissue | Disease Stage | Target Gene | RSS | Regulon Activity |
| ∗The dot plots of a searched regulon are shown for all cell subpopulations in each disease state of each tissue based on the regulon specific score inferred using pySCENIC and by calculating the average expression. |
| Page: 1 |
Top |
Somatic mutation of malignant transformation related genes |
| Annotation of somatic variants for genes involved in malignant transformation |
| Hugo Symbol | Variant Class | Variant Classification | dbSNP RS | HGVSc | HGVSp | HGVSp Short | SWISSPROT | BIOTYPE | SIFT | PolyPhen | Tumor Sample Barcode | Tissue | Histology | Sex | Age | Stage | Therapy Types | Drugs | Outcome |
| DAP3 | SNV | Missense_Mutation | c.163N>A | p.Asp55Asn | p.D55N | P51398 | protein_coding | tolerated(0.5) | benign(0.259) | TCGA-A1-A0SI-01 | Breast | breast invasive carcinoma | Female | <65 | I/II | Unknown | Unknown | SD | |
| DAP3 | SNV | Missense_Mutation | rs772026004 | c.1120G>A | p.Glu374Lys | p.E374K | P51398 | protein_coding | deleterious(0.02) | probably_damaging(0.945) | TCGA-A2-A0D2-01 | Breast | breast invasive carcinoma | Female | <65 | I/II | Chemotherapy | adriamycin | SD |
| DAP3 | SNV | Missense_Mutation | c.755C>G | p.Ser252Cys | p.S252C | P51398 | protein_coding | tolerated(0.2) | benign(0.017) | TCGA-A8-A09G-01 | Breast | breast invasive carcinoma | Female | >=65 | III/IV | Unknown | Unknown | SD | |
| DAP3 | SNV | Missense_Mutation | c.956N>A | p.Pro319His | p.P319H | P51398 | protein_coding | deleterious(0.01) | probably_damaging(0.963) | TCGA-C8-A12M-01 | Breast | breast invasive carcinoma | Female | >=65 | I/II | Unknown | Unknown | SD | |
| DAP3 | SNV | Missense_Mutation | c.103N>T | p.His35Tyr | p.H35Y | P51398 | protein_coding | deleterious(0.04) | benign(0.086) | TCGA-D8-A27G-01 | Breast | breast invasive carcinoma | Female | >=65 | I/II | Unknown | Unknown | SD | |
| DAP3 | SNV | Missense_Mutation | c.157G>A | p.Glu53Lys | p.E53K | P51398 | protein_coding | deleterious(0) | benign(0.424) | TCGA-DS-A1OC-01 | Cervix | cervical & endocervical cancer | Female | <65 | I/II | Chemotherapy | gemcitabine | SD | |
| DAP3 | SNV | Missense_Mutation | c.1123N>C | p.Glu375Gln | p.E375Q | P51398 | protein_coding | deleterious(0.02) | possibly_damaging(0.85) | TCGA-JW-A5VL-01 | Cervix | cervical & endocervical cancer | Female | <65 | I/II | Unknown | Unknown | SD | |
| DAP3 | SNV | Missense_Mutation | rs759970366 | c.175N>T | p.His59Tyr | p.H59Y | P51398 | protein_coding | deleterious(0) | probably_damaging(0.952) | TCGA-VS-A9UI-01 | Cervix | cervical & endocervical cancer | Female | >=65 | I/II | Unknown | Unknown | SD |
| DAP3 | SNV | Missense_Mutation | rs772121458 | c.496C>T | p.Arg166Trp | p.R166W | P51398 | protein_coding | tolerated(0.07) | benign(0.018) | TCGA-AA-3510-01 | Colorectum | colon adenocarcinoma | Male | >=65 | I/II | Unknown | Unknown | SD |
| DAP3 | SNV | Missense_Mutation | c.368N>A | p.Arg123Gln | p.R123Q | P51398 | protein_coding | deleterious(0) | probably_damaging(0.995) | TCGA-AA-3841-01 | Colorectum | colon adenocarcinoma | Male | >=65 | I/II | Chemotherapy | folinic | CR |
| Page: 1 2 3 4 |
Top |
Related drugs of malignant transformation related genes |
| Identification of chemicals and drugs interact with genes involved in malignant transfromation |
| (DGIdb 4.0) |
| Entrez ID | Symbol | Category | Interaction Types | Drug Claim Name | Drug Name | PMIDs |
| Page: 1 |

Copyright 2023-Present -The University of Texas Health Science Center at Houston |