
|
|||||
|
 | |
| |
| |
| |
| |
| |
|
Gene: DAD1 |
Gene summary for DAD1 |
| Gene information | Species | Human | Gene symbol | DAD1 | Gene ID | 1603 |
| Gene name | defender against cell death 1 | |
| Gene Alias | OST2 | |
| Cytomap | 14q11.2 | |
| Gene Type | protein-coding | GO ID | GO:0001701 | UniProtAcc | P61803 |
Top |
Malignant transformation analysis |
| Identification of the aberrant gene expression in precancerous and cancerous lesions by comparing the gene expression of stem-like cells in diseased tissues with normal stem cells |
| Entrez ID | Symbol | Replicates | Species | Organ | Tissue | Adj P-value | Log2FC | Malignancy |
| 1603 | DAD1 | CA_HPV_1 | Human | Cervix | CC | 5.44e-09 | -3.74e-01 | 0.0264 |
| 1603 | DAD1 | CA_HPV_3 | Human | Cervix | CC | 1.11e-03 | 3.32e-02 | 0.0414 |
| 1603 | DAD1 | CCI_1 | Human | Cervix | CC | 6.21e-16 | -9.27e-01 | 0.528 |
| 1603 | DAD1 | CCI_2 | Human | Cervix | CC | 2.12e-07 | -7.05e-01 | 0.5249 |
| 1603 | DAD1 | CCI_3 | Human | Cervix | CC | 3.02e-19 | -9.06e-01 | 0.516 |
| 1603 | DAD1 | CCII_1 | Human | Cervix | CC | 1.39e-31 | -9.56e-01 | 0.3249 |
| 1603 | DAD1 | sample3 | Human | Cervix | CC | 4.43e-05 | -1.13e-01 | 0.1387 |
| 1603 | DAD1 | L1 | Human | Cervix | CC | 1.64e-09 | -4.18e-01 | 0.0802 |
| 1603 | DAD1 | T3 | Human | Cervix | CC | 8.35e-04 | -6.02e-02 | 0.1389 |
| 1603 | DAD1 | HTA11_347_2000001011 | Human | Colorectum | AD | 1.27e-02 | 1.76e-01 | -0.1954 |
| 1603 | DAD1 | HTA11_696_2000001011 | Human | Colorectum | AD | 5.88e-04 | 2.31e-01 | -0.1464 |
| 1603 | DAD1 | HTA11_1391_2000001011 | Human | Colorectum | AD | 1.96e-02 | 2.96e-01 | -0.059 |
| 1603 | DAD1 | HTA11_5212_2000001011 | Human | Colorectum | AD | 1.22e-02 | 3.57e-01 | -0.2061 |
| 1603 | DAD1 | HTA11_99999970781_79442 | Human | Colorectum | MSS | 1.65e-02 | 2.00e-01 | 0.294 |
| 1603 | DAD1 | AEH-subject1 | Human | Endometrium | AEH | 2.30e-29 | -6.03e-01 | -0.3059 |
| 1603 | DAD1 | AEH-subject2 | Human | Endometrium | AEH | 6.39e-25 | -6.09e-01 | -0.2525 |
| 1603 | DAD1 | AEH-subject3 | Human | Endometrium | AEH | 3.61e-22 | -4.14e-01 | -0.2576 |
| 1603 | DAD1 | AEH-subject4 | Human | Endometrium | AEH | 1.40e-09 | -3.66e-01 | -0.2657 |
| 1603 | DAD1 | AEH-subject5 | Human | Endometrium | AEH | 5.27e-16 | -4.26e-01 | -0.2953 |
| 1603 | DAD1 | EEC-subject1 | Human | Endometrium | EEC | 9.71e-22 | -5.45e-01 | -0.2682 |
| Page: 1 2 3 4 5 6 7 8 9 10 11 12 |
| Tissue | Expression Dynamics | Abbreviation |
| Cervix | 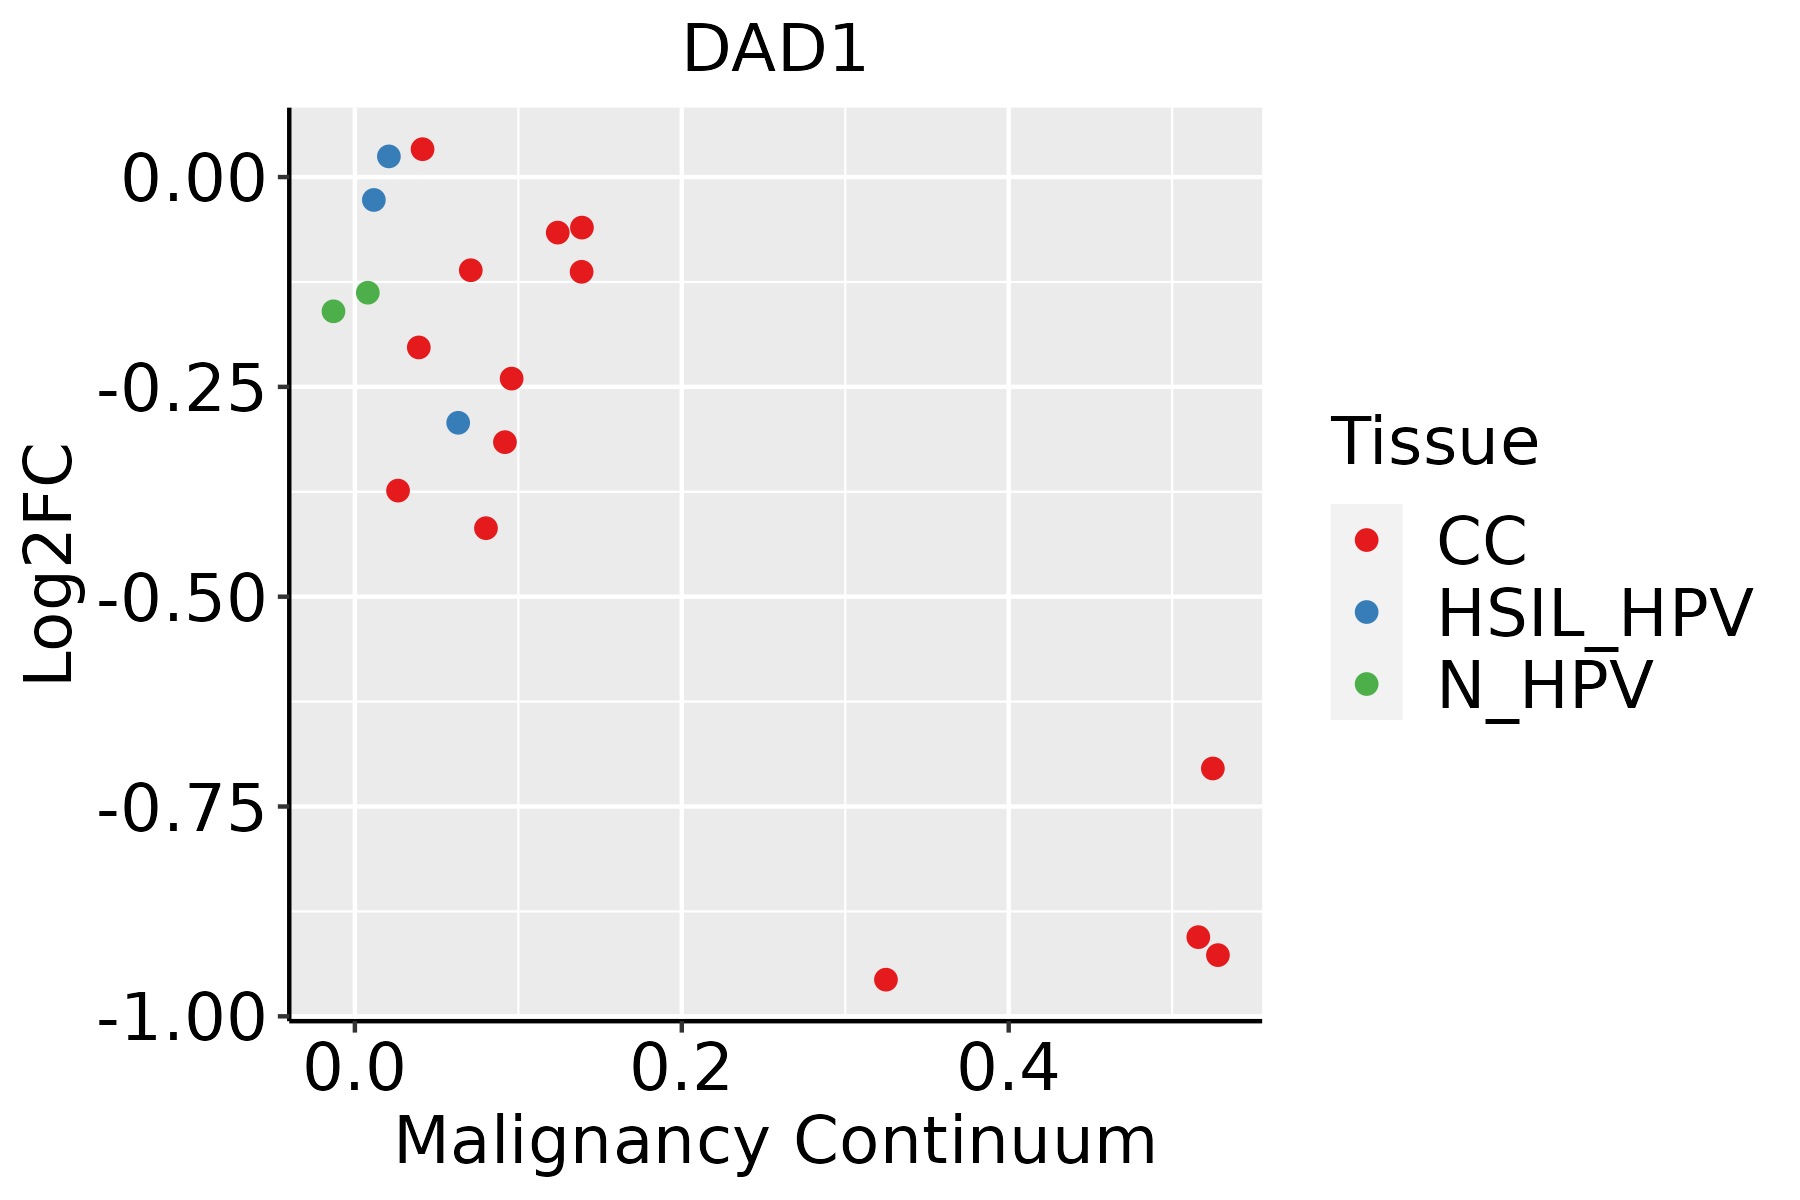 | CC: Cervix cancer |
| HSIL_HPV: HPV-infected high-grade squamous intraepithelial lesions | ||
| N_HPV: HPV-infected normal cervix | ||
| Colorectum (GSE201348) |  | FAP: Familial adenomatous polyposis |
| CRC: Colorectal cancer | ||
| Colorectum (HTA11) |  | AD: Adenomas |
| SER: Sessile serrated lesions | ||
| MSI-H: Microsatellite-high colorectal cancer | ||
| MSS: Microsatellite stable colorectal cancer | ||
| Endometrium | 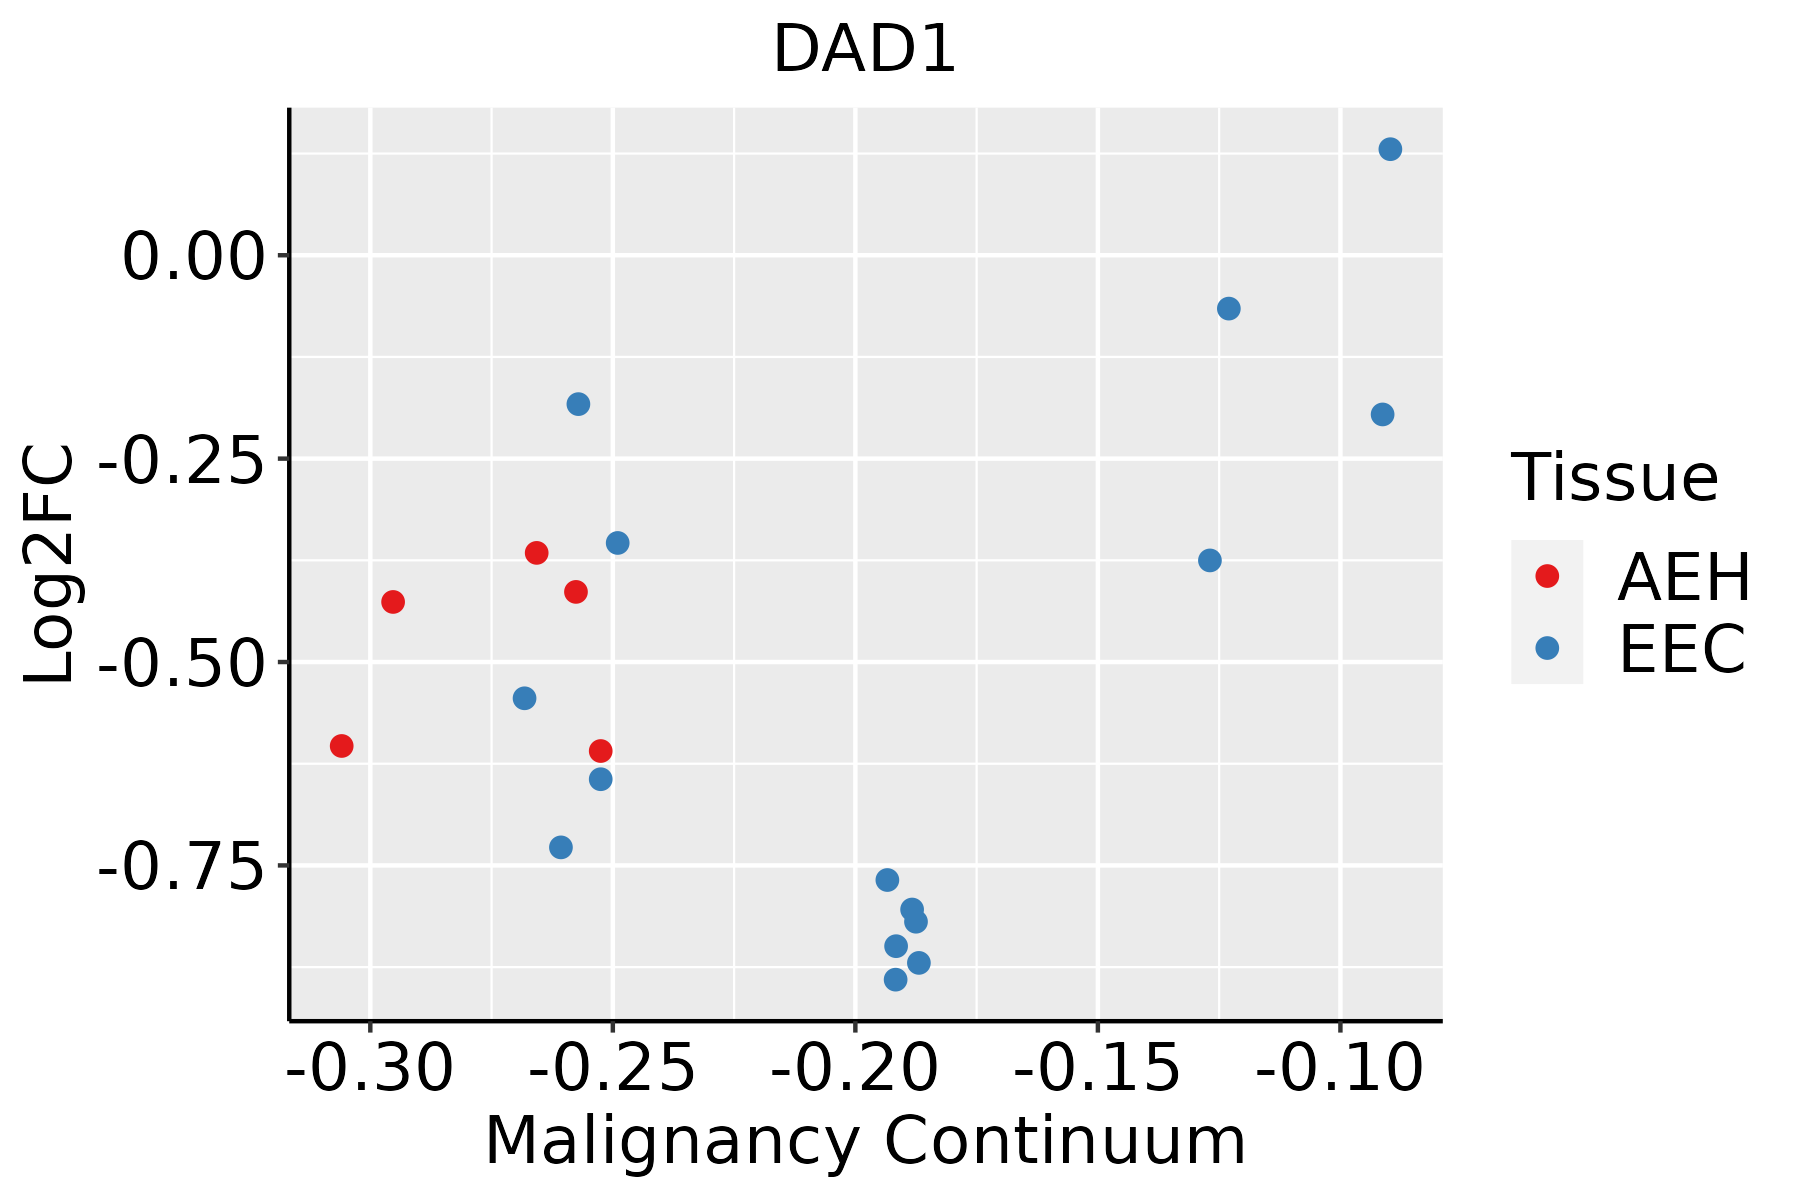 | AEH: Atypical endometrial hyperplasia |
| EEC: Endometrioid Cancer | ||
| Esophagus | 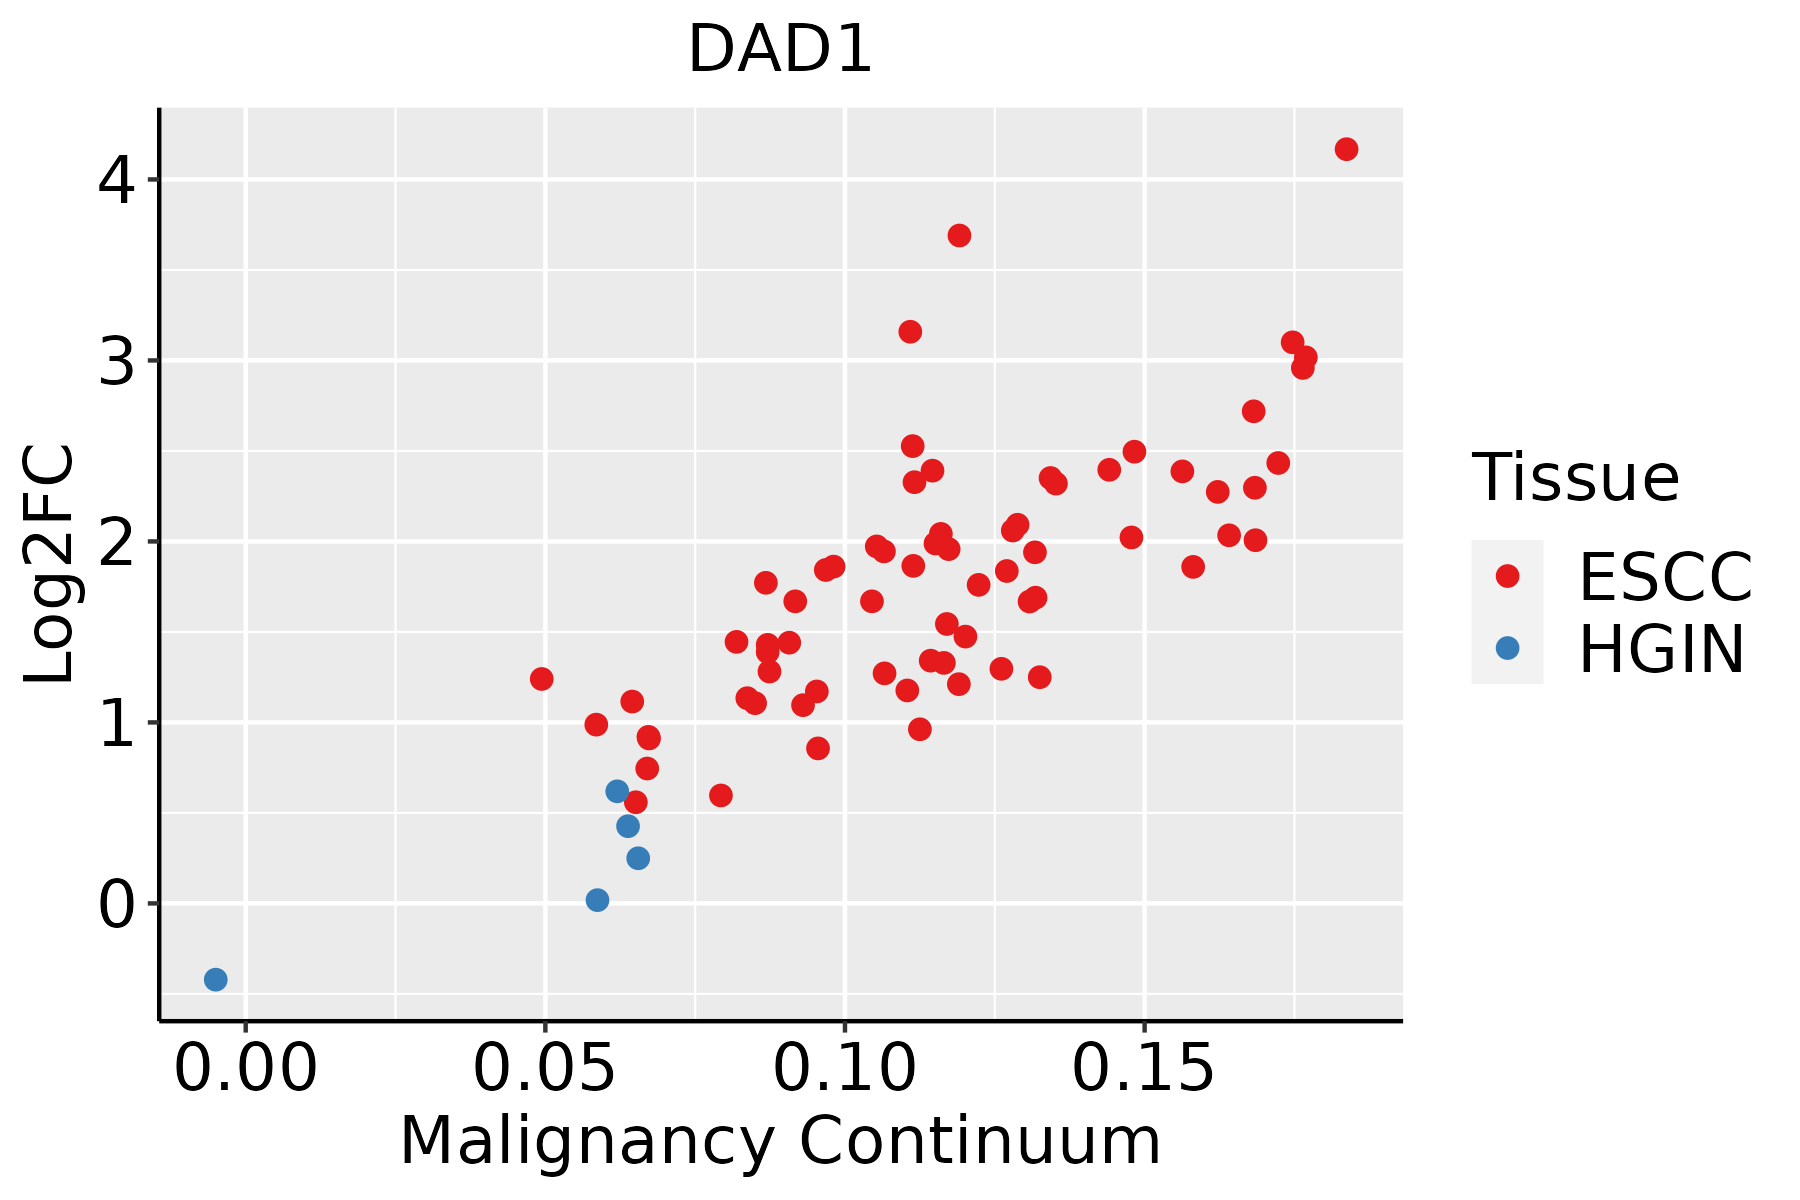 | ESCC: Esophageal squamous cell carcinoma |
| HGIN: High-grade intraepithelial neoplasias | ||
| LGIN: Low-grade intraepithelial neoplasias | ||
| GC | 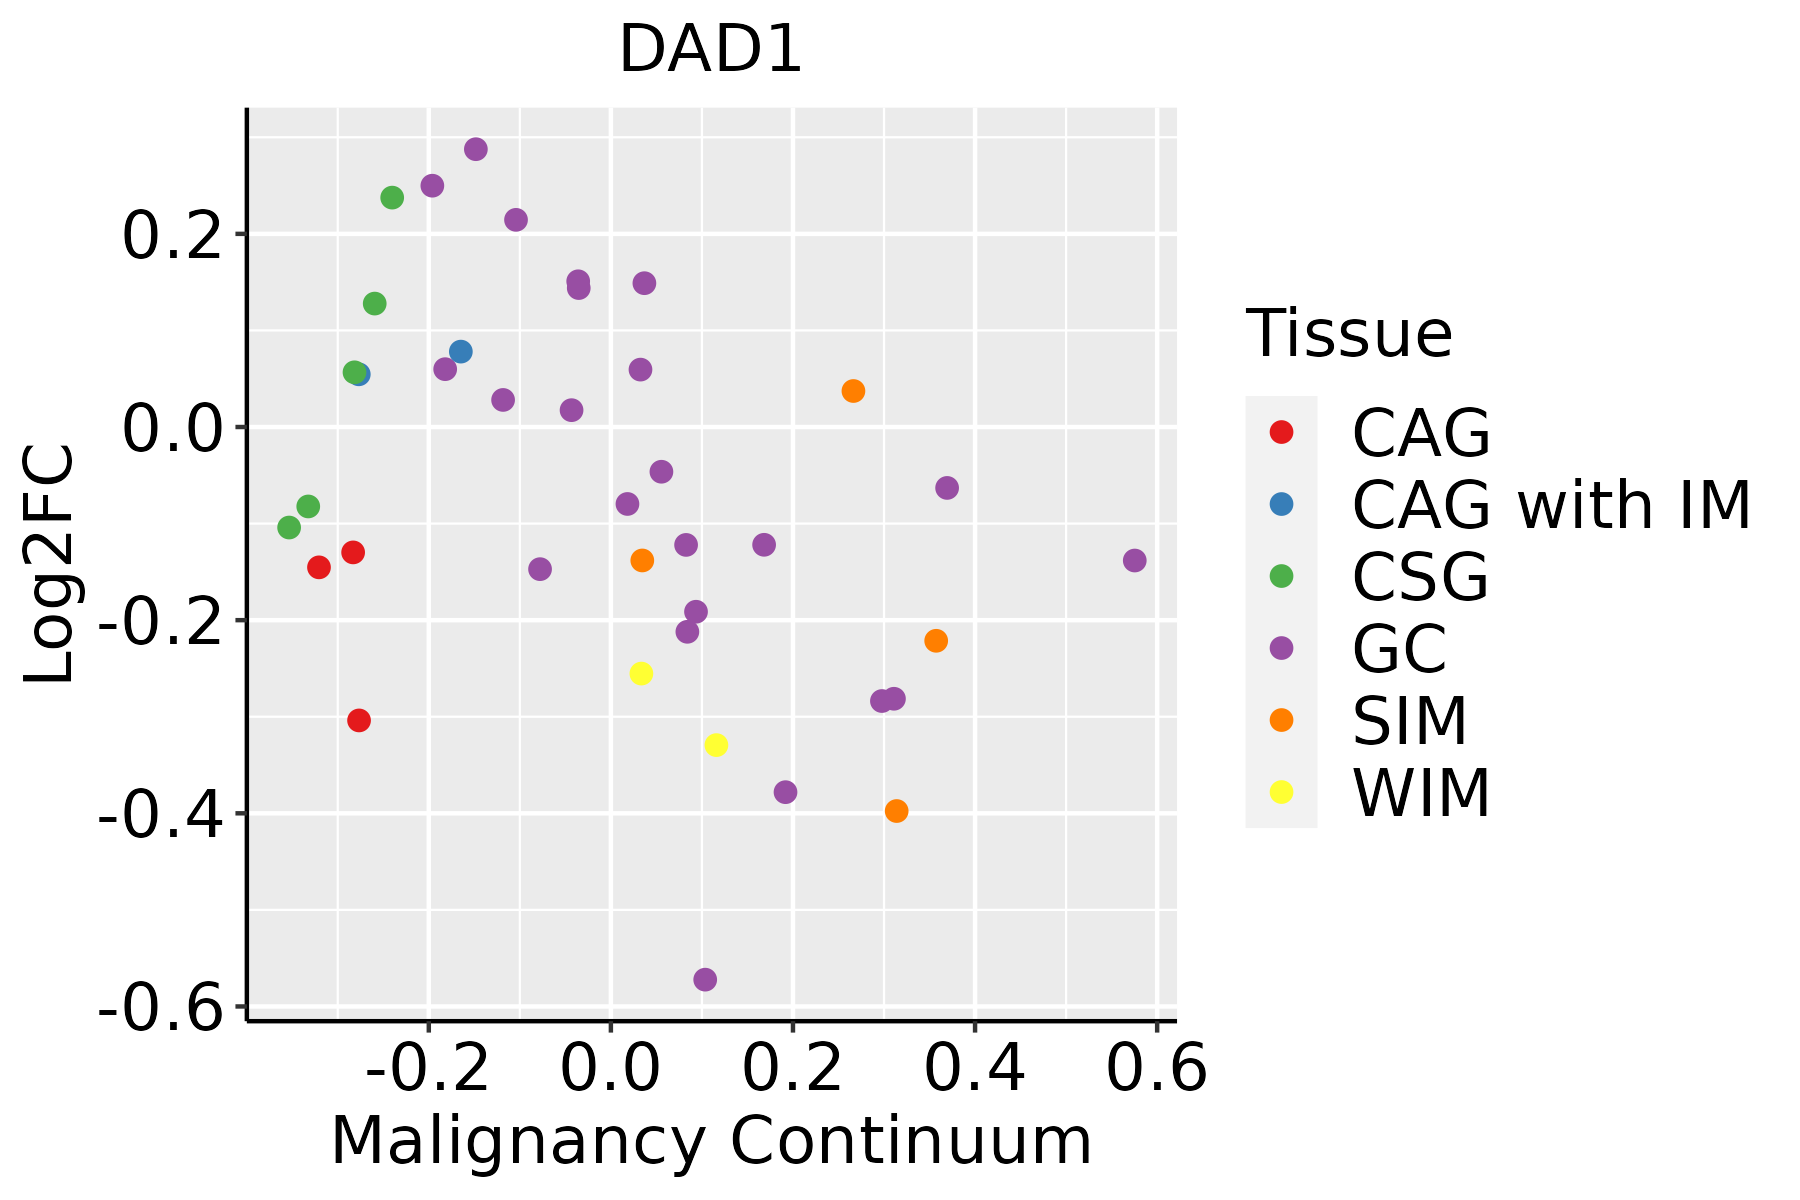 | CAG: Chronic atrophic gastritis |
| CAG with IM: Chronic atrophic gastritis with intestinal metaplasia | ||
| CSG: Chronic superficial gastritis | ||
| GC: Gastric cancer | ||
| SIM: Severe intestinal metaplasia | ||
| WIM: Wild intestinal metaplasia | ||
| Liver | 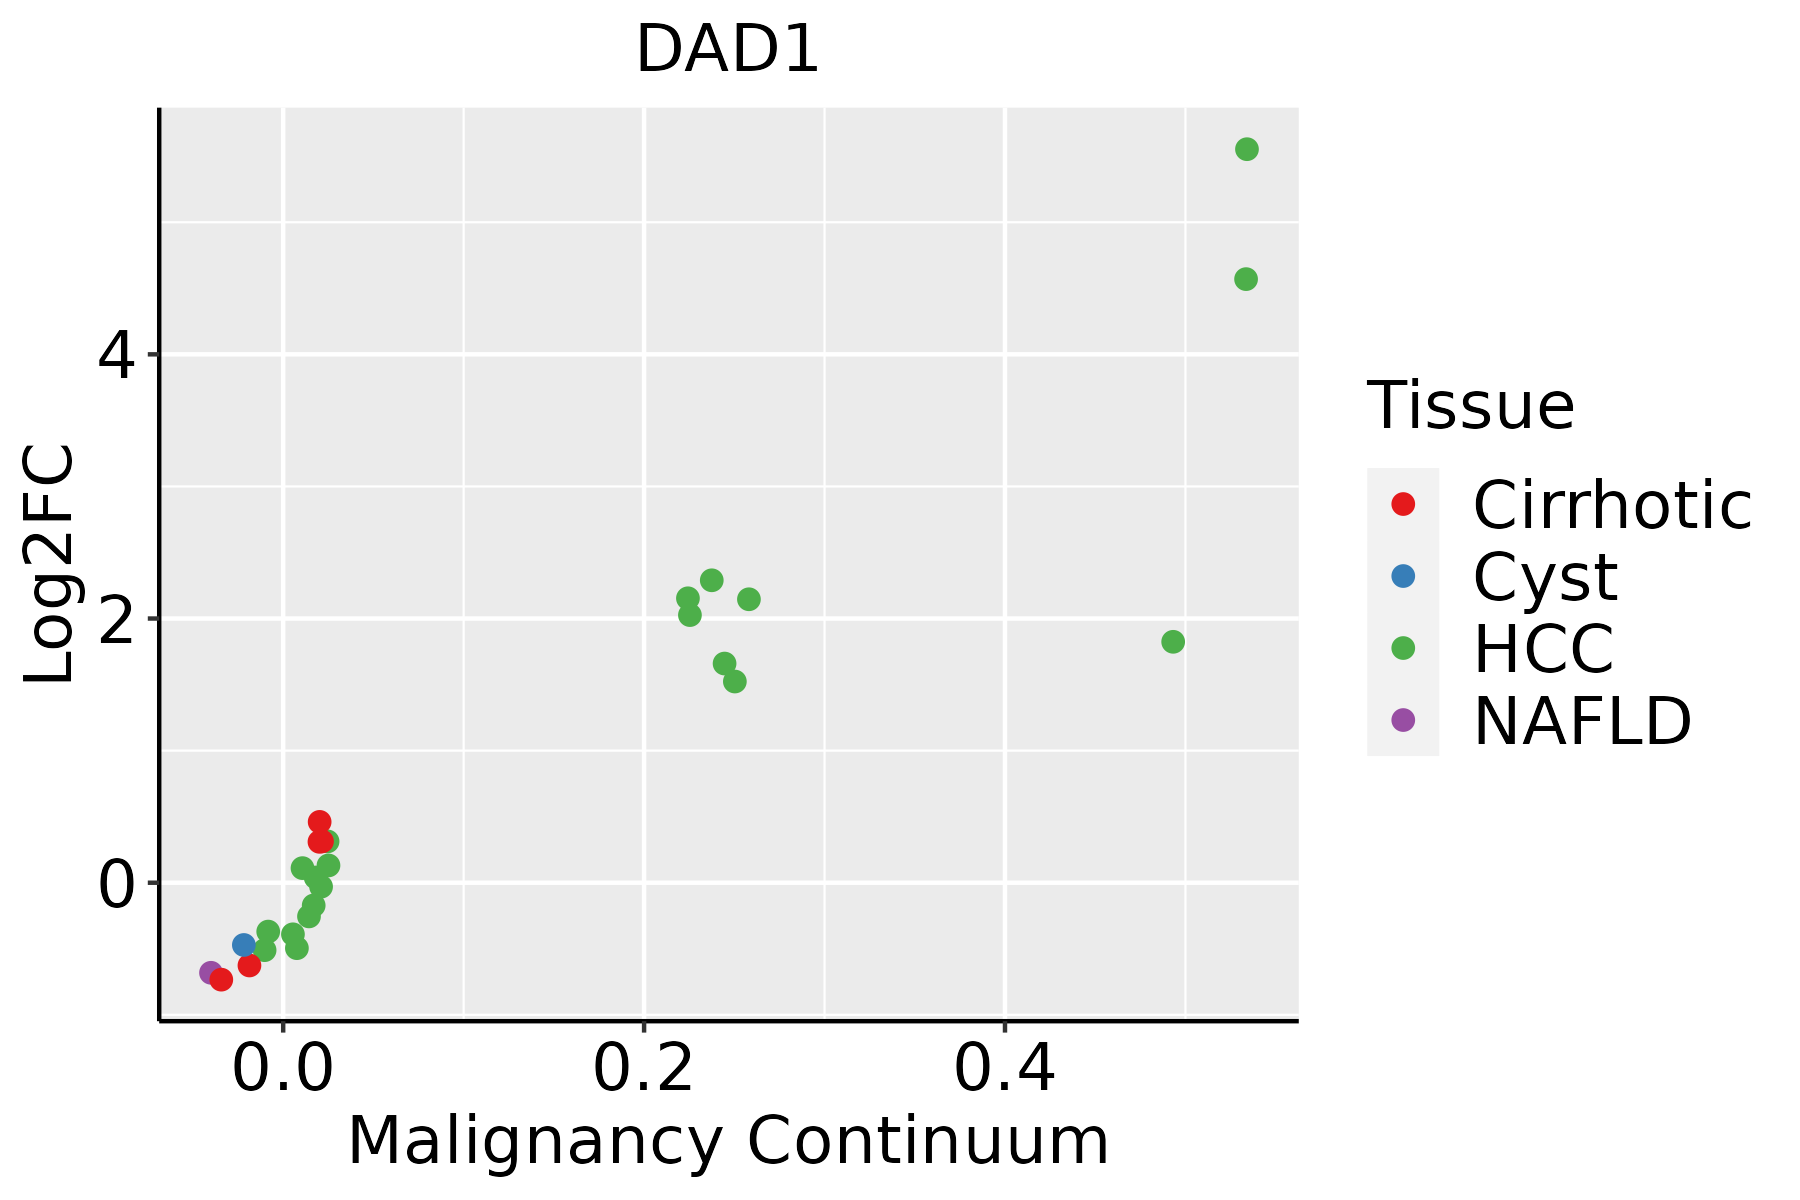 | HCC: Hepatocellular carcinoma |
| NAFLD: Non-alcoholic fatty liver disease | ||
| Oral Cavity |  | EOLP: Erosive Oral lichen planus |
| LP: leukoplakia | ||
| NEOLP: Non-erosive oral lichen planus | ||
| OSCC: Oral squamous cell carcinoma | ||
| Prostate | 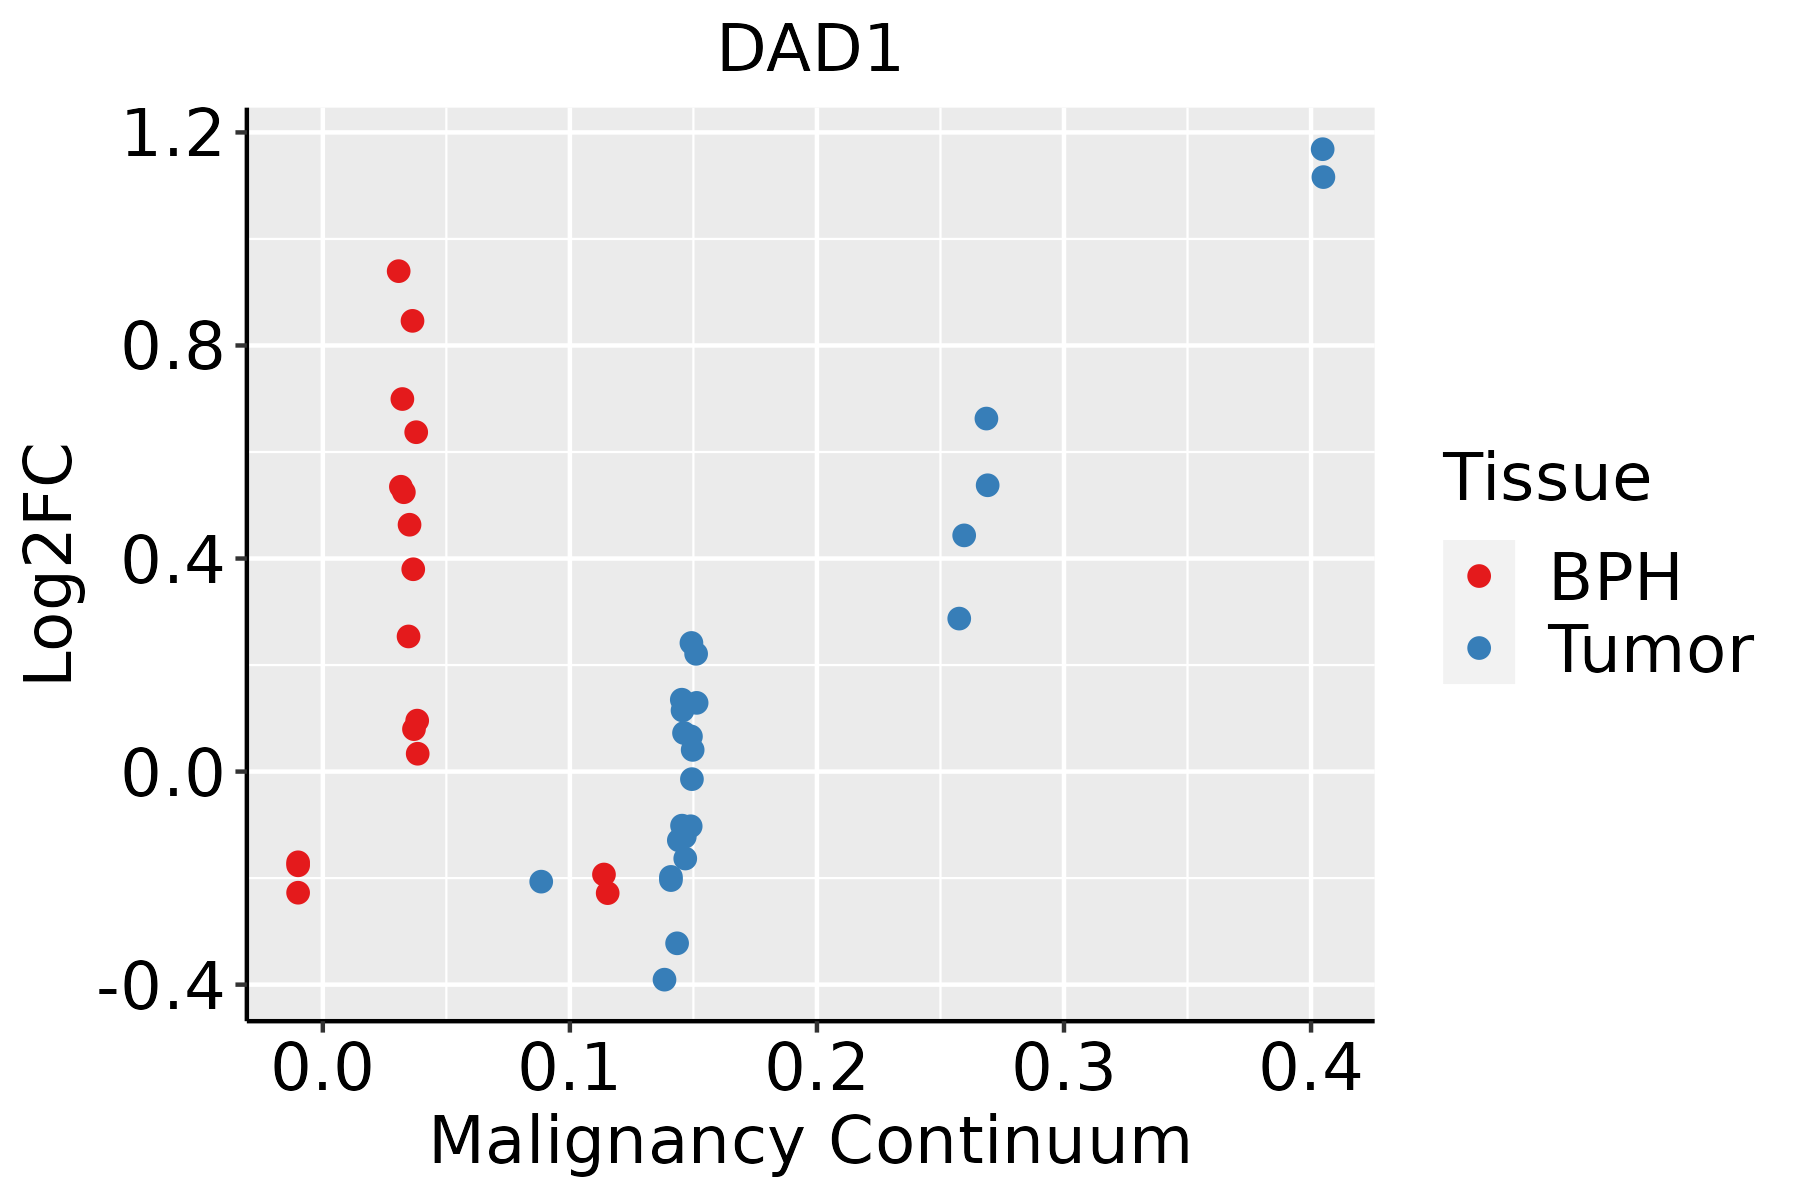 | BPH: Benign Prostatic Hyperplasia |
| Skin | 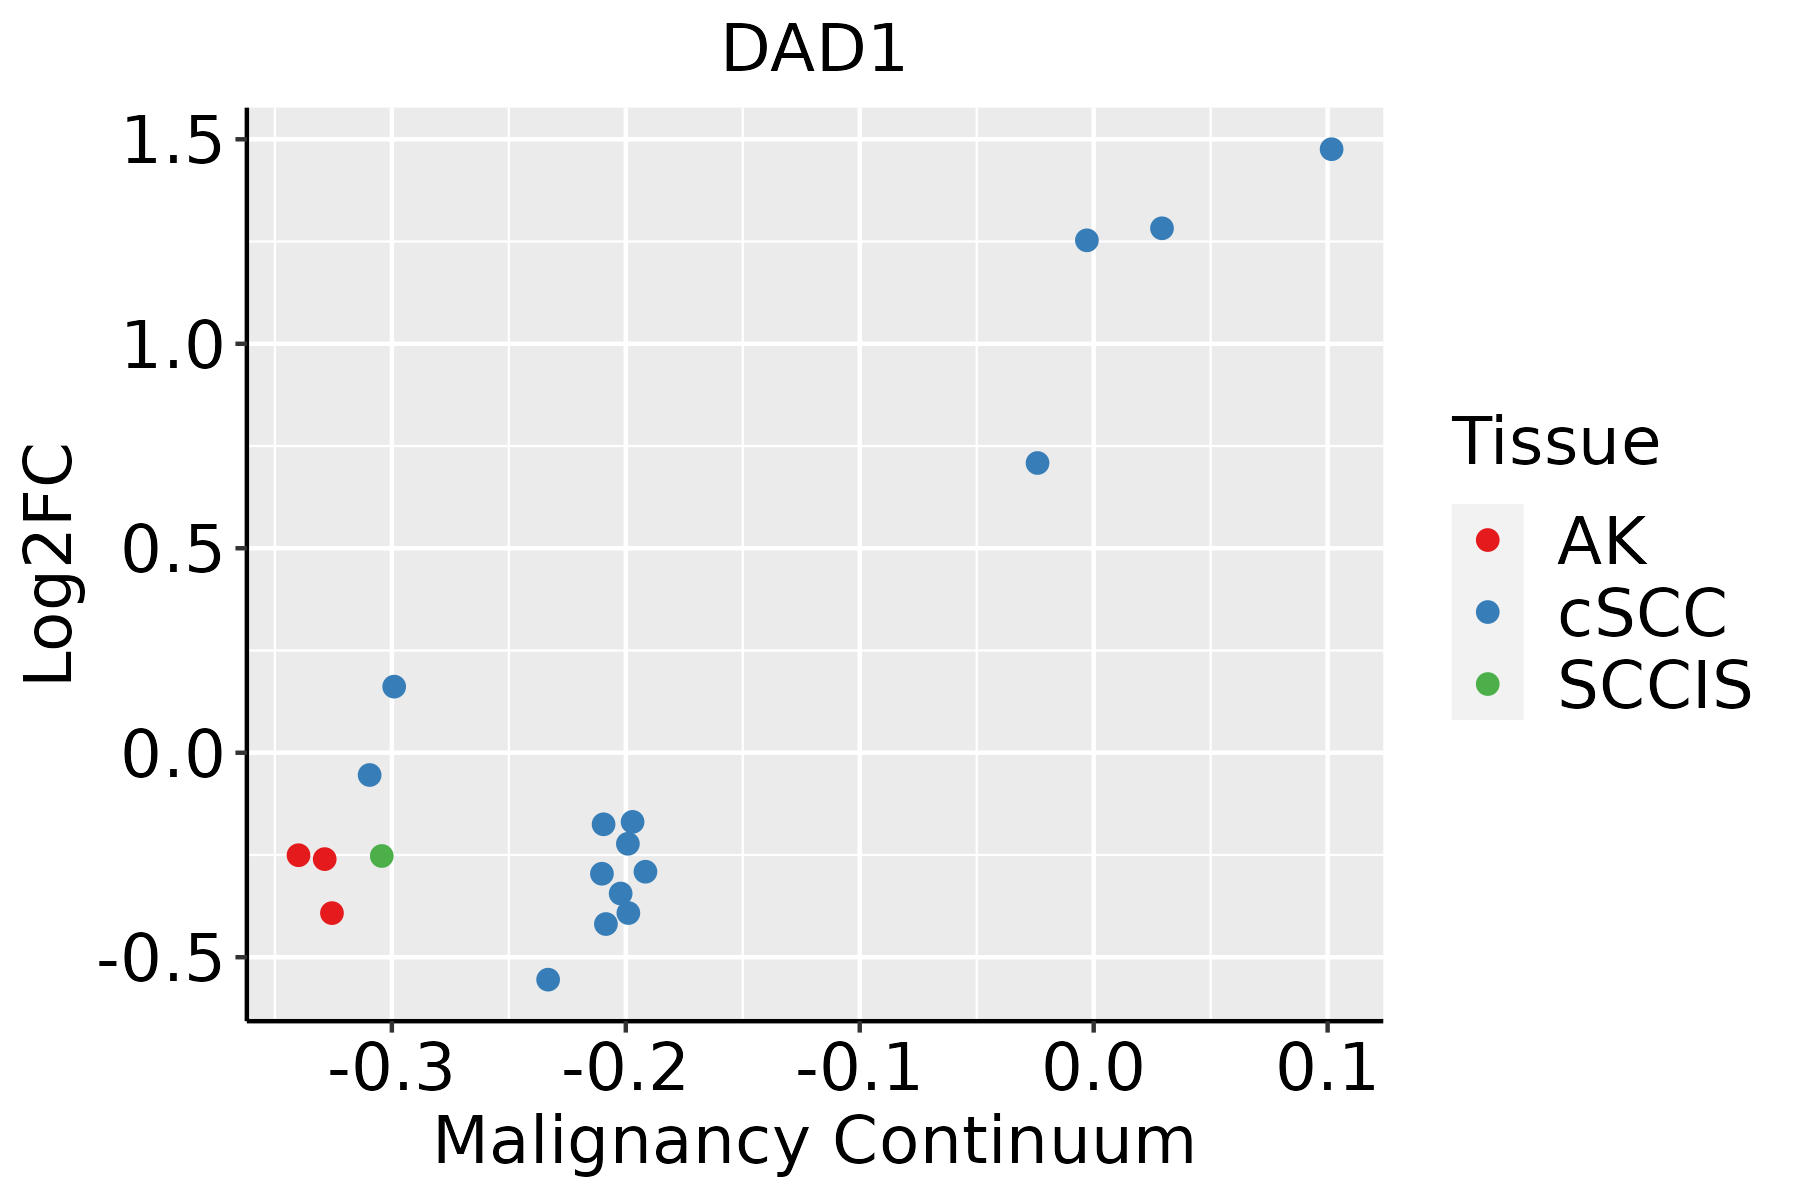 | AK: Actinic keratosis |
| cSCC: Cutaneous squamous cell carcinoma | ||
| SCCIS:squamous cell carcinoma in situ | ||
| Thyroid | 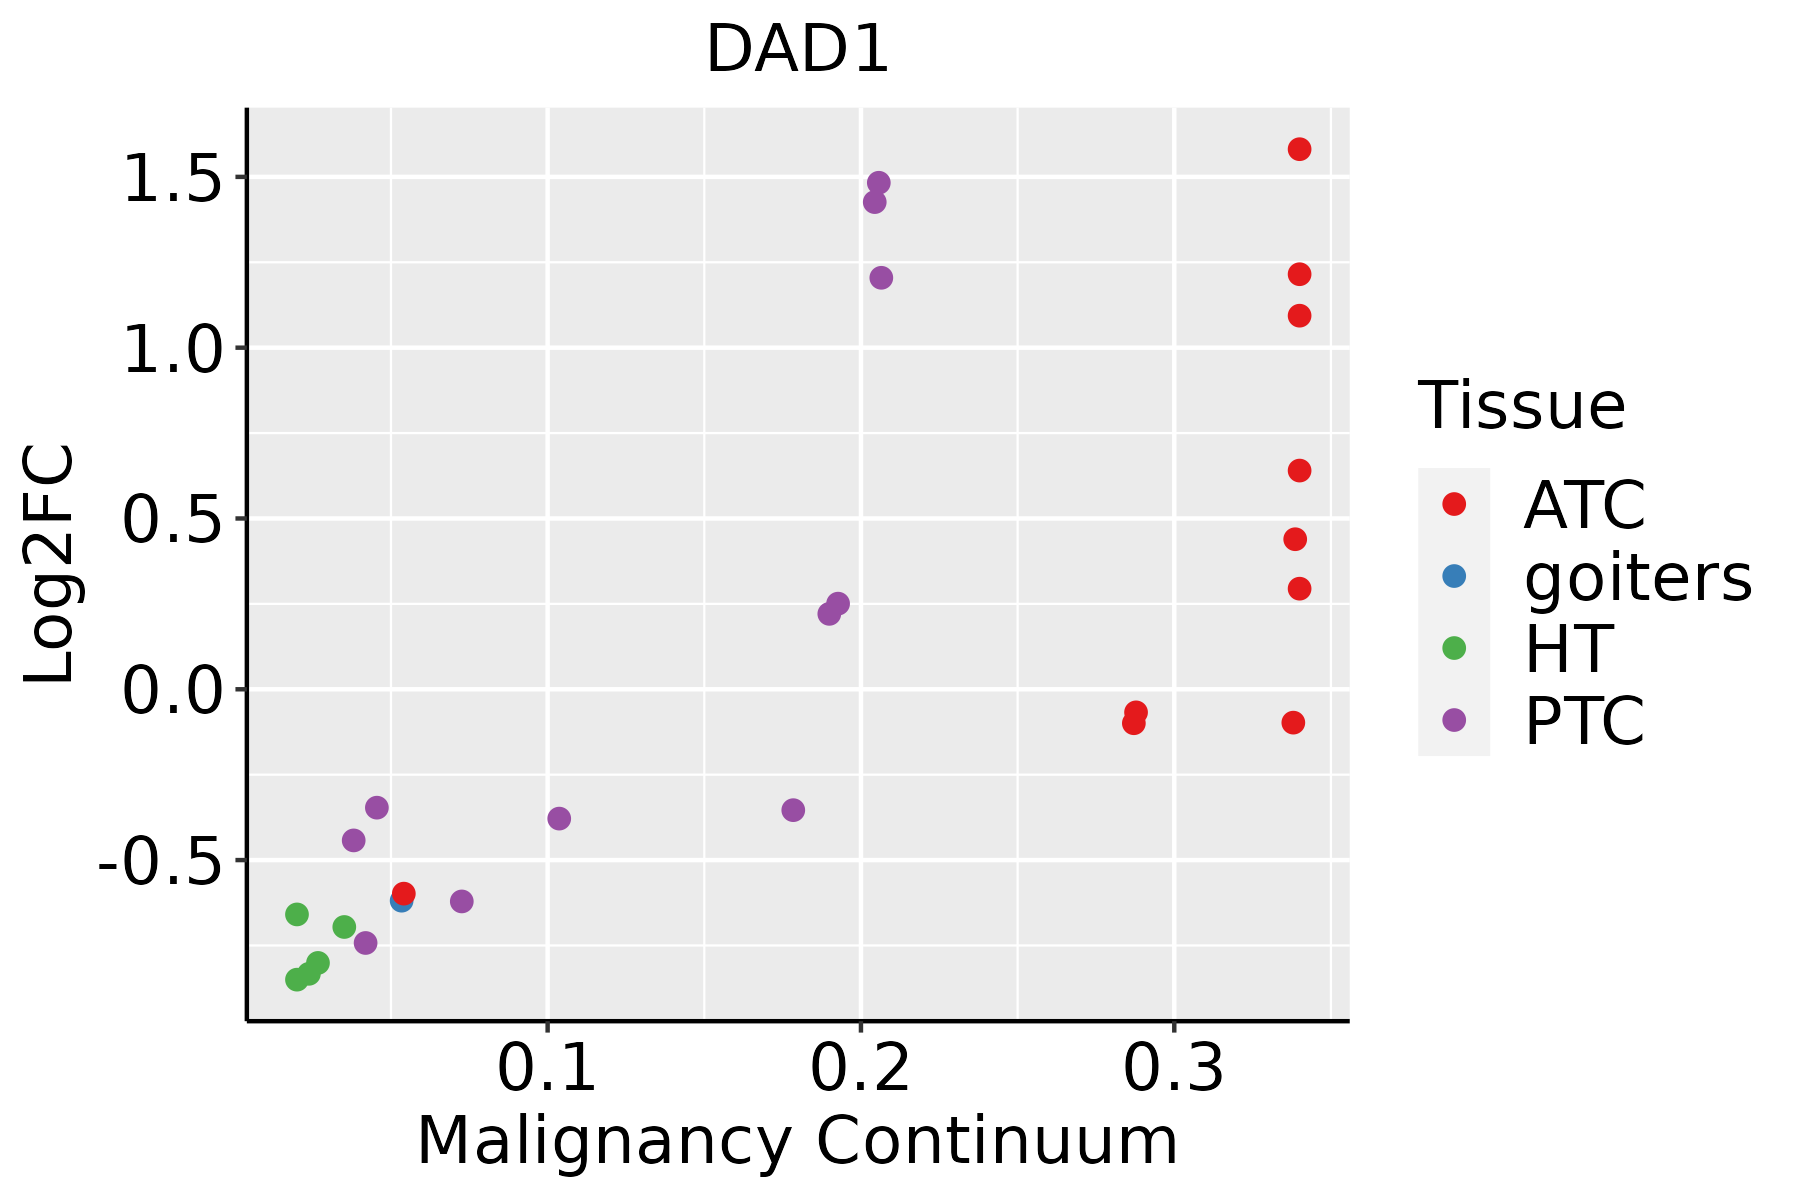 | ATC: Anaplastic thyroid cancer |
| HT: Hashimoto's thyroiditis | ||
| PTC: Papillary thyroid cancer |
| ∗log2FC in expression of this searched gene in stem-like cells from each diseased tissue sample relative to stem-like cells in normal samples in each tissue plotted against the malignancy continuum. Samples are colored based on if they are from different disease stage. |
Top |
Malignant transformation related pathway analysis |
| Find out the enriched GO biological processes and KEGG pathways involved in transition from healthy to precancer to cancer |
| Tissue | Disease Stage | Enriched GO biological Processes |
| Colorectum | AD |  |
| Colorectum | SER |  |
| Colorectum | MSS |  |
| Colorectum | MSI-H |  |
| Colorectum | FAP |  |
| ∗Top 15 enriched GO BP terms are showed in the bar plot of each disease state in each tissue. Each row represents a significant GO biological process which is colored according to the -log10(p.adjust). |
| Page: 1 2 3 4 5 6 7 8 9 |
| GO ID | Tissue | Disease Stage | Description | Gene Ratio | Bg Ratio | pvalue | p.adjust | Count |
| GO:003166710 | Cervix | CC | response to nutrient levels | 92/2311 | 474/18723 | 5.80e-06 | 1.42e-04 | 92 |
| GO:003164710 | Cervix | CC | regulation of protein stability | 63/2311 | 298/18723 | 1.14e-05 | 2.45e-04 | 63 |
| GO:00017018 | Cervix | CC | in utero embryonic development | 71/2311 | 367/18723 | 7.21e-05 | 1.00e-03 | 71 |
| GO:00094109 | Cervix | CC | response to xenobiotic stimulus | 78/2311 | 462/18723 | 2.39e-03 | 1.70e-02 | 78 |
| GO:00075846 | Cervix | CC | response to nutrient | 33/2311 | 174/18723 | 7.65e-03 | 4.07e-02 | 33 |
| GO:0031647 | Colorectum | AD | regulation of protein stability | 108/3918 | 298/18723 | 6.33e-10 | 5.08e-08 | 108 |
| GO:0018279 | Colorectum | AD | protein N-linked glycosylation via asparagine | 15/3918 | 23/18723 | 5.47e-06 | 1.40e-04 | 15 |
| GO:0018196 | Colorectum | AD | peptidyl-asparagine modification | 15/3918 | 24/18723 | 1.18e-05 | 2.62e-04 | 15 |
| GO:0031667 | Colorectum | AD | response to nutrient levels | 138/3918 | 474/18723 | 1.22e-05 | 2.68e-04 | 138 |
| GO:0001701 | Colorectum | AD | in utero embryonic development | 110/3918 | 367/18723 | 2.36e-05 | 4.62e-04 | 110 |
| GO:0009410 | Colorectum | AD | response to xenobiotic stimulus | 128/3918 | 462/18723 | 2.69e-04 | 3.31e-03 | 128 |
| GO:0006487 | Colorectum | AD | protein N-linked glycosylation | 25/3918 | 65/18723 | 9.12e-04 | 8.71e-03 | 25 |
| GO:0006486 | Colorectum | AD | protein glycosylation | 64/3918 | 226/18723 | 4.86e-03 | 3.27e-02 | 64 |
| GO:0043413 | Colorectum | AD | macromolecule glycosylation | 64/3918 | 226/18723 | 4.86e-03 | 3.27e-02 | 64 |
| GO:0070085 | Colorectum | AD | glycosylation | 67/3918 | 240/18723 | 5.78e-03 | 3.67e-02 | 67 |
| GO:00316472 | Colorectum | MSS | regulation of protein stability | 103/3467 | 298/18723 | 2.52e-11 | 3.49e-09 | 103 |
| GO:00316672 | Colorectum | MSS | response to nutrient levels | 125/3467 | 474/18723 | 1.24e-05 | 2.88e-04 | 125 |
| GO:00017012 | Colorectum | MSS | in utero embryonic development | 99/3467 | 367/18723 | 3.71e-05 | 7.10e-04 | 99 |
| GO:00182792 | Colorectum | MSS | protein N-linked glycosylation via asparagine | 13/3467 | 23/18723 | 5.21e-05 | 9.31e-04 | 13 |
| GO:00181962 | Colorectum | MSS | peptidyl-asparagine modification | 13/3467 | 24/18723 | 9.44e-05 | 1.49e-03 | 13 |
| Page: 1 2 3 4 5 6 7 8 9 10 11 12 13 14 |
| Pathway ID | Tissue | Disease Stage | Description | Gene Ratio | Bg Ratio | pvalue | p.adjust | qvalue | Count |
| hsa0414120 | Cervix | CC | Protein processing in endoplasmic reticulum | 55/1267 | 174/8465 | 1.74e-08 | 2.68e-07 | 1.58e-07 | 55 |
| hsa04141110 | Cervix | CC | Protein processing in endoplasmic reticulum | 55/1267 | 174/8465 | 1.74e-08 | 2.68e-07 | 1.58e-07 | 55 |
| hsa04141 | Colorectum | AD | Protein processing in endoplasmic reticulum | 80/2092 | 174/8465 | 5.96e-10 | 1.25e-08 | 7.96e-09 | 80 |
| hsa00510 | Colorectum | AD | N-Glycan biosynthesis | 21/2092 | 53/8465 | 1.15e-02 | 4.24e-02 | 2.71e-02 | 21 |
| hsa041411 | Colorectum | AD | Protein processing in endoplasmic reticulum | 80/2092 | 174/8465 | 5.96e-10 | 1.25e-08 | 7.96e-09 | 80 |
| hsa005101 | Colorectum | AD | N-Glycan biosynthesis | 21/2092 | 53/8465 | 1.15e-02 | 4.24e-02 | 2.71e-02 | 21 |
| hsa041414 | Colorectum | MSS | Protein processing in endoplasmic reticulum | 75/1875 | 174/8465 | 3.78e-10 | 8.44e-09 | 5.17e-09 | 75 |
| hsa005102 | Colorectum | MSS | N-Glycan biosynthesis | 20/1875 | 53/8465 | 7.17e-03 | 2.83e-02 | 1.73e-02 | 20 |
| hsa00513 | Colorectum | MSS | Various types of N-glycan biosynthesis | 16/1875 | 42/8465 | 1.39e-02 | 4.53e-02 | 2.77e-02 | 16 |
| hsa041415 | Colorectum | MSS | Protein processing in endoplasmic reticulum | 75/1875 | 174/8465 | 3.78e-10 | 8.44e-09 | 5.17e-09 | 75 |
| hsa005103 | Colorectum | MSS | N-Glycan biosynthesis | 20/1875 | 53/8465 | 7.17e-03 | 2.83e-02 | 1.73e-02 | 20 |
| hsa005131 | Colorectum | MSS | Various types of N-glycan biosynthesis | 16/1875 | 42/8465 | 1.39e-02 | 4.53e-02 | 2.77e-02 | 16 |
| hsa0414126 | Endometrium | AEH | Protein processing in endoplasmic reticulum | 62/1197 | 174/8465 | 5.97e-13 | 1.39e-11 | 1.01e-11 | 62 |
| hsa04141111 | Endometrium | AEH | Protein processing in endoplasmic reticulum | 62/1197 | 174/8465 | 5.97e-13 | 1.39e-11 | 1.01e-11 | 62 |
| hsa0414127 | Endometrium | EEC | Protein processing in endoplasmic reticulum | 64/1237 | 174/8465 | 2.17e-13 | 5.09e-12 | 3.80e-12 | 64 |
| hsa0414136 | Endometrium | EEC | Protein processing in endoplasmic reticulum | 64/1237 | 174/8465 | 2.17e-13 | 5.09e-12 | 3.80e-12 | 64 |
| hsa0414139 | Esophagus | HGIN | Protein processing in endoplasmic reticulum | 67/1383 | 174/8465 | 1.06e-12 | 2.16e-11 | 1.72e-11 | 67 |
| hsa005106 | Esophagus | HGIN | N-Glycan biosynthesis | 17/1383 | 53/8465 | 3.43e-03 | 2.54e-02 | 2.02e-02 | 17 |
| hsa04141114 | Esophagus | HGIN | Protein processing in endoplasmic reticulum | 67/1383 | 174/8465 | 1.06e-12 | 2.16e-11 | 1.72e-11 | 67 |
| hsa0051013 | Esophagus | HGIN | N-Glycan biosynthesis | 17/1383 | 53/8465 | 3.43e-03 | 2.54e-02 | 2.02e-02 | 17 |
| Page: 1 2 3 4 |
Top |
Cell-cell communication analysis |
| Identification of potential cell-cell interactions between two cell types and their ligand-receptor pairs for different disease states |
| Ligand | Receptor | LRpair | Pathway | Tissue | Disease Stage |
| Page: 1 |
Top |
Single-cell gene regulatory network inference analysis |
| Find out the significant the regulons (TFs) and the target genes of each regulon across cell types for different disease states |
| TF | Cell Type | Tissue | Disease Stage | Target Gene | RSS | Regulon Activity |
| ∗The dot plots of a searched regulon are shown for all cell subpopulations in each disease state of each tissue based on the regulon specific score inferred using pySCENIC and by calculating the average expression. |
| Page: 1 |
Top |
Somatic mutation of malignant transformation related genes |
| Annotation of somatic variants for genes involved in malignant transformation |
| Hugo Symbol | Variant Class | Variant Classification | dbSNP RS | HGVSc | HGVSp | HGVSp Short | SWISSPROT | BIOTYPE | SIFT | PolyPhen | Tumor Sample Barcode | Tissue | Histology | Sex | Age | Stage | Therapy Types | Drugs | Outcome |
| DAD1 | SNV | Missense_Mutation | c.173N>T | p.Ser58Leu | p.S58L | P61803 | protein_coding | deleterious(0) | benign(0.408) | TCGA-GM-A2DI-01 | Breast | breast invasive carcinoma | Female | <65 | I/II | Chemotherapy | taxotere | CR | |
| DAD1 | SNV | Missense_Mutation | c.59N>A | p.Thr20Asn | p.T20N | P61803 | protein_coding | deleterious(0) | probably_damaging(0.997) | TCGA-G4-6588-01 | Colorectum | colon adenocarcinoma | Female | <65 | I/II | Unknown | Unknown | SD | |
| DAD1 | insertion | Frame_Shift_Ins | novel | c.217_218insAATTAAGTAAA | p.Leu73GlnfsTer5 | p.L73Qfs*5 | P61803 | protein_coding | TCGA-AM-5820-01 | Colorectum | colon adenocarcinoma | Female | <65 | I/II | Unknown | Unknown | SD | ||
| DAD1 | SNV | Missense_Mutation | rs763078200 | c.20C>T | p.Ser7Phe | p.S7F | P61803 | protein_coding | deleterious(0.03) | benign(0.084) | TCGA-A5-A0G2-01 | Endometrium | uterine corpus endometrioid carcinoma | Female | <65 | III/IV | Unknown | Unknown | SD |
| DAD1 | SNV | Missense_Mutation | c.164C>A | p.Ser55Tyr | p.S55Y | P61803 | protein_coding | deleterious(0) | probably_damaging(0.996) | TCGA-AP-A056-01 | Endometrium | uterine corpus endometrioid carcinoma | Female | <65 | I/II | Unknown | Unknown | SD | |
| DAD1 | SNV | Missense_Mutation | rs542658721 | c.248N>T | p.Ala83Val | p.A83V | P61803 | protein_coding | tolerated(0.09) | benign(0.15) | TCGA-B5-A3FA-01 | Endometrium | uterine corpus endometrioid carcinoma | Female | >=65 | I/II | Unknown | Unknown | SD |
| DAD1 | SNV | Missense_Mutation | novel | c.98N>G | p.Tyr33Cys | p.Y33C | P61803 | protein_coding | deleterious(0.03) | probably_damaging(0.998) | TCGA-EO-A22X-01 | Endometrium | uterine corpus endometrioid carcinoma | Female | <65 | III/IV | Unspecific | Carboplatin | Complete Response |
| DAD1 | SNV | Missense_Mutation | c.56N>G | p.Ser19Cys | p.S19C | P61803 | protein_coding | deleterious(0.02) | possibly_damaging(0.578) | TCGA-44-A47A-01 | Lung | lung adenocarcinoma | Female | >=65 | I/II | Unknown | Unknown | PD |
| Page: 1 |
Top |
Related drugs of malignant transformation related genes |
| Identification of chemicals and drugs interact with genes involved in malignant transfromation |
| (DGIdb 4.0) |
| Entrez ID | Symbol | Category | Interaction Types | Drug Claim Name | Drug Name | PMIDs |
| Page: 1 |

Copyright 2023-Present -The University of Texas Health Science Center at Houston |