
|
|||||
|
 | |
| |
| |
| |
| |
| |
|
Gene: DACH1 |
Gene summary for DACH1 |
| Gene information | Species | Human | Gene symbol | DACH1 | Gene ID | 1602 |
| Gene name | dachshund family transcription factor 1 | |
| Gene Alias | DACH | |
| Cytomap | 13q21.33 | |
| Gene Type | protein-coding | GO ID | GO:0000003 | UniProtAcc | A0A087WY66 |
Top |
Malignant transformation analysis |
| Identification of the aberrant gene expression in precancerous and cancerous lesions by comparing the gene expression of stem-like cells in diseased tissues with normal stem cells |
| Entrez ID | Symbol | Replicates | Species | Organ | Tissue | Adj P-value | Log2FC | Malignancy |
| 1602 | DACH1 | HTA11_2487_2000001011 | Human | Colorectum | SER | 3.93e-03 | -5.18e-01 | -0.1808 |
| 1602 | DACH1 | HTA11_347_2000001011 | Human | Colorectum | AD | 1.31e-04 | -4.75e-01 | -0.1954 |
| 1602 | DACH1 | HTA11_1391_2000001011 | Human | Colorectum | AD | 4.34e-03 | 6.72e-01 | -0.059 |
| 1602 | DACH1 | HTA11_2992_2000001011 | Human | Colorectum | SER | 1.14e-03 | -7.31e-01 | -0.1706 |
| 1602 | DACH1 | HTA11_5212_2000001011 | Human | Colorectum | AD | 1.68e-05 | -8.45e-01 | -0.2061 |
| 1602 | DACH1 | HTA11_5216_2000001011 | Human | Colorectum | SER | 1.19e-02 | -7.58e-01 | -0.1462 |
| 1602 | DACH1 | HTA11_866_3004761011 | Human | Colorectum | AD | 6.59e-10 | 7.49e-01 | 0.096 |
| 1602 | DACH1 | HTA11_6818_2000001011 | Human | Colorectum | AD | 2.16e-08 | 8.96e-01 | 0.0112 |
| 1602 | DACH1 | HTA11_99999970781_79442 | Human | Colorectum | MSS | 3.25e-03 | 5.16e-01 | 0.294 |
| 1602 | DACH1 | HTA11_99999965062_69753 | Human | Colorectum | MSI-H | 4.88e-15 | 1.97e+00 | 0.3487 |
| 1602 | DACH1 | HTA11_99999965104_69814 | Human | Colorectum | MSS | 1.52e-39 | 2.37e+00 | 0.281 |
| 1602 | DACH1 | HTA11_99999971662_82457 | Human | Colorectum | MSS | 2.94e-26 | 1.62e+00 | 0.3859 |
| 1602 | DACH1 | HTA11_99999973899_84307 | Human | Colorectum | MSS | 3.48e-05 | 8.25e-01 | 0.2585 |
| 1602 | DACH1 | HTA11_99999974143_84620 | Human | Colorectum | MSS | 1.76e-23 | 1.02e+00 | 0.3005 |
| 1602 | DACH1 | F007 | Human | Colorectum | FAP | 4.06e-09 | 5.30e-01 | 0.1176 |
| 1602 | DACH1 | A002-C-010 | Human | Colorectum | FAP | 2.06e-42 | 7.81e-01 | 0.242 |
| 1602 | DACH1 | A001-C-207 | Human | Colorectum | FAP | 4.14e-05 | 3.86e-01 | 0.1278 |
| 1602 | DACH1 | A015-C-203 | Human | Colorectum | FAP | 2.30e-18 | -1.32e-02 | -0.1294 |
| 1602 | DACH1 | A002-C-201 | Human | Colorectum | FAP | 1.37e-07 | 1.64e-01 | 0.0324 |
| 1602 | DACH1 | A002-C-203 | Human | Colorectum | FAP | 2.88e-25 | 6.75e-01 | 0.2786 |
| Page: 1 2 3 4 |
| Tissue | Expression Dynamics | Abbreviation |
| Colorectum (GSE201348) |  | FAP: Familial adenomatous polyposis |
| CRC: Colorectal cancer | ||
| Colorectum (HTA11) |  | AD: Adenomas |
| SER: Sessile serrated lesions | ||
| MSI-H: Microsatellite-high colorectal cancer | ||
| MSS: Microsatellite stable colorectal cancer | ||
| Endometrium | 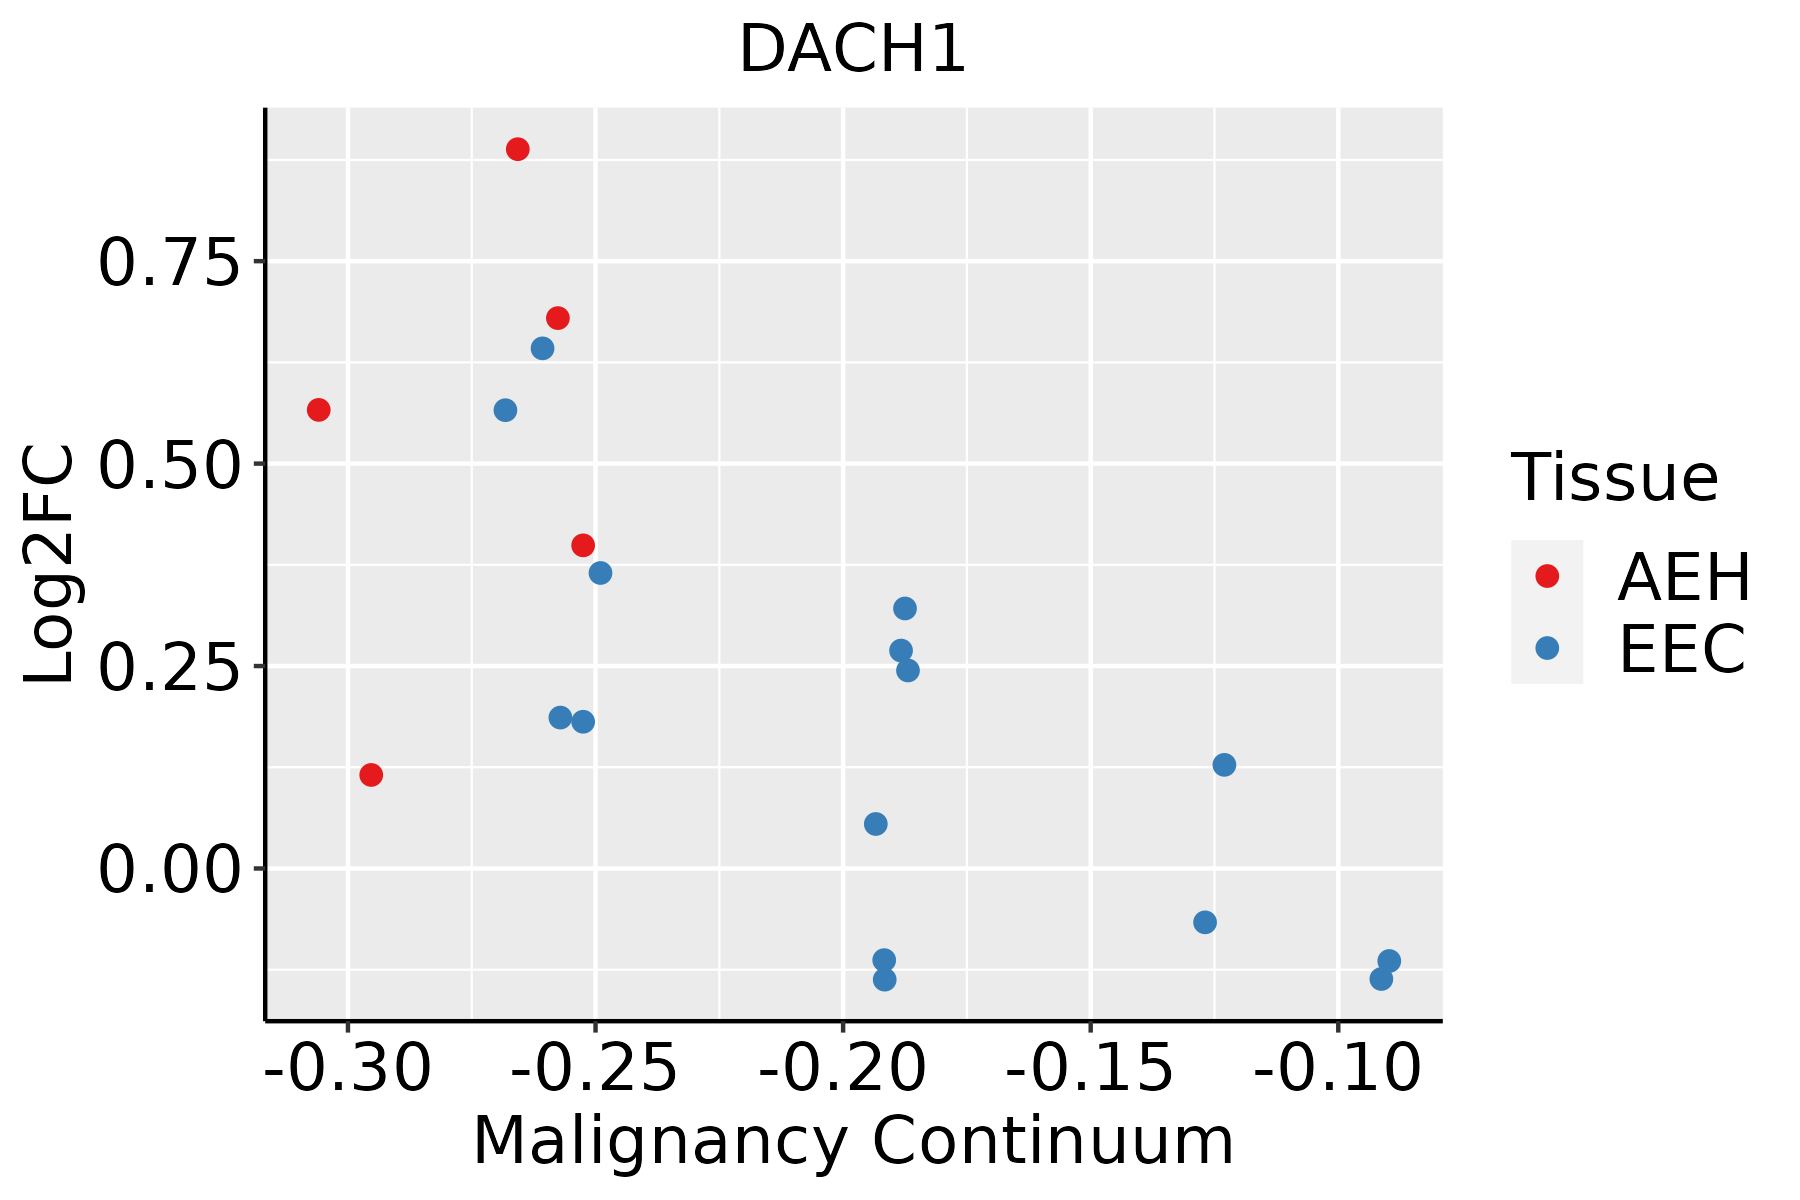 | AEH: Atypical endometrial hyperplasia |
| EEC: Endometrioid Cancer | ||
| Skin |  | AK: Actinic keratosis |
| cSCC: Cutaneous squamous cell carcinoma | ||
| SCCIS:squamous cell carcinoma in situ |
| ∗log2FC in expression of this searched gene in stem-like cells from each diseased tissue sample relative to stem-like cells in normal samples in each tissue plotted against the malignancy continuum. Samples are colored based on if they are from different disease stage. |
Top |
Malignant transformation related pathway analysis |
| Find out the enriched GO biological processes and KEGG pathways involved in transition from healthy to precancer to cancer |
| Tissue | Disease Stage | Enriched GO biological Processes |
| Colorectum | AD |  |
| Colorectum | SER |  |
| Colorectum | MSS |  |
| Colorectum | MSI-H |  |
| Colorectum | FAP |  |
| ∗Top 15 enriched GO BP terms are showed in the bar plot of each disease state in each tissue. Each row represents a significant GO biological process which is colored according to the -log10(p.adjust). |
| Page: 1 2 3 4 5 6 7 8 9 |
| GO ID | Tissue | Disease Stage | Description | Gene Ratio | Bg Ratio | pvalue | p.adjust | Count |
| GO:0051052 | Colorectum | AD | regulation of DNA metabolic process | 116/3918 | 359/18723 | 2.47e-07 | 1.00e-05 | 116 |
| GO:2000278 | Colorectum | AD | regulation of DNA biosynthetic process | 41/3918 | 106/18723 | 2.17e-05 | 4.33e-04 | 41 |
| GO:0071897 | Colorectum | AD | DNA biosynthetic process | 55/3918 | 180/18723 | 1.46e-03 | 1.24e-02 | 55 |
| GO:20002781 | Colorectum | SER | regulation of DNA biosynthetic process | 33/2897 | 106/18723 | 3.83e-05 | 9.82e-04 | 33 |
| GO:00510521 | Colorectum | SER | regulation of DNA metabolic process | 83/2897 | 359/18723 | 8.03e-05 | 1.77e-03 | 83 |
| GO:00718971 | Colorectum | SER | DNA biosynthetic process | 43/2897 | 180/18723 | 1.99e-03 | 1.98e-02 | 43 |
| GO:00510522 | Colorectum | MSS | regulation of DNA metabolic process | 108/3467 | 359/18723 | 5.86e-08 | 3.10e-06 | 108 |
| GO:20002782 | Colorectum | MSS | regulation of DNA biosynthetic process | 37/3467 | 106/18723 | 4.48e-05 | 8.28e-04 | 37 |
| GO:00718972 | Colorectum | MSS | DNA biosynthetic process | 50/3467 | 180/18723 | 1.45e-03 | 1.35e-02 | 50 |
| GO:00510523 | Colorectum | MSI-H | regulation of DNA metabolic process | 45/1319 | 359/18723 | 1.20e-04 | 3.56e-03 | 45 |
| GO:20002783 | Colorectum | MSI-H | regulation of DNA biosynthetic process | 19/1319 | 106/18723 | 1.40e-04 | 4.11e-03 | 19 |
| GO:00718973 | Colorectum | MSI-H | DNA biosynthetic process | 26/1319 | 180/18723 | 3.73e-04 | 8.56e-03 | 26 |
| GO:0006260 | Colorectum | MSI-H | DNA replication | 31/1319 | 260/18723 | 2.83e-03 | 3.63e-02 | 31 |
| GO:00510524 | Colorectum | FAP | regulation of DNA metabolic process | 84/2622 | 359/18723 | 9.80e-07 | 4.38e-05 | 84 |
| GO:20002784 | Colorectum | FAP | regulation of DNA biosynthetic process | 33/2622 | 106/18723 | 4.62e-06 | 1.54e-04 | 33 |
| GO:00510525 | Colorectum | CRC | regulation of DNA metabolic process | 70/2078 | 359/18723 | 1.75e-06 | 8.92e-05 | 70 |
| GO:20002785 | Colorectum | CRC | regulation of DNA biosynthetic process | 27/2078 | 106/18723 | 2.59e-05 | 7.16e-04 | 27 |
| GO:0006275 | Colorectum | CRC | regulation of DNA replication | 21/2078 | 107/18723 | 6.56e-03 | 4.70e-02 | 21 |
| GO:00303364 | Endometrium | AEH | negative regulation of cell migration | 65/2100 | 344/18723 | 1.65e-05 | 3.42e-04 | 65 |
| GO:20001464 | Endometrium | AEH | negative regulation of cell motility | 67/2100 | 359/18723 | 1.86e-05 | 3.77e-04 | 67 |
| Page: 1 2 3 4 |
| Pathway ID | Tissue | Disease Stage | Description | Gene Ratio | Bg Ratio | pvalue | p.adjust | qvalue | Count |
| Page: 1 |
Top |
Cell-cell communication analysis |
| Identification of potential cell-cell interactions between two cell types and their ligand-receptor pairs for different disease states |
| Ligand | Receptor | LRpair | Pathway | Tissue | Disease Stage |
| Page: 1 |
Top |
Single-cell gene regulatory network inference analysis |
| Find out the significant the regulons (TFs) and the target genes of each regulon across cell types for different disease states |
| TF | Cell Type | Tissue | Disease Stage | Target Gene | RSS | Regulon Activity |
| ∗The dot plots of a searched regulon are shown for all cell subpopulations in each disease state of each tissue based on the regulon specific score inferred using pySCENIC and by calculating the average expression. |
| Page: 1 |
Top |
Somatic mutation of malignant transformation related genes |
| Annotation of somatic variants for genes involved in malignant transformation |
| Hugo Symbol | Variant Class | Variant Classification | dbSNP RS | HGVSc | HGVSp | HGVSp Short | SWISSPROT | BIOTYPE | SIFT | PolyPhen | Tumor Sample Barcode | Tissue | Histology | Sex | Age | Stage | Therapy Types | Drugs | Outcome |
| DACH1 | SNV | Missense_Mutation | novel | c.1993N>A | p.Asp665Asn | p.D665N | Q9UI36 | protein_coding | deleterious_low_confidence(0.04) | benign(0.433) | TCGA-3C-AALI-01 | Breast | breast invasive carcinoma | Female | <65 | I/II | Unspecific | Poly E | Complete Response |
| DACH1 | SNV | Missense_Mutation | novel | c.1430N>T | p.Arg477Ile | p.R477I | Q9UI36 | protein_coding | deleterious_low_confidence(0) | probably_damaging(0.967) | TCGA-AN-A046-01 | Breast | breast invasive carcinoma | Female | >=65 | I/II | Unknown | Unknown | SD |
| DACH1 | SNV | Missense_Mutation | novel | c.1174N>G | p.Ser392Gly | p.S392G | Q9UI36 | protein_coding | tolerated_low_confidence(0.27) | benign(0.006) | TCGA-C8-A26Y-01 | Breast | breast invasive carcinoma | Female | >=65 | I/II | Unknown | Unknown | SD |
| DACH1 | SNV | Missense_Mutation | novel | c.1304N>A | p.Arg435His | p.R435H | Q9UI36 | protein_coding | deleterious_low_confidence(0) | probably_damaging(0.996) | TCGA-D8-A141-01 | Breast | breast invasive carcinoma | Female | <65 | I/II | Chemotherapy | doxorubicine | SD |
| DACH1 | deletion | Frame_Shift_Del | novel | c.1605delN | p.Asp535GlufsTer8 | p.D535Efs*8 | Q9UI36 | protein_coding | TCGA-D8-A1XQ-01 | Breast | breast invasive carcinoma | Female | >=65 | I/II | Unknown | Unknown | SD | ||
| DACH1 | SNV | Missense_Mutation | novel | c.1544A>G | p.Glu515Gly | p.E515G | Q9UI36 | protein_coding | deleterious_low_confidence(0.04) | benign(0.121) | TCGA-2W-A8YY-01 | Cervix | cervical & endocervical cancer | Female | <65 | I/II | Chemotherapy | cisplatin | CR |
| DACH1 | SNV | Missense_Mutation | novel | c.1126G>A | p.Gly376Arg | p.G376R | Q9UI36 | protein_coding | deleterious_low_confidence(0) | benign(0.071) | TCGA-C5-A7CL-01 | Cervix | cervical & endocervical cancer | Female | <65 | III/IV | Chemotherapy | cisplatin | PD |
| DACH1 | SNV | Missense_Mutation | novel | c.113N>T | p.Ser38Leu | p.S38L | Q9UI36 | protein_coding | deleterious_low_confidence(0) | benign(0.217) | TCGA-C5-A7UH-01 | Cervix | cervical & endocervical cancer | Female | <65 | III/IV | Chemotherapy | cisplatin | SD |
| DACH1 | SNV | Missense_Mutation | rs867054570 | c.1907N>T | p.Ala636Val | p.A636V | Q9UI36 | protein_coding | deleterious_low_confidence(0.02) | probably_damaging(0.98) | TCGA-C5-A902-01 | Cervix | cervical & endocervical cancer | Female | <65 | I/II | Chemotherapy | cisplatin | SD |
| DACH1 | SNV | Missense_Mutation | novel | c.1933N>C | p.Glu645Gln | p.E645Q | Q9UI36 | protein_coding | deleterious_low_confidence(0.02) | probably_damaging(0.999) | TCGA-EA-A3QD-01 | Cervix | cervical & endocervical cancer | Female | <65 | III/IV | Chemotherapy | cisplatin | CR |
| Page: 1 2 3 4 5 6 7 8 9 10 |
Top |
Related drugs of malignant transformation related genes |
| Identification of chemicals and drugs interact with genes involved in malignant transfromation |
| (DGIdb 4.0) |
| Entrez ID | Symbol | Category | Interaction Types | Drug Claim Name | Drug Name | PMIDs |
| Page: 1 |

Copyright 2023-Present -The University of Texas Health Science Center at Houston |