
|
|||||
|
 | |
| |
| |
| |
| |
| |
|
Gene: DAB2IP |
Gene summary for DAB2IP |
| Gene information | Species | Human | Gene symbol | DAB2IP | Gene ID | 153090 |
| Gene name | DAB2 interacting protein | |
| Gene Alias | AF9Q34 | |
| Cytomap | 9q33.2 | |
| Gene Type | protein-coding | GO ID | GO:0000122 | UniProtAcc | Q5VWQ8 |
Top |
Malignant transformation analysis |
| Identification of the aberrant gene expression in precancerous and cancerous lesions by comparing the gene expression of stem-like cells in diseased tissues with normal stem cells |
| Entrez ID | Symbol | Replicates | Species | Organ | Tissue | Adj P-value | Log2FC | Malignancy |
| 153090 | DAB2IP | CCI_2 | Human | Cervix | CC | 3.10e-09 | 6.44e-01 | 0.5249 |
| 153090 | DAB2IP | CCI_3 | Human | Cervix | CC | 2.70e-08 | 5.16e-01 | 0.516 |
| 153090 | DAB2IP | HTA11_347_2000001011 | Human | Colorectum | AD | 2.57e-11 | 5.08e-01 | -0.1954 |
| 153090 | DAB2IP | HTA11_696_2000001011 | Human | Colorectum | AD | 2.76e-07 | 4.38e-01 | -0.1464 |
| 153090 | DAB2IP | HTA11_1391_2000001011 | Human | Colorectum | AD | 8.81e-05 | 4.31e-01 | -0.059 |
| 153090 | DAB2IP | HTA11_99999971662_82457 | Human | Colorectum | MSS | 9.26e-06 | 4.12e-01 | 0.3859 |
| 153090 | DAB2IP | A015-C-203 | Human | Colorectum | FAP | 1.12e-10 | -1.72e-01 | -0.1294 |
| 153090 | DAB2IP | A002-C-201 | Human | Colorectum | FAP | 3.28e-02 | -1.22e-01 | 0.0324 |
| 153090 | DAB2IP | A001-C-119 | Human | Colorectum | FAP | 1.57e-02 | -2.44e-01 | -0.1557 |
| 153090 | DAB2IP | A001-C-108 | Human | Colorectum | FAP | 5.24e-06 | -1.33e-01 | -0.0272 |
| 153090 | DAB2IP | A002-C-205 | Human | Colorectum | FAP | 6.65e-07 | -9.87e-02 | -0.1236 |
| 153090 | DAB2IP | A015-C-006 | Human | Colorectum | FAP | 1.32e-04 | -1.82e-01 | -0.0994 |
| 153090 | DAB2IP | A015-C-106 | Human | Colorectum | FAP | 1.49e-02 | -5.94e-02 | -0.0511 |
| 153090 | DAB2IP | A002-C-114 | Human | Colorectum | FAP | 2.60e-08 | -2.80e-01 | -0.1561 |
| 153090 | DAB2IP | A015-C-104 | Human | Colorectum | FAP | 1.64e-11 | -1.34e-01 | -0.1899 |
| 153090 | DAB2IP | A001-C-014 | Human | Colorectum | FAP | 3.84e-02 | -9.39e-02 | 0.0135 |
| 153090 | DAB2IP | A002-C-016 | Human | Colorectum | FAP | 5.48e-09 | -1.77e-01 | 0.0521 |
| 153090 | DAB2IP | A015-C-002 | Human | Colorectum | FAP | 4.67e-04 | -2.42e-01 | -0.0763 |
| 153090 | DAB2IP | A002-C-116 | Human | Colorectum | FAP | 4.70e-12 | -2.78e-01 | -0.0452 |
| 153090 | DAB2IP | A014-C-008 | Human | Colorectum | FAP | 1.29e-03 | -1.91e-01 | -0.191 |
| Page: 1 2 3 |
| Tissue | Expression Dynamics | Abbreviation |
| Cervix | 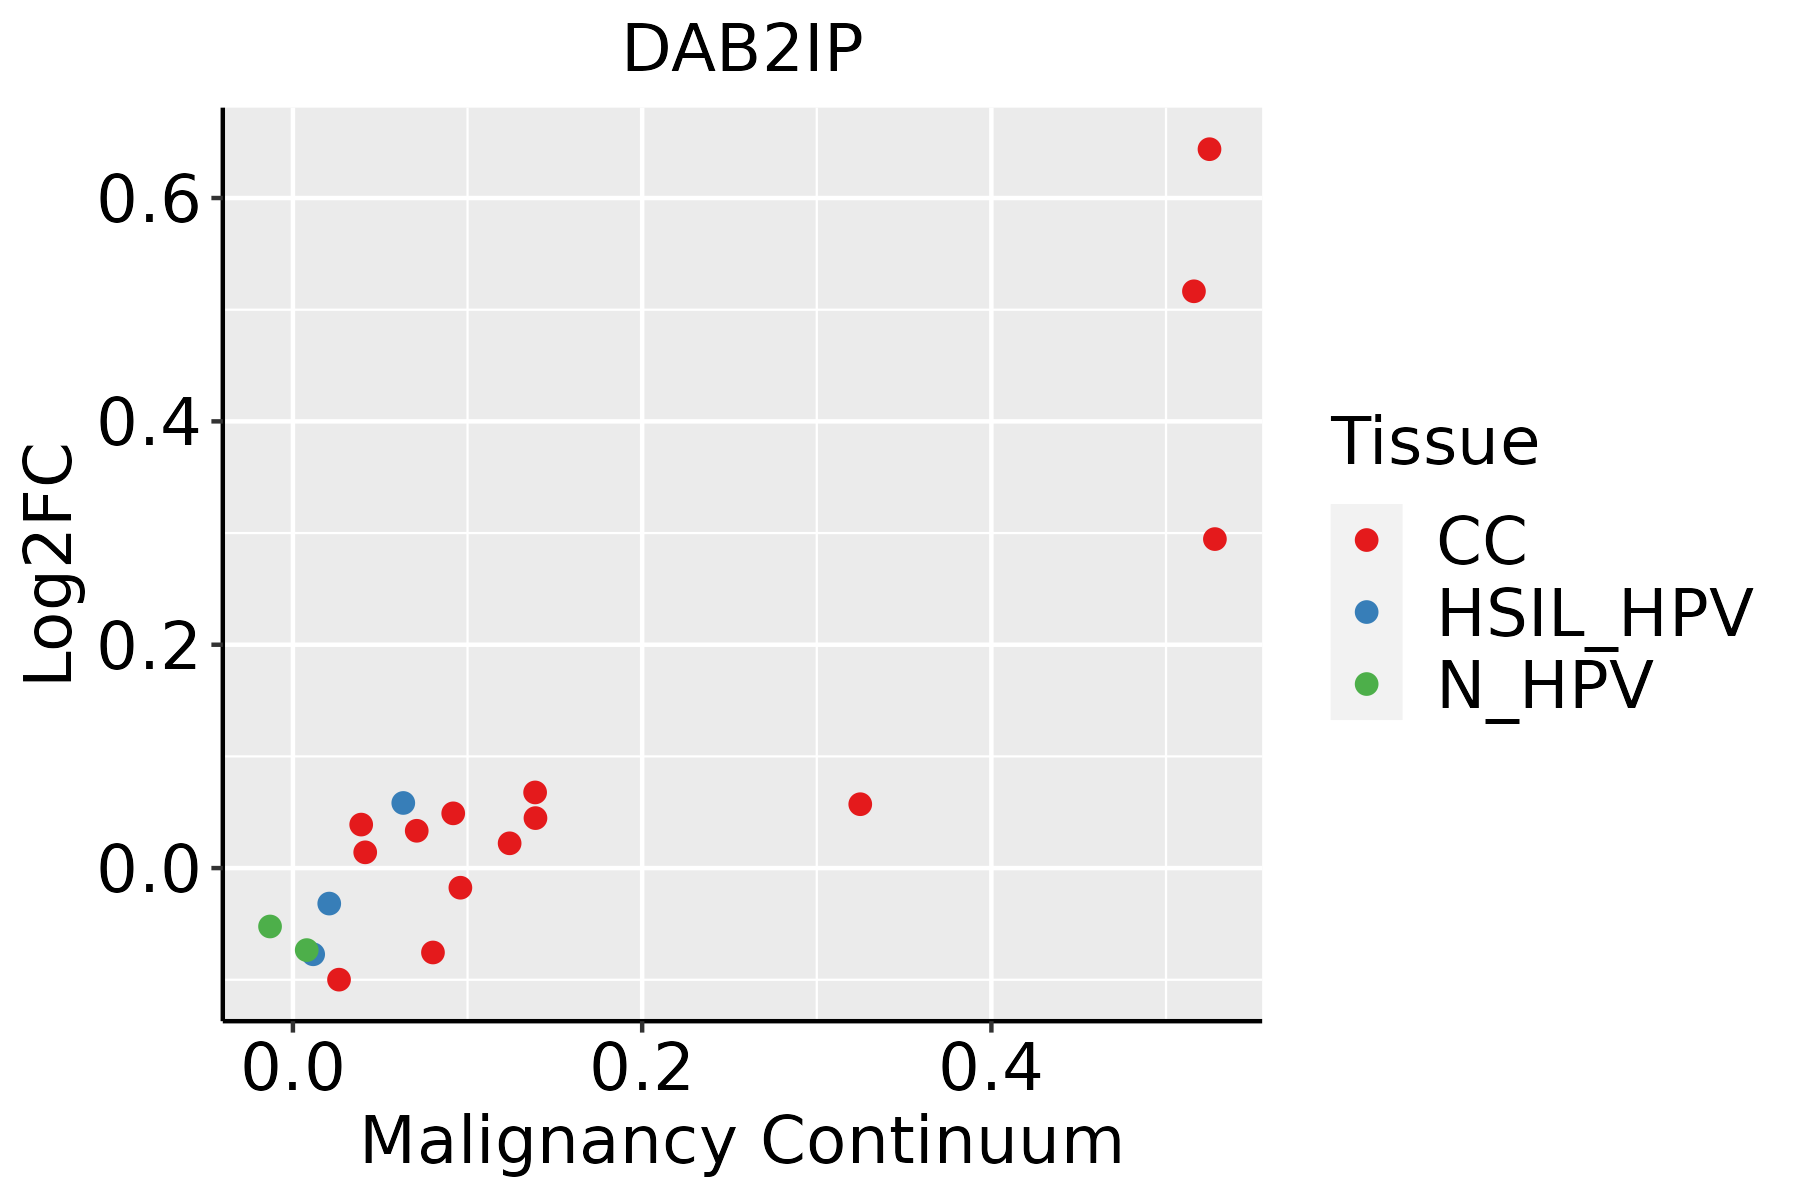 | CC: Cervix cancer |
| HSIL_HPV: HPV-infected high-grade squamous intraepithelial lesions | ||
| N_HPV: HPV-infected normal cervix | ||
| Colorectum (GSE201348) |  | FAP: Familial adenomatous polyposis |
| CRC: Colorectal cancer | ||
| Colorectum (HTA11) |  | AD: Adenomas |
| SER: Sessile serrated lesions | ||
| MSI-H: Microsatellite-high colorectal cancer | ||
| MSS: Microsatellite stable colorectal cancer | ||
| Oral Cavity | 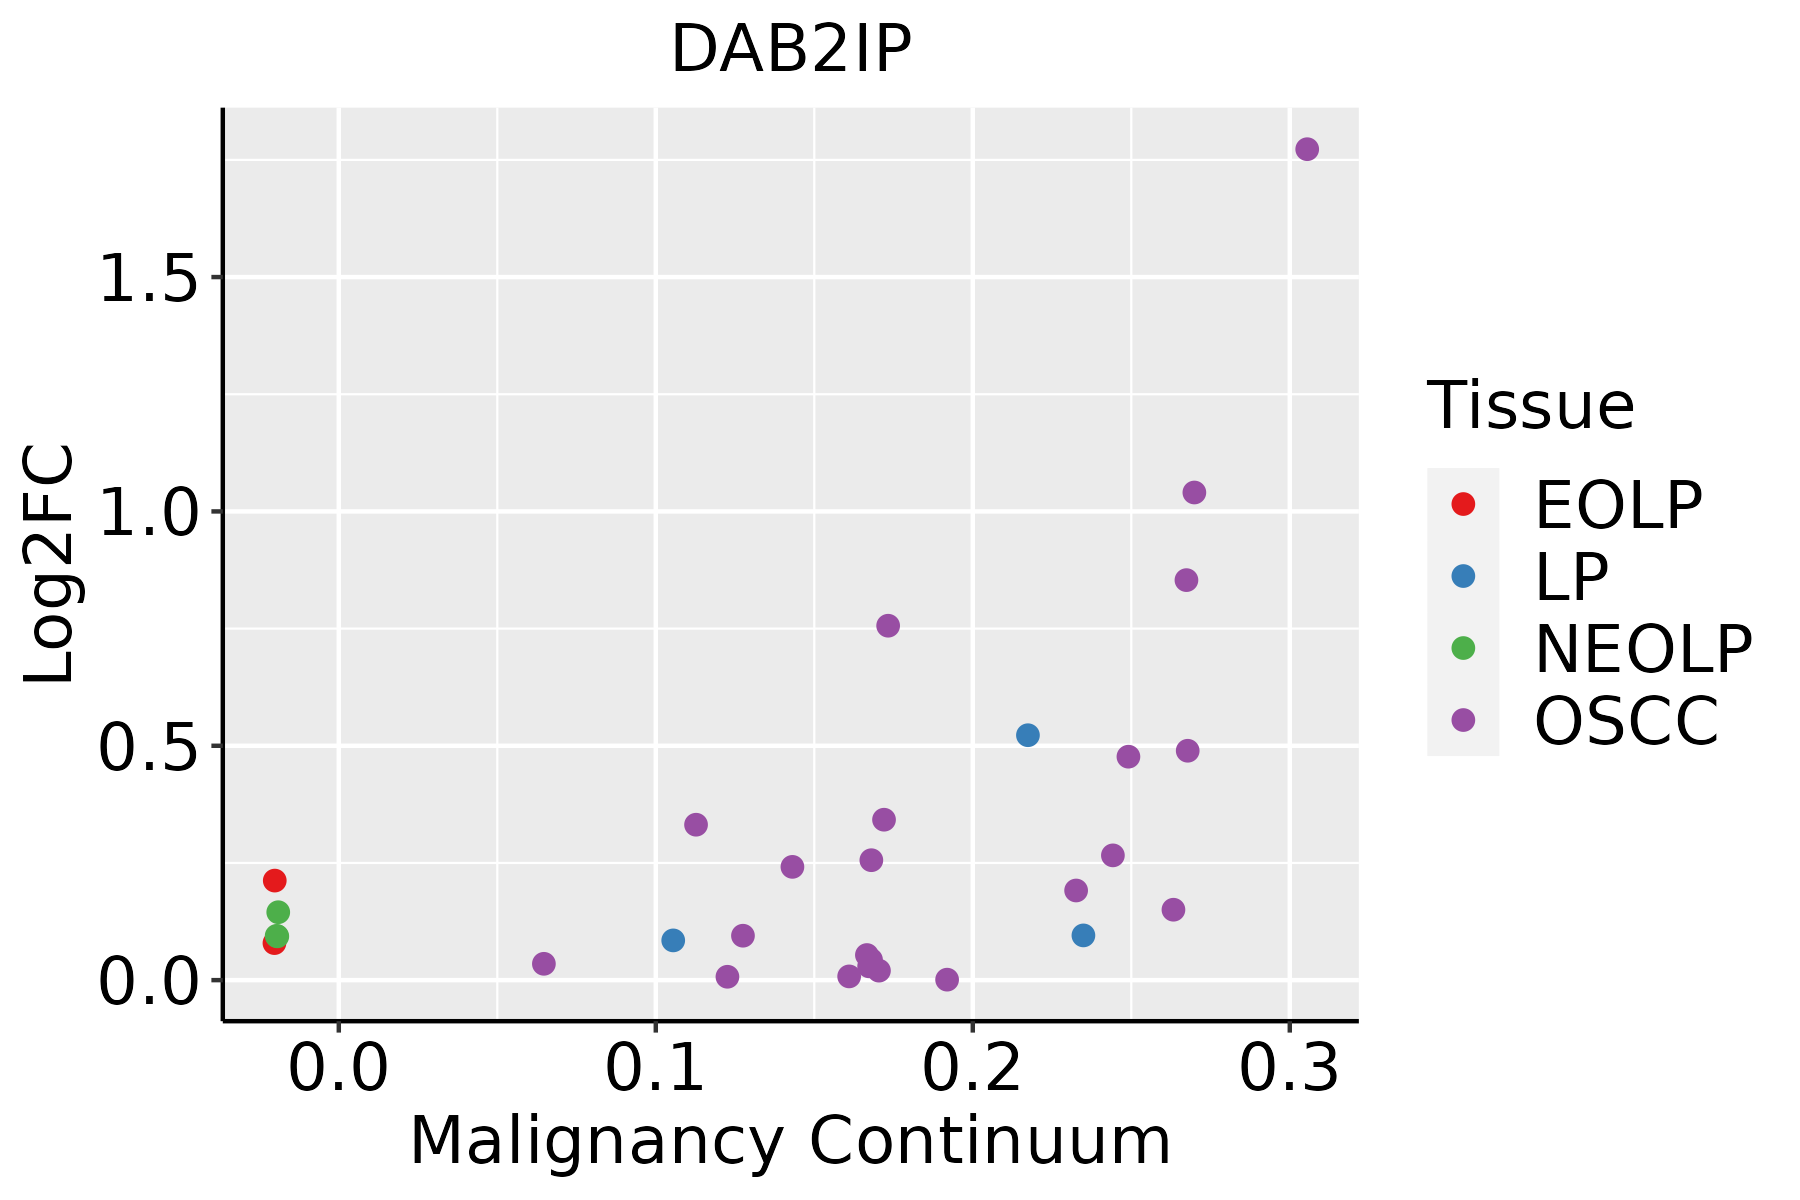 | EOLP: Erosive Oral lichen planus |
| LP: leukoplakia | ||
| NEOLP: Non-erosive oral lichen planus | ||
| OSCC: Oral squamous cell carcinoma | ||
| Prostate |  | BPH: Benign Prostatic Hyperplasia |
| ∗log2FC in expression of this searched gene in stem-like cells from each diseased tissue sample relative to stem-like cells in normal samples in each tissue plotted against the malignancy continuum. Samples are colored based on if they are from different disease stage. |
Top |
Malignant transformation related pathway analysis |
| Find out the enriched GO biological processes and KEGG pathways involved in transition from healthy to precancer to cancer |
| Tissue | Disease Stage | Enriched GO biological Processes |
| Colorectum | AD |  |
| Colorectum | SER |  |
| Colorectum | MSS |  |
| Colorectum | MSI-H |  |
| Colorectum | FAP |  |
| ∗Top 15 enriched GO BP terms are showed in the bar plot of each disease state in each tissue. Each row represents a significant GO biological process which is colored according to the -log10(p.adjust). |
| Page: 1 2 3 4 5 6 7 8 9 |
| GO ID | Tissue | Disease Stage | Description | Gene Ratio | Bg Ratio | pvalue | p.adjust | Count |
| GO:009719310 | Cervix | CC | intrinsic apoptotic signaling pathway | 85/2311 | 288/18723 | 4.56e-15 | 6.46e-12 | 85 |
| GO:004217610 | Cervix | CC | regulation of protein catabolic process | 104/2311 | 391/18723 | 9.39e-15 | 9.36e-12 | 104 |
| GO:200123310 | Cervix | CC | regulation of apoptotic signaling pathway | 96/2311 | 356/18723 | 4.08e-14 | 3.05e-11 | 96 |
| GO:004586210 | Cervix | CC | positive regulation of proteolysis | 95/2311 | 372/18723 | 1.84e-12 | 6.86e-10 | 95 |
| GO:190336210 | Cervix | CC | regulation of cellular protein catabolic process | 72/2311 | 255/18723 | 5.98e-12 | 2.10e-09 | 72 |
| GO:009013210 | Cervix | CC | epithelium migration | 90/2311 | 360/18723 | 2.45e-11 | 6.11e-09 | 90 |
| GO:00016679 | Cervix | CC | ameboidal-type cell migration | 110/2311 | 475/18723 | 2.66e-11 | 6.36e-09 | 110 |
| GO:001063110 | Cervix | CC | epithelial cell migration | 89/2311 | 357/18723 | 3.72e-11 | 8.54e-09 | 89 |
| GO:009013010 | Cervix | CC | tissue migration | 90/2311 | 365/18723 | 5.42e-11 | 1.05e-08 | 90 |
| GO:004573210 | Cervix | CC | positive regulation of protein catabolic process | 65/2311 | 231/18723 | 7.44e-11 | 1.39e-08 | 65 |
| GO:001049810 | Cervix | CC | proteasomal protein catabolic process | 111/2311 | 490/18723 | 8.98e-11 | 1.58e-08 | 111 |
| GO:000989610 | Cervix | CC | positive regulation of catabolic process | 109/2311 | 492/18723 | 5.26e-10 | 6.99e-08 | 109 |
| GO:00510566 | Cervix | CC | regulation of small GTPase mediated signal transduction | 75/2311 | 302/18723 | 1.54e-09 | 1.74e-07 | 75 |
| GO:190305010 | Cervix | CC | regulation of proteolysis involved in cellular protein catabolic process | 60/2311 | 221/18723 | 1.82e-09 | 1.98e-07 | 60 |
| GO:00506737 | Cervix | CC | epithelial cell proliferation | 98/2311 | 437/18723 | 2.01e-09 | 2.15e-07 | 98 |
| GO:004325410 | Cervix | CC | regulation of protein-containing complex assembly | 96/2311 | 428/18723 | 2.91e-09 | 3.05e-07 | 96 |
| GO:001063210 | Cervix | CC | regulation of epithelial cell migration | 72/2311 | 292/18723 | 4.52e-09 | 4.43e-07 | 72 |
| GO:00160557 | Cervix | CC | Wnt signaling pathway | 98/2311 | 444/18723 | 4.82e-09 | 4.65e-07 | 98 |
| GO:01987387 | Cervix | CC | cell-cell signaling by wnt | 98/2311 | 446/18723 | 6.16e-09 | 5.58e-07 | 98 |
| GO:003367410 | Cervix | CC | positive regulation of kinase activity | 101/2311 | 467/18723 | 8.66e-09 | 7.22e-07 | 101 |
| Page: 1 2 3 4 5 6 7 8 9 10 11 12 13 14 15 16 17 18 19 20 21 22 23 24 25 26 27 28 29 30 31 32 33 34 35 36 37 38 |
| Pathway ID | Tissue | Disease Stage | Description | Gene Ratio | Bg Ratio | pvalue | p.adjust | qvalue | Count |
| hsa042109 | Cervix | CC | Apoptosis | 36/1267 | 136/8465 | 3.21e-04 | 1.68e-03 | 9.91e-04 | 36 |
| hsa046686 | Cervix | CC | TNF signaling pathway | 28/1267 | 114/8465 | 4.60e-03 | 1.62e-02 | 9.59e-03 | 28 |
| hsa0421014 | Cervix | CC | Apoptosis | 36/1267 | 136/8465 | 3.21e-04 | 1.68e-03 | 9.91e-04 | 36 |
| hsa0466813 | Cervix | CC | TNF signaling pathway | 28/1267 | 114/8465 | 4.60e-03 | 1.62e-02 | 9.59e-03 | 28 |
| hsa04210 | Colorectum | MSS | Apoptosis | 44/1875 | 136/8465 | 3.66e-03 | 1.66e-02 | 1.01e-02 | 44 |
| hsa042101 | Colorectum | MSS | Apoptosis | 44/1875 | 136/8465 | 3.66e-03 | 1.66e-02 | 1.01e-02 | 44 |
| hsa0421018 | Oral cavity | OSCC | Apoptosis | 101/3704 | 136/8465 | 3.34e-13 | 7.00e-12 | 3.56e-12 | 101 |
| hsa046689 | Oral cavity | OSCC | TNF signaling pathway | 82/3704 | 114/8465 | 8.30e-10 | 9.59e-09 | 4.88e-09 | 82 |
| hsa0421019 | Oral cavity | OSCC | Apoptosis | 101/3704 | 136/8465 | 3.34e-13 | 7.00e-12 | 3.56e-12 | 101 |
| hsa0466816 | Oral cavity | OSCC | TNF signaling pathway | 82/3704 | 114/8465 | 8.30e-10 | 9.59e-09 | 4.88e-09 | 82 |
| hsa0421043 | Oral cavity | EOLP | Apoptosis | 40/1218 | 136/8465 | 4.20e-06 | 2.91e-05 | 1.72e-05 | 40 |
| hsa0466841 | Oral cavity | EOLP | TNF signaling pathway | 35/1218 | 114/8465 | 5.79e-06 | 3.67e-05 | 2.16e-05 | 35 |
| hsa0421053 | Oral cavity | EOLP | Apoptosis | 40/1218 | 136/8465 | 4.20e-06 | 2.91e-05 | 1.72e-05 | 40 |
| hsa0466851 | Oral cavity | EOLP | TNF signaling pathway | 35/1218 | 114/8465 | 5.79e-06 | 3.67e-05 | 2.16e-05 | 35 |
| hsa0421025 | Prostate | Tumor | Apoptosis | 48/1791 | 136/8465 | 9.03e-05 | 6.10e-04 | 3.78e-04 | 48 |
| hsa0466821 | Prostate | Tumor | TNF signaling pathway | 40/1791 | 114/8465 | 3.88e-04 | 2.07e-03 | 1.29e-03 | 40 |
| hsa0421035 | Prostate | Tumor | Apoptosis | 48/1791 | 136/8465 | 9.03e-05 | 6.10e-04 | 3.78e-04 | 48 |
| hsa0466831 | Prostate | Tumor | TNF signaling pathway | 40/1791 | 114/8465 | 3.88e-04 | 2.07e-03 | 1.29e-03 | 40 |
| Page: 1 |
Top |
Cell-cell communication analysis |
| Identification of potential cell-cell interactions between two cell types and their ligand-receptor pairs for different disease states |
| Ligand | Receptor | LRpair | Pathway | Tissue | Disease Stage |
| Page: 1 |
Top |
Single-cell gene regulatory network inference analysis |
| Find out the significant the regulons (TFs) and the target genes of each regulon across cell types for different disease states |
| TF | Cell Type | Tissue | Disease Stage | Target Gene | RSS | Regulon Activity |
| ∗The dot plots of a searched regulon are shown for all cell subpopulations in each disease state of each tissue based on the regulon specific score inferred using pySCENIC and by calculating the average expression. |
| Page: 1 |
Top |
Somatic mutation of malignant transformation related genes |
| Annotation of somatic variants for genes involved in malignant transformation |
| Hugo Symbol | Variant Class | Variant Classification | dbSNP RS | HGVSc | HGVSp | HGVSp Short | SWISSPROT | BIOTYPE | SIFT | PolyPhen | Tumor Sample Barcode | Tissue | Histology | Sex | Age | Stage | Therapy Types | Drugs | Outcome |
| DAB2IP | SNV | Missense_Mutation | c.3387N>C | p.Glu1129Asp | p.E1129D | Q5VWQ8 | protein_coding | tolerated(0.1) | benign(0.159) | TCGA-A2-A0EQ-01 | Breast | breast invasive carcinoma | Female | <65 | I/II | Chemotherapy | adriamycin | SD | |
| DAB2IP | SNV | Missense_Mutation | c.481G>A | p.Glu161Lys | p.E161K | Q5VWQ8 | protein_coding | deleterious(0.02) | probably_damaging(0.984) | TCGA-A8-A06U-01 | Breast | breast invasive carcinoma | Female | >=65 | I/II | Unknown | Unknown | SD | |
| DAB2IP | SNV | Missense_Mutation | novel | c.577N>A | p.Glu193Lys | p.E193K | Q5VWQ8 | protein_coding | deleterious(0) | probably_damaging(0.999) | TCGA-BH-A0BJ-01 | Breast | breast invasive carcinoma | Female | <65 | I/II | Chemotherapy | doxorubicin | SD |
| DAB2IP | SNV | Missense_Mutation | rs141771432 | c.1460N>A | p.Arg487Gln | p.R487Q | Q5VWQ8 | protein_coding | deleterious(0) | probably_damaging(0.991) | TCGA-BH-A18U-01 | Breast | breast invasive carcinoma | Female | >=65 | III/IV | Unknown | Unknown | SD |
| DAB2IP | SNV | Missense_Mutation | c.1486N>T | p.Arg496Cys | p.R496C | Q5VWQ8 | protein_coding | deleterious(0) | probably_damaging(1) | TCGA-C8-A12O-01 | Breast | breast invasive carcinoma | Female | <65 | I/II | Unknown | Unknown | SD | |
| DAB2IP | SNV | Missense_Mutation | c.686G>A | p.Gly229Asp | p.G229D | Q5VWQ8 | protein_coding | deleterious(0) | probably_damaging(1) | TCGA-E2-A15T-01 | Breast | breast invasive carcinoma | Female | >=65 | I/II | Hormone Therapy | arimidex | SD | |
| DAB2IP | insertion | In_Frame_Ins | novel | c.1065_1066insTCC | p.Leu355_Gln356insSer | p.L355_Q356insS | Q5VWQ8 | protein_coding | TCGA-AN-A04A-01 | Breast | breast invasive carcinoma | Female | <65 | III/IV | Unknown | Unknown | SD | ||
| DAB2IP | insertion | Frame_Shift_Ins | novel | c.1067_1068insGGCTGGTGCCCTCTGTGTTCCCACT | p.Ser357AlafsTer47 | p.S357Afs*47 | Q5VWQ8 | protein_coding | TCGA-AN-A04A-01 | Breast | breast invasive carcinoma | Female | <65 | III/IV | Unknown | Unknown | SD | ||
| DAB2IP | insertion | Frame_Shift_Ins | novel | c.3303_3304insCTGGCTATTTATAAGATACTTTTTTTTTTAA | p.Ile1102LeufsTer13 | p.I1102Lfs*13 | Q5VWQ8 | protein_coding | TCGA-BH-A0HK-01 | Breast | breast invasive carcinoma | Female | >=65 | I/II | Hormone Therapy | arimidex | SD | ||
| DAB2IP | SNV | Missense_Mutation | c.1225N>A | p.Ala409Thr | p.A409T | Q5VWQ8 | protein_coding | tolerated(0.26) | possibly_damaging(0.603) | TCGA-2W-A8YY-01 | Cervix | cervical & endocervical cancer | Female | <65 | I/II | Chemotherapy | cisplatin | CR |
| Page: 1 2 3 4 5 6 7 8 9 10 11 |
Top |
Related drugs of malignant transformation related genes |
| Identification of chemicals and drugs interact with genes involved in malignant transfromation |
| (DGIdb 4.0) |
| Entrez ID | Symbol | Category | Interaction Types | Drug Claim Name | Drug Name | PMIDs |
| Page: 1 |

Copyright 2023-Present -The University of Texas Health Science Center at Houston |