
|
|||||
|
 | |
| |
| |
| |
| |
| |
|
Gene: DAB2 |
Gene summary for DAB2 |
| Gene information | Species | Human | Gene symbol | DAB2 | Gene ID | 1601 |
| Gene name | DAB adaptor protein 2 | |
| Gene Alias | DOC-2 | |
| Cytomap | 5p13.1 | |
| Gene Type | protein-coding | GO ID | GO:0000122 | UniProtAcc | P98082 |
Top |
Malignant transformation analysis |
| Identification of the aberrant gene expression in precancerous and cancerous lesions by comparing the gene expression of stem-like cells in diseased tissues with normal stem cells |
| Entrez ID | Symbol | Replicates | Species | Organ | Tissue | Adj P-value | Log2FC | Malignancy |
| 1601 | DAB2 | HTA11_1938_2000001011 | Human | Colorectum | AD | 3.86e-16 | 5.81e-01 | -0.0811 |
| 1601 | DAB2 | HTA11_78_2000001011 | Human | Colorectum | AD | 3.91e-06 | 3.85e-01 | -0.1088 |
| 1601 | DAB2 | HTA11_1391_2000001011 | Human | Colorectum | AD | 9.86e-17 | 5.47e-01 | -0.059 |
| 1601 | DAB2 | HTA11_7862_2000001011 | Human | Colorectum | AD | 3.58e-02 | 2.27e-01 | -0.0179 |
| 1601 | DAB2 | HTA11_866_3004761011 | Human | Colorectum | AD | 5.64e-04 | 2.51e-01 | 0.096 |
| 1601 | DAB2 | HTA11_10711_2000001011 | Human | Colorectum | AD | 1.53e-06 | 4.11e-01 | 0.0338 |
| 1601 | DAB2 | HTA11_7696_3000711011 | Human | Colorectum | AD | 3.60e-29 | 6.31e-01 | 0.0674 |
| 1601 | DAB2 | HTA11_6818_2000001011 | Human | Colorectum | AD | 1.07e-04 | 4.16e-01 | 0.0112 |
| 1601 | DAB2 | HTA11_6818_2000001021 | Human | Colorectum | AD | 2.33e-05 | 3.29e-01 | 0.0588 |
| 1601 | DAB2 | HTA11_99999970781_79442 | Human | Colorectum | MSS | 6.35e-08 | 2.59e-01 | 0.294 |
| 1601 | DAB2 | HTA11_99999965104_69814 | Human | Colorectum | MSS | 2.84e-09 | 4.11e-01 | 0.281 |
| 1601 | DAB2 | HTA11_99999971662_82457 | Human | Colorectum | MSS | 4.43e-05 | 2.24e-01 | 0.3859 |
| 1601 | DAB2 | A002-C-021 | Human | Colorectum | FAP | 8.00e-03 | 1.47e-01 | 0.1171 |
| 1601 | DAB2 | P2T-E | Human | Esophagus | ESCC | 2.88e-05 | 5.46e-02 | 0.1177 |
| 1601 | DAB2 | P9T-E | Human | Esophagus | ESCC | 5.94e-06 | 2.88e-01 | 0.1131 |
| 1601 | DAB2 | P16T-E | Human | Esophagus | ESCC | 2.03e-13 | 1.29e-01 | 0.1153 |
| 1601 | DAB2 | P32T-E | Human | Esophagus | ESCC | 3.62e-19 | 6.73e-01 | 0.1666 |
| 1601 | DAB2 | P37T-E | Human | Esophagus | ESCC | 2.19e-10 | 2.23e-01 | 0.1371 |
| 1601 | DAB2 | P40T-E | Human | Esophagus | ESCC | 1.61e-02 | 1.62e-01 | 0.109 |
| 1601 | DAB2 | P44T-E | Human | Esophagus | ESCC | 7.96e-06 | 3.88e-01 | 0.1096 |
| Page: 1 2 3 |
| Tissue | Expression Dynamics | Abbreviation |
| Colorectum (GSE201348) |  | FAP: Familial adenomatous polyposis |
| CRC: Colorectal cancer | ||
| Colorectum (HTA11) |  | AD: Adenomas |
| SER: Sessile serrated lesions | ||
| MSI-H: Microsatellite-high colorectal cancer | ||
| MSS: Microsatellite stable colorectal cancer | ||
| Esophagus |  | ESCC: Esophageal squamous cell carcinoma |
| HGIN: High-grade intraepithelial neoplasias | ||
| LGIN: Low-grade intraepithelial neoplasias | ||
| Liver |  | HCC: Hepatocellular carcinoma |
| NAFLD: Non-alcoholic fatty liver disease | ||
| Thyroid | 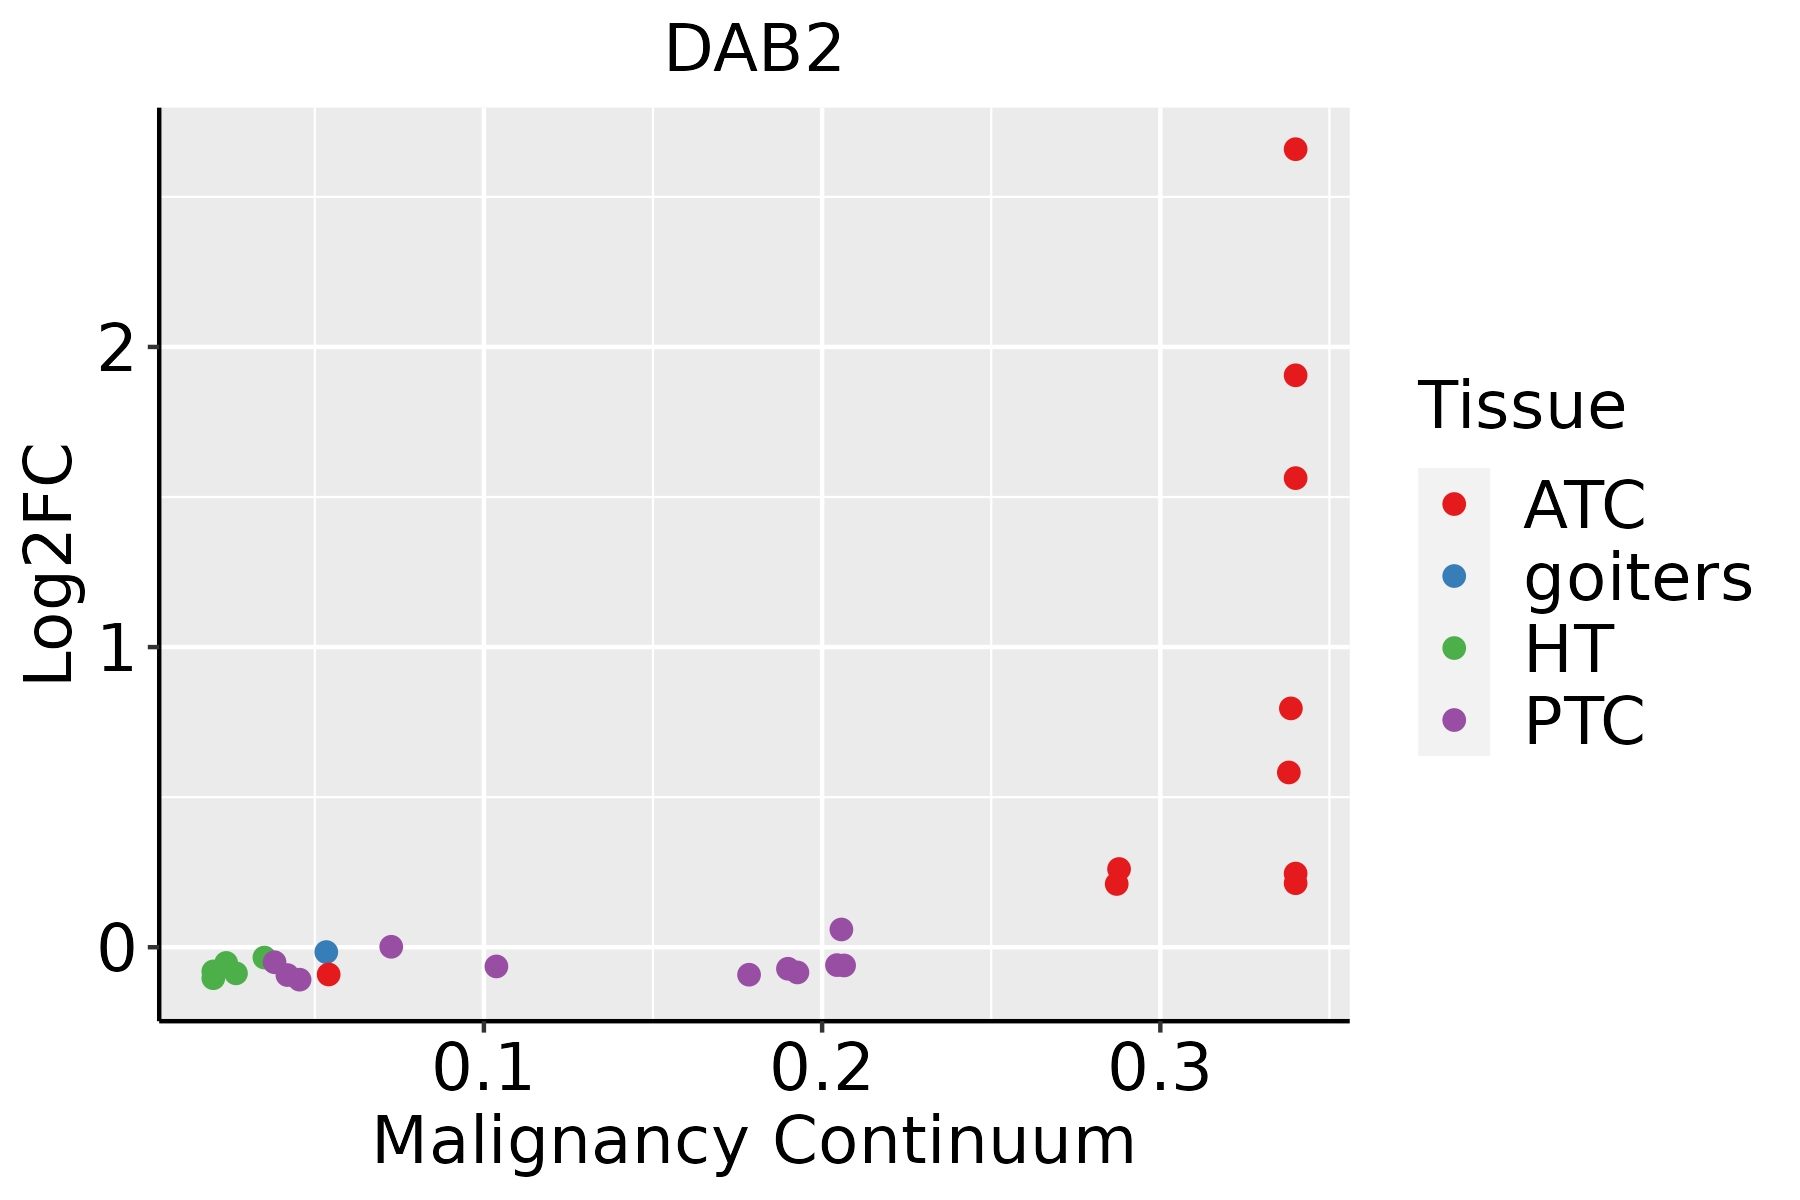 | ATC: Anaplastic thyroid cancer |
| HT: Hashimoto's thyroiditis | ||
| PTC: Papillary thyroid cancer |
| ∗log2FC in expression of this searched gene in stem-like cells from each diseased tissue sample relative to stem-like cells in normal samples in each tissue plotted against the malignancy continuum. Samples are colored based on if they are from different disease stage. |
Top |
Malignant transformation related pathway analysis |
| Find out the enriched GO biological processes and KEGG pathways involved in transition from healthy to precancer to cancer |
| Tissue | Disease Stage | Enriched GO biological Processes |
| Colorectum | AD |  |
| Colorectum | SER |  |
| Colorectum | MSS |  |
| Colorectum | MSI-H |  |
| Colorectum | FAP |  |
| ∗Top 15 enriched GO BP terms are showed in the bar plot of each disease state in each tissue. Each row represents a significant GO biological process which is colored according to the -log10(p.adjust). |
| Page: 1 2 3 4 5 6 7 8 9 |
| GO ID | Tissue | Disease Stage | Description | Gene Ratio | Bg Ratio | pvalue | p.adjust | Count |
| GO:009719310 | Cervix | CC | intrinsic apoptotic signaling pathway | 85/2311 | 288/18723 | 4.56e-15 | 6.46e-12 | 85 |
| GO:004217610 | Cervix | CC | regulation of protein catabolic process | 104/2311 | 391/18723 | 9.39e-15 | 9.36e-12 | 104 |
| GO:200123310 | Cervix | CC | regulation of apoptotic signaling pathway | 96/2311 | 356/18723 | 4.08e-14 | 3.05e-11 | 96 |
| GO:004586210 | Cervix | CC | positive regulation of proteolysis | 95/2311 | 372/18723 | 1.84e-12 | 6.86e-10 | 95 |
| GO:190336210 | Cervix | CC | regulation of cellular protein catabolic process | 72/2311 | 255/18723 | 5.98e-12 | 2.10e-09 | 72 |
| GO:009013210 | Cervix | CC | epithelium migration | 90/2311 | 360/18723 | 2.45e-11 | 6.11e-09 | 90 |
| GO:00016679 | Cervix | CC | ameboidal-type cell migration | 110/2311 | 475/18723 | 2.66e-11 | 6.36e-09 | 110 |
| GO:001063110 | Cervix | CC | epithelial cell migration | 89/2311 | 357/18723 | 3.72e-11 | 8.54e-09 | 89 |
| GO:009013010 | Cervix | CC | tissue migration | 90/2311 | 365/18723 | 5.42e-11 | 1.05e-08 | 90 |
| GO:004573210 | Cervix | CC | positive regulation of protein catabolic process | 65/2311 | 231/18723 | 7.44e-11 | 1.39e-08 | 65 |
| GO:001049810 | Cervix | CC | proteasomal protein catabolic process | 111/2311 | 490/18723 | 8.98e-11 | 1.58e-08 | 111 |
| GO:000989610 | Cervix | CC | positive regulation of catabolic process | 109/2311 | 492/18723 | 5.26e-10 | 6.99e-08 | 109 |
| GO:00510566 | Cervix | CC | regulation of small GTPase mediated signal transduction | 75/2311 | 302/18723 | 1.54e-09 | 1.74e-07 | 75 |
| GO:190305010 | Cervix | CC | regulation of proteolysis involved in cellular protein catabolic process | 60/2311 | 221/18723 | 1.82e-09 | 1.98e-07 | 60 |
| GO:00506737 | Cervix | CC | epithelial cell proliferation | 98/2311 | 437/18723 | 2.01e-09 | 2.15e-07 | 98 |
| GO:004325410 | Cervix | CC | regulation of protein-containing complex assembly | 96/2311 | 428/18723 | 2.91e-09 | 3.05e-07 | 96 |
| GO:001063210 | Cervix | CC | regulation of epithelial cell migration | 72/2311 | 292/18723 | 4.52e-09 | 4.43e-07 | 72 |
| GO:00160557 | Cervix | CC | Wnt signaling pathway | 98/2311 | 444/18723 | 4.82e-09 | 4.65e-07 | 98 |
| GO:01987387 | Cervix | CC | cell-cell signaling by wnt | 98/2311 | 446/18723 | 6.16e-09 | 5.58e-07 | 98 |
| GO:003367410 | Cervix | CC | positive regulation of kinase activity | 101/2311 | 467/18723 | 8.66e-09 | 7.22e-07 | 101 |
| Page: 1 2 3 4 5 6 7 8 9 10 11 12 13 14 15 16 17 18 19 20 21 22 23 24 25 26 27 28 29 30 31 32 33 34 35 36 37 38 39 40 41 42 43 44 45 46 47 48 49 50 51 52 53 54 55 56 57 58 59 60 61 62 63 |
| Pathway ID | Tissue | Disease Stage | Description | Gene Ratio | Bg Ratio | pvalue | p.adjust | qvalue | Count |
| hsa04144 | Colorectum | AD | Endocytosis | 111/2092 | 251/8465 | 5.95e-12 | 1.42e-10 | 9.08e-11 | 111 |
| hsa041441 | Colorectum | AD | Endocytosis | 111/2092 | 251/8465 | 5.95e-12 | 1.42e-10 | 9.08e-11 | 111 |
| hsa041444 | Colorectum | MSS | Endocytosis | 102/1875 | 251/8465 | 1.85e-11 | 4.43e-10 | 2.71e-10 | 102 |
| hsa041445 | Colorectum | MSS | Endocytosis | 102/1875 | 251/8465 | 1.85e-11 | 4.43e-10 | 2.71e-10 | 102 |
| hsa041446 | Colorectum | FAP | Endocytosis | 78/1404 | 251/8465 | 6.20e-09 | 2.96e-07 | 1.80e-07 | 78 |
| hsa041447 | Colorectum | FAP | Endocytosis | 78/1404 | 251/8465 | 6.20e-09 | 2.96e-07 | 1.80e-07 | 78 |
| hsa0414412 | Liver | Cirrhotic | Endocytosis | 119/2530 | 251/8465 | 2.33e-09 | 4.56e-08 | 2.81e-08 | 119 |
| hsa0414413 | Liver | Cirrhotic | Endocytosis | 119/2530 | 251/8465 | 2.33e-09 | 4.56e-08 | 2.81e-08 | 119 |
| hsa0414422 | Liver | HCC | Endocytosis | 178/4020 | 251/8465 | 2.03e-14 | 5.22e-13 | 2.91e-13 | 178 |
| hsa0414432 | Liver | HCC | Endocytosis | 178/4020 | 251/8465 | 2.03e-14 | 5.22e-13 | 2.91e-13 | 178 |
| Page: 1 |
Top |
Cell-cell communication analysis |
| Identification of potential cell-cell interactions between two cell types and their ligand-receptor pairs for different disease states |
| Ligand | Receptor | LRpair | Pathway | Tissue | Disease Stage |
| Page: 1 |
Top |
Single-cell gene regulatory network inference analysis |
| Find out the significant the regulons (TFs) and the target genes of each regulon across cell types for different disease states |
| TF | Cell Type | Tissue | Disease Stage | Target Gene | RSS | Regulon Activity |
| DAB2 | INCAF | Skin | ADJ | CTSL,HMGA1,CCDC80, etc. | 1.92e-01 |  |
| DAB2 | INCAF | Skin | SCCIS | CTSL,HMGA1,CCDC80, etc. | 2.45e-01 |  |
| ∗The dot plots of a searched regulon are shown for all cell subpopulations in each disease state of each tissue based on the regulon specific score inferred using pySCENIC and by calculating the average expression. |
| Page: 1 |
Top |
Somatic mutation of malignant transformation related genes |
| Annotation of somatic variants for genes involved in malignant transformation |
| Hugo Symbol | Variant Class | Variant Classification | dbSNP RS | HGVSc | HGVSp | HGVSp Short | SWISSPROT | BIOTYPE | SIFT | PolyPhen | Tumor Sample Barcode | Tissue | Histology | Sex | Age | Stage | Therapy Types | Drugs | Outcome |
| DAB2 | SNV | Missense_Mutation | c.1639N>A | p.Gly547Ser | p.G547S | P98082 | protein_coding | tolerated(0.28) | benign(0.043) | TCGA-A2-A0D2-01 | Breast | breast invasive carcinoma | Female | <65 | I/II | Chemotherapy | adriamycin | SD | |
| DAB2 | SNV | Missense_Mutation | rs376782436 | c.1729G>A | p.Ala577Thr | p.A577T | P98082 | protein_coding | tolerated(0.12) | benign(0.003) | TCGA-A7-A0CJ-01 | Breast | breast invasive carcinoma | Female | <65 | I/II | Chemotherapy | cytoxan | SD |
| DAB2 | SNV | Missense_Mutation | novel | c.1797N>A | p.Phe599Leu | p.F599L | P98082 | protein_coding | deleterious(0.03) | possibly_damaging(0.459) | TCGA-AR-A0U0-01 | Breast | breast invasive carcinoma | Female | >=65 | I/II | Unknown | Unknown | SD |
| DAB2 | SNV | Missense_Mutation | c.5C>T | p.Ser2Phe | p.S2F | P98082 | protein_coding | deleterious(0) | probably_damaging(0.996) | TCGA-BH-A0W4-01 | Breast | breast invasive carcinoma | Female | <65 | I/II | Unknown | Unknown | SD | |
| DAB2 | SNV | Missense_Mutation | c.796N>G | p.Pro266Ala | p.P266A | P98082 | protein_coding | deleterious(0.05) | possibly_damaging(0.62) | TCGA-BH-A1F0-01 | Breast | breast invasive carcinoma | Female | >=65 | I/II | Unknown | Unknown | PD | |
| DAB2 | SNV | Missense_Mutation | c.2277N>C | p.Glu759Asp | p.E759D | P98082 | protein_coding | tolerated(1) | benign(0) | TCGA-E2-A10C-01 | Breast | breast invasive carcinoma | Female | <65 | I/II | Chemotherapy | cytoxan | SD | |
| DAB2 | SNV | Missense_Mutation | novel | c.1546N>G | p.Thr516Ala | p.T516A | P98082 | protein_coding | tolerated(0.93) | benign(0) | TCGA-E2-A574-01 | Breast | breast invasive carcinoma | Female | <65 | I/II | Chemotherapy | adriamycin | SD |
| DAB2 | SNV | Missense_Mutation | novel | c.1931N>T | p.Gly644Val | p.G644V | P98082 | protein_coding | deleterious(0) | probably_damaging(0.943) | TCGA-E9-A3HO-01 | Breast | breast invasive carcinoma | Female | <65 | I/II | Chemotherapy | cyclophosphamide | CR |
| DAB2 | insertion | Nonsense_Mutation | novel | c.1317_1318insTGACTCTTTTGCTTTTGCTCATAAAATGATGATGCATC | p.Gly440Ter | p.G440* | P98082 | protein_coding | TCGA-A2-A0CX-01 | Breast | breast invasive carcinoma | Female | <65 | I/II | Chemotherapy | adriamycin | SD | ||
| DAB2 | insertion | Nonsense_Mutation | novel | c.1581_1582insACTTTGATGCTAATCAACTATTGA | p.Met527_Ala528insThrLeuMetLeuIleAsnTyrTer | p.M527_A528insTLMLINY* | P98082 | protein_coding | TCGA-AN-A0FX-01 | Breast | breast invasive carcinoma | Female | <65 | I/II | Unknown | Unknown | SD |
| Page: 1 2 3 4 5 6 7 8 9 10 11 12 |
Top |
Related drugs of malignant transformation related genes |
| Identification of chemicals and drugs interact with genes involved in malignant transfromation |
| (DGIdb 4.0) |
| Entrez ID | Symbol | Category | Interaction Types | Drug Claim Name | Drug Name | PMIDs |
| Page: 1 |

Copyright 2023-Present -The University of Texas Health Science Center at Houston |