
|
|||||
|
 | |
| |
| |
| |
| |
| |
|
Gene: DAAM1 |
Gene summary for DAAM1 |
| Gene information | Species | Human | Gene symbol | DAAM1 | Gene ID | 23002 |
| Gene name | dishevelled associated activator of morphogenesis 1 | |
| Gene Alias | DAAM1 | |
| Cytomap | 14q23.1 | |
| Gene Type | protein-coding | GO ID | GO:0001736 | UniProtAcc | Q9Y4D1 |
Top |
Malignant transformation analysis |
| Identification of the aberrant gene expression in precancerous and cancerous lesions by comparing the gene expression of stem-like cells in diseased tissues with normal stem cells |
| Entrez ID | Symbol | Replicates | Species | Organ | Tissue | Adj P-value | Log2FC | Malignancy |
| 23002 | DAAM1 | CA_HPV_2 | Human | Cervix | CC | 8.82e-05 | 2.63e-01 | 0.0391 |
| 23002 | DAAM1 | CCI_1 | Human | Cervix | CC | 1.53e-06 | 8.24e-01 | 0.528 |
| 23002 | DAAM1 | CCI_2 | Human | Cervix | CC | 1.05e-05 | 8.69e-01 | 0.5249 |
| 23002 | DAAM1 | CCI_3 | Human | Cervix | CC | 2.86e-02 | 4.75e-01 | 0.516 |
| 23002 | DAAM1 | Tumor | Human | Cervix | CC | 1.41e-19 | 5.40e-01 | 0.1241 |
| 23002 | DAAM1 | sample3 | Human | Cervix | CC | 5.98e-36 | 6.78e-01 | 0.1387 |
| 23002 | DAAM1 | T3 | Human | Cervix | CC | 8.22e-32 | 6.49e-01 | 0.1389 |
| 23002 | DAAM1 | HTA11_3410_2000001011 | Human | Colorectum | AD | 3.49e-10 | -4.61e-01 | 0.0155 |
| 23002 | DAAM1 | HTA11_3361_2000001011 | Human | Colorectum | AD | 6.39e-04 | -5.08e-01 | -0.1207 |
| 23002 | DAAM1 | HTA11_696_2000001011 | Human | Colorectum | AD | 3.63e-06 | -3.20e-01 | -0.1464 |
| 23002 | DAAM1 | HTA11_99999971662_82457 | Human | Colorectum | MSS | 3.21e-05 | -3.23e-01 | 0.3859 |
| 23002 | DAAM1 | HTA11_99999973899_84307 | Human | Colorectum | MSS | 2.56e-02 | -4.75e-01 | 0.2585 |
| 23002 | DAAM1 | HTA11_99999974143_84620 | Human | Colorectum | MSS | 1.73e-16 | -5.18e-01 | 0.3005 |
| 23002 | DAAM1 | A015-C-203 | Human | Colorectum | FAP | 6.11e-24 | -9.49e-02 | -0.1294 |
| 23002 | DAAM1 | A015-C-204 | Human | Colorectum | FAP | 1.32e-03 | -1.65e-01 | -0.0228 |
| 23002 | DAAM1 | A002-C-201 | Human | Colorectum | FAP | 2.38e-11 | -2.83e-01 | 0.0324 |
| 23002 | DAAM1 | A002-C-203 | Human | Colorectum | FAP | 9.96e-03 | -1.72e-01 | 0.2786 |
| 23002 | DAAM1 | A001-C-119 | Human | Colorectum | FAP | 1.06e-03 | -2.38e-01 | -0.1557 |
| 23002 | DAAM1 | A001-C-108 | Human | Colorectum | FAP | 2.72e-15 | -1.31e-01 | -0.0272 |
| 23002 | DAAM1 | A002-C-205 | Human | Colorectum | FAP | 7.52e-16 | -1.75e-01 | -0.1236 |
| Page: 1 2 3 4 5 6 7 8 9 |
| Tissue | Expression Dynamics | Abbreviation |
| Cervix | 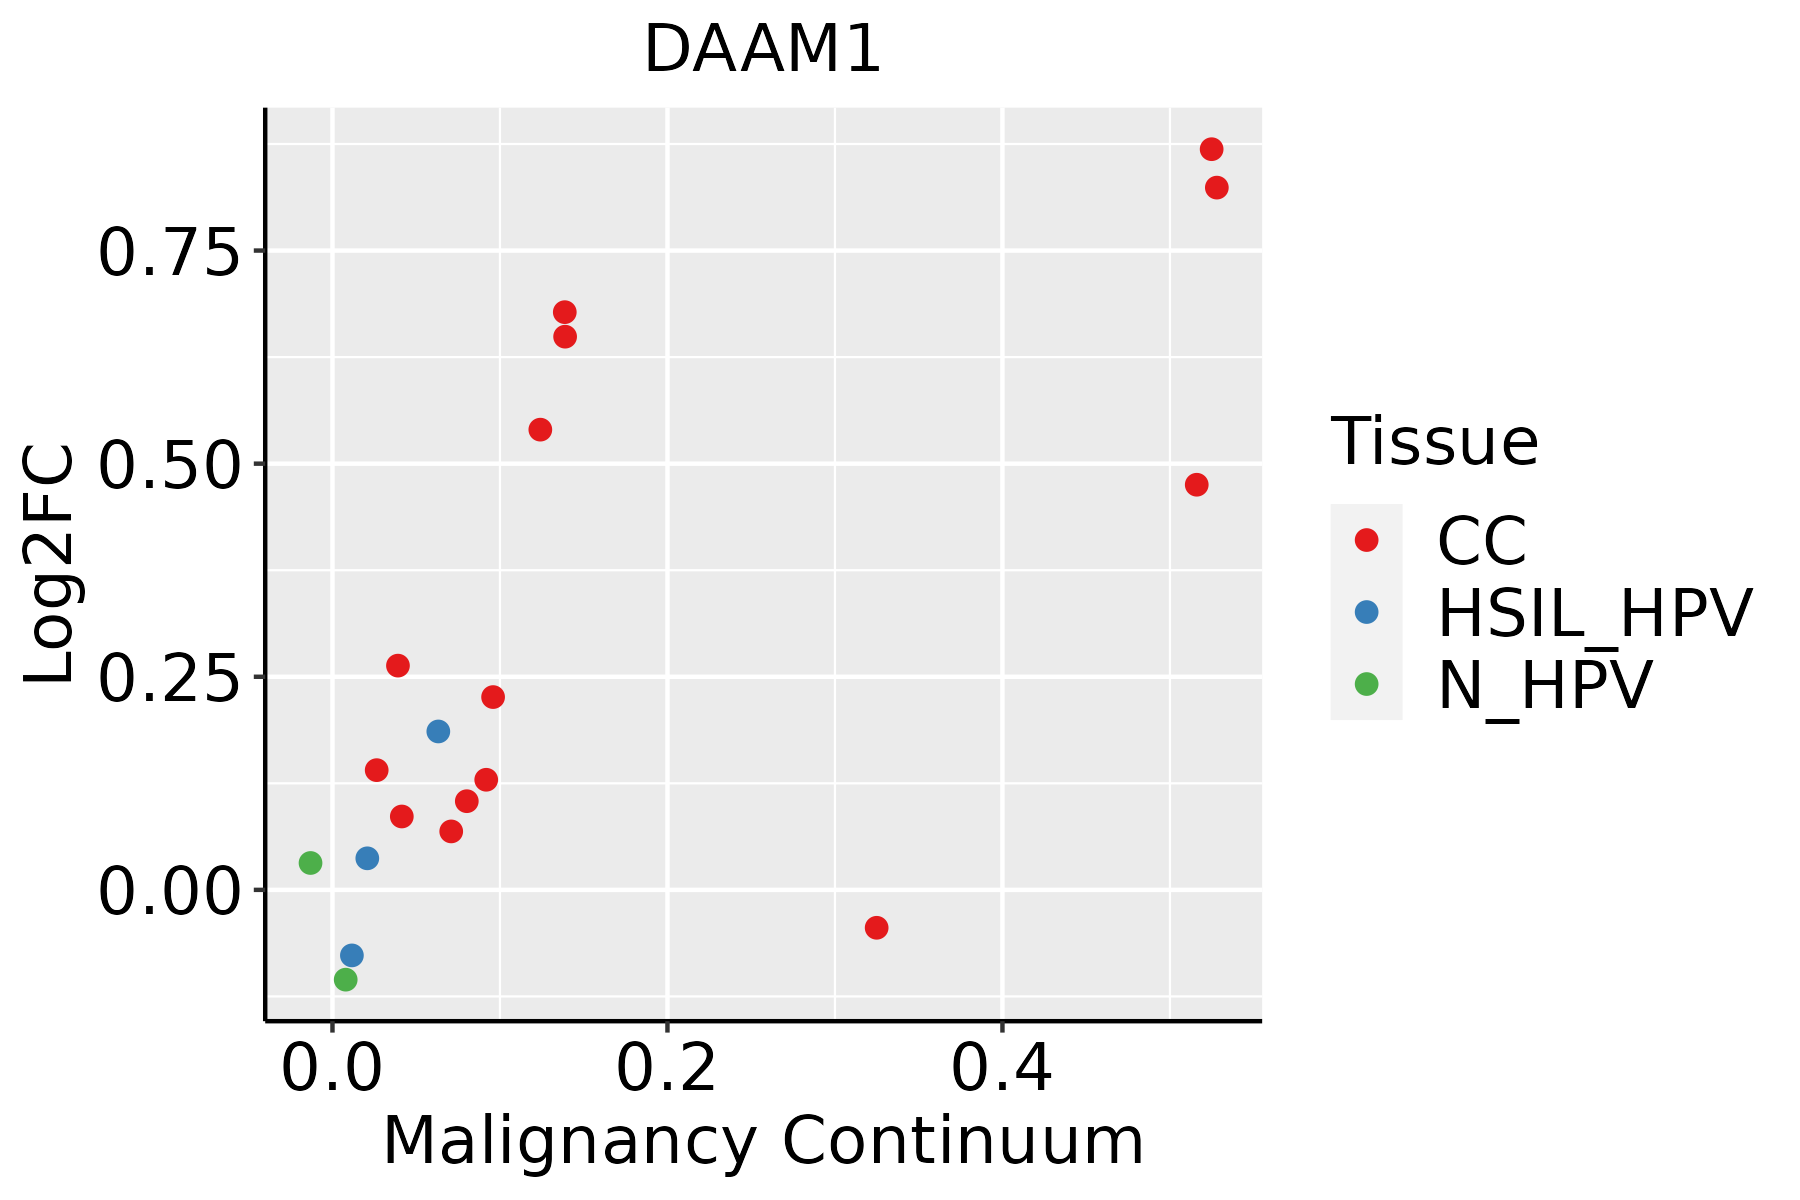 | CC: Cervix cancer |
| HSIL_HPV: HPV-infected high-grade squamous intraepithelial lesions | ||
| N_HPV: HPV-infected normal cervix | ||
| Colorectum (GSE201348) | 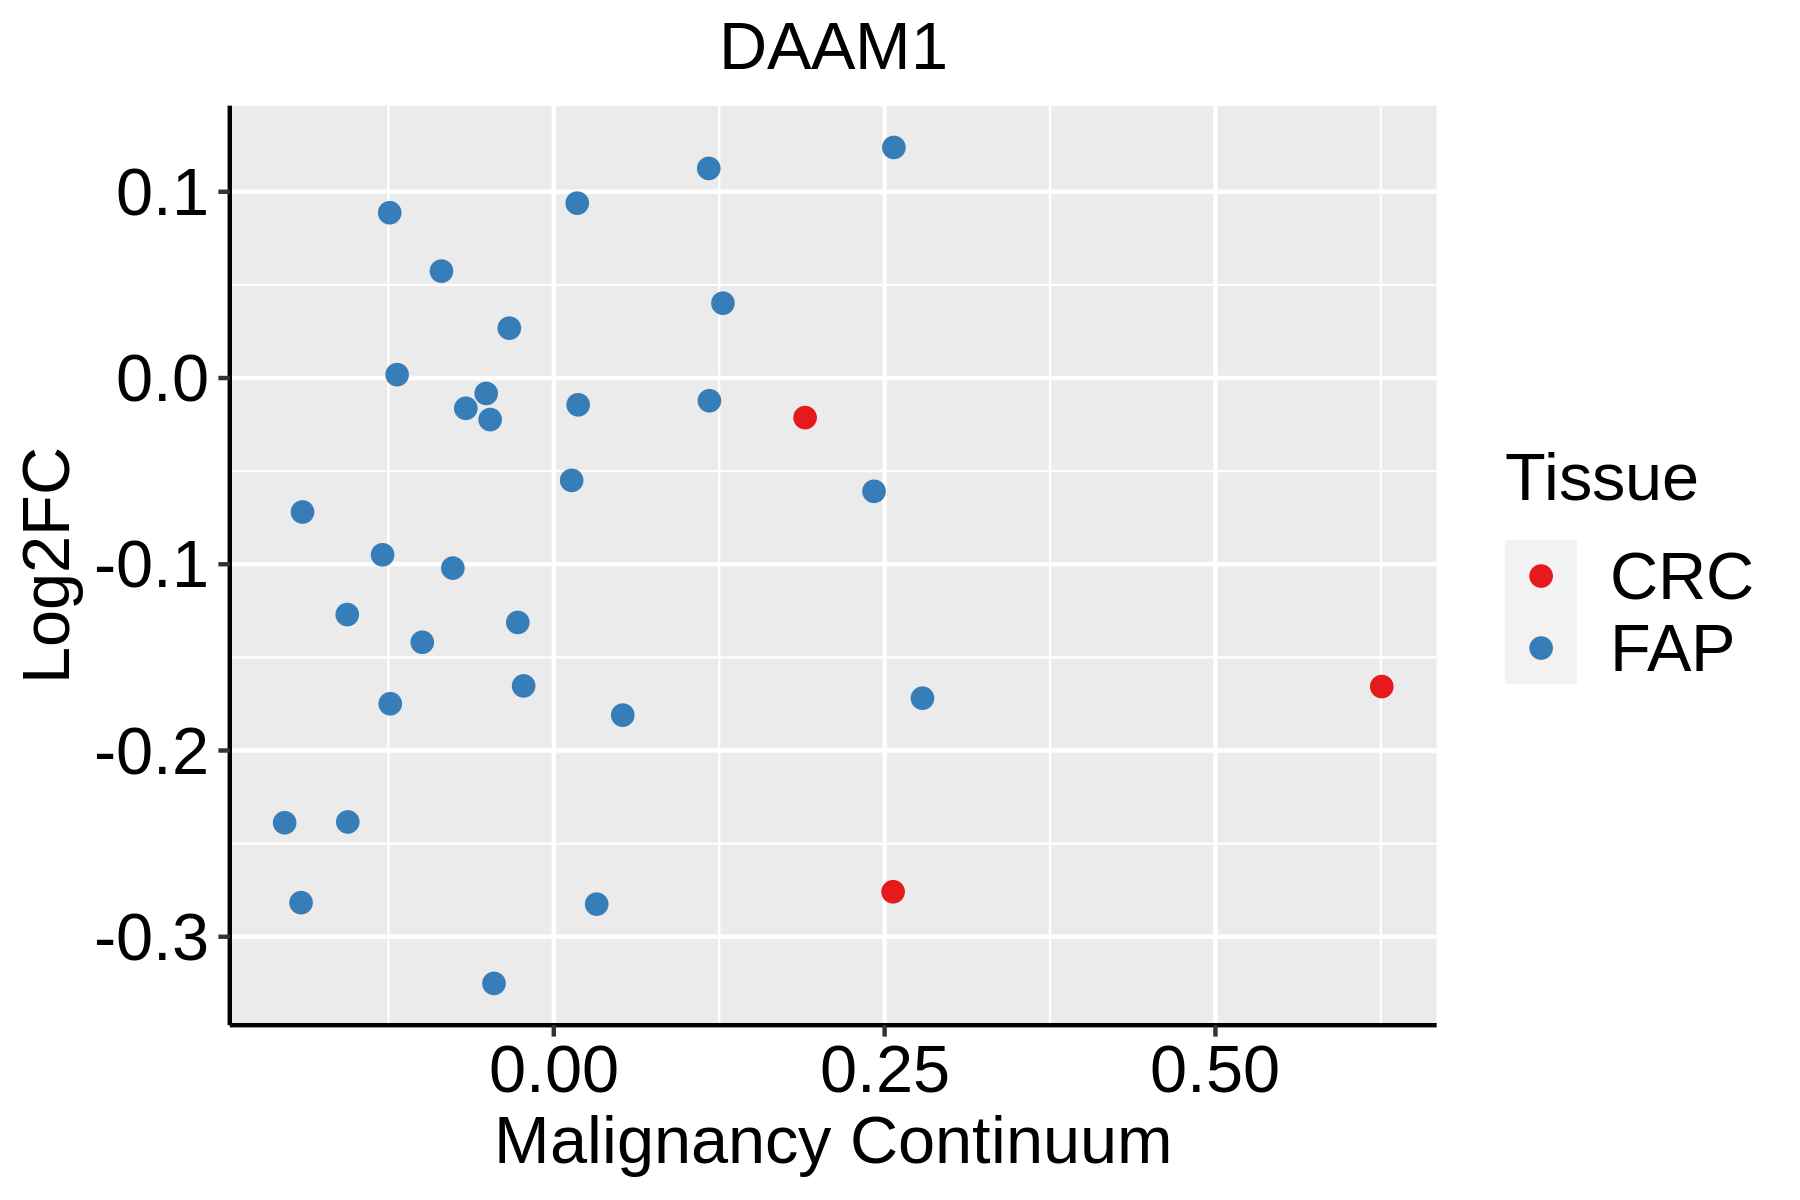 | FAP: Familial adenomatous polyposis |
| CRC: Colorectal cancer | ||
| Colorectum (HTA11) |  | AD: Adenomas |
| SER: Sessile serrated lesions | ||
| MSI-H: Microsatellite-high colorectal cancer | ||
| MSS: Microsatellite stable colorectal cancer | ||
| Esophagus | 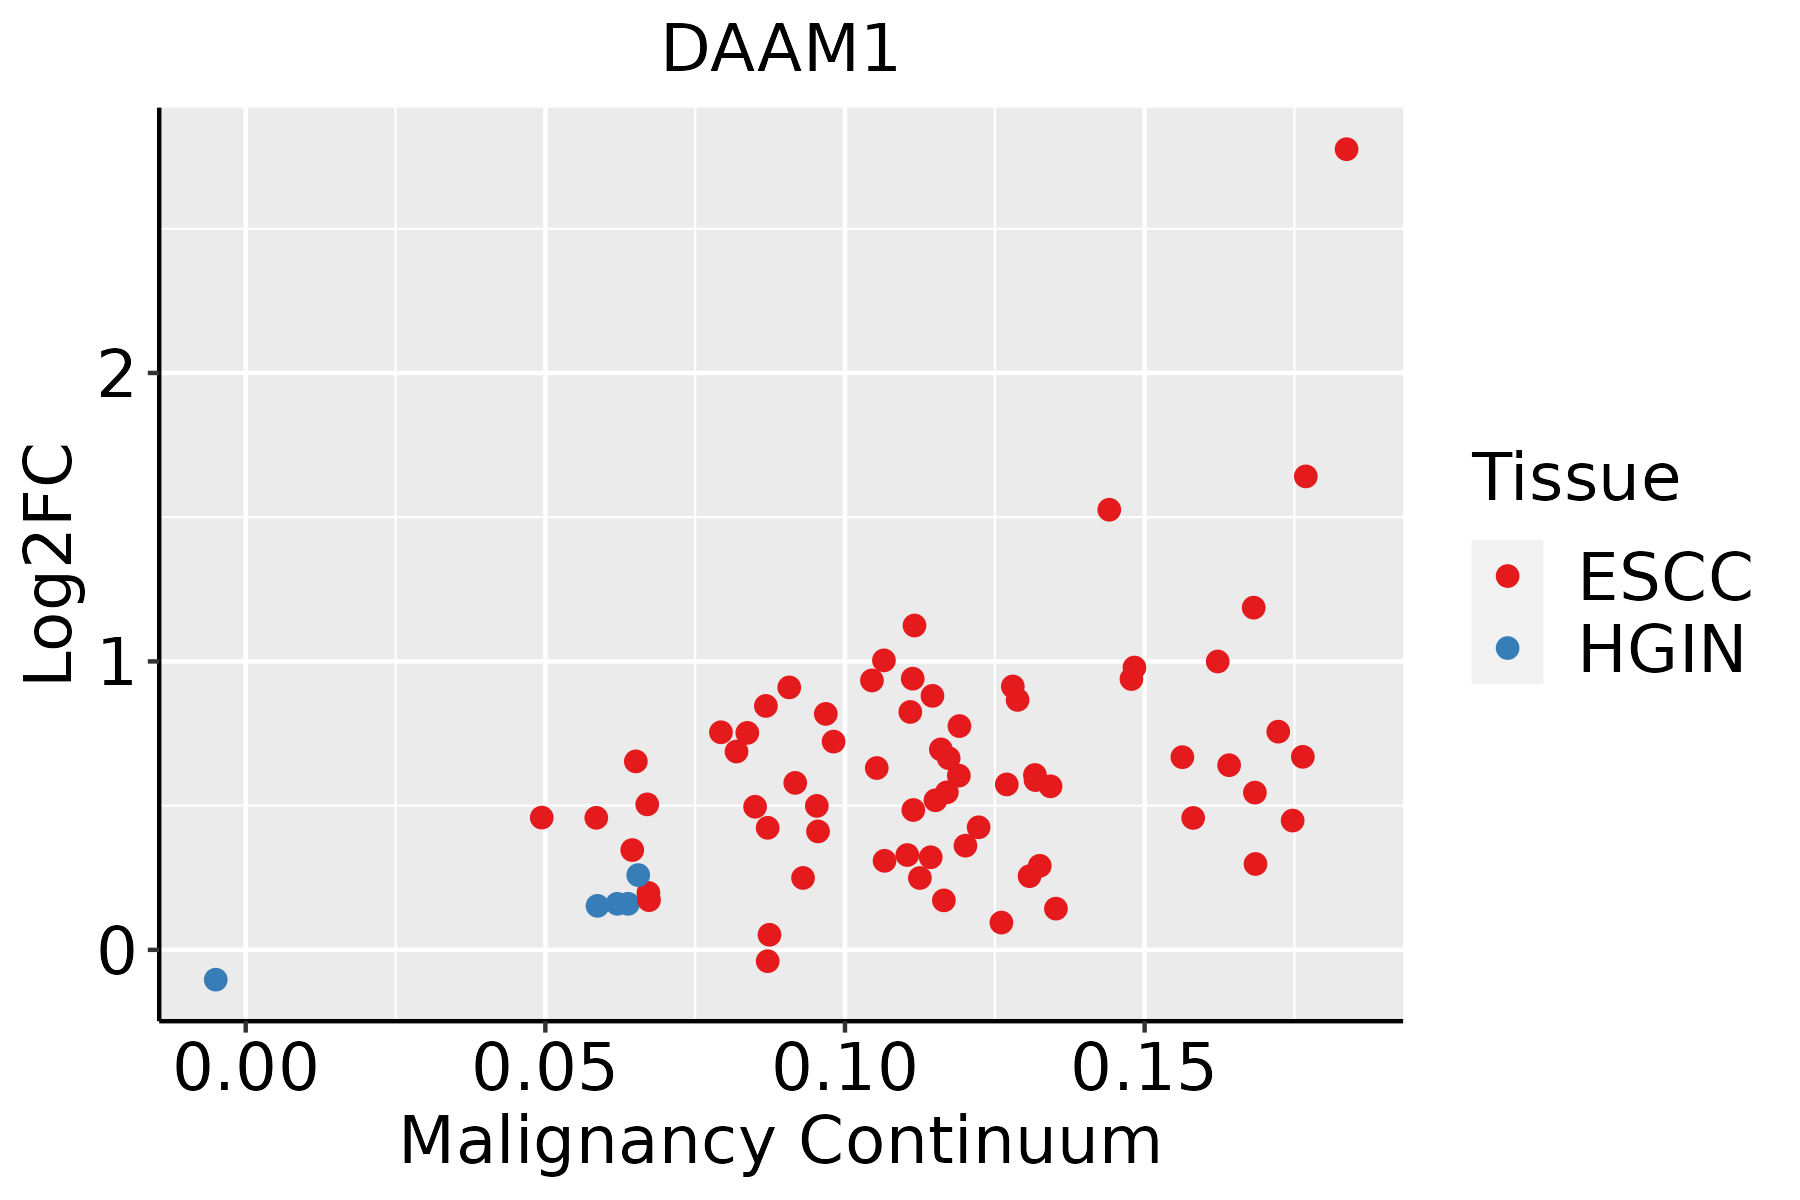 | ESCC: Esophageal squamous cell carcinoma |
| HGIN: High-grade intraepithelial neoplasias | ||
| LGIN: Low-grade intraepithelial neoplasias | ||
| Liver | 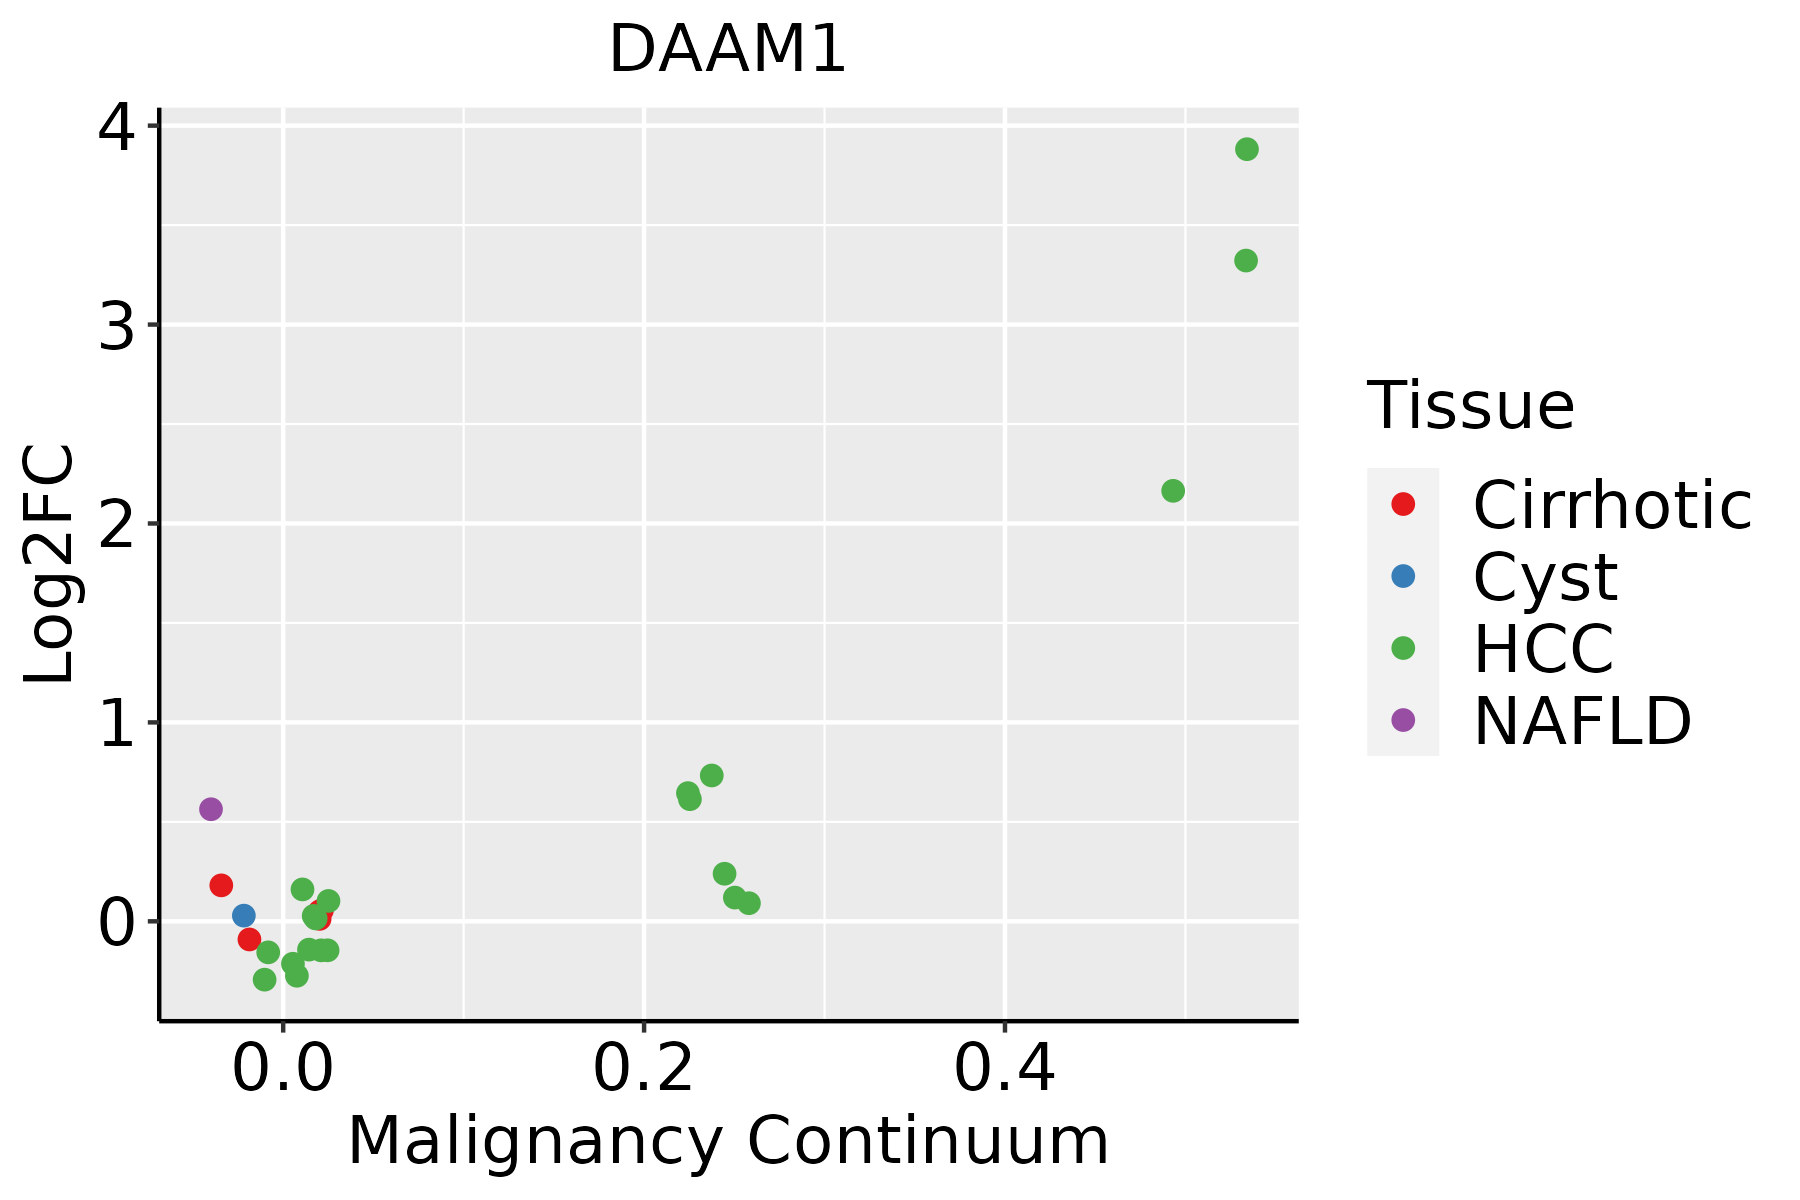 | HCC: Hepatocellular carcinoma |
| NAFLD: Non-alcoholic fatty liver disease | ||
| Lung | 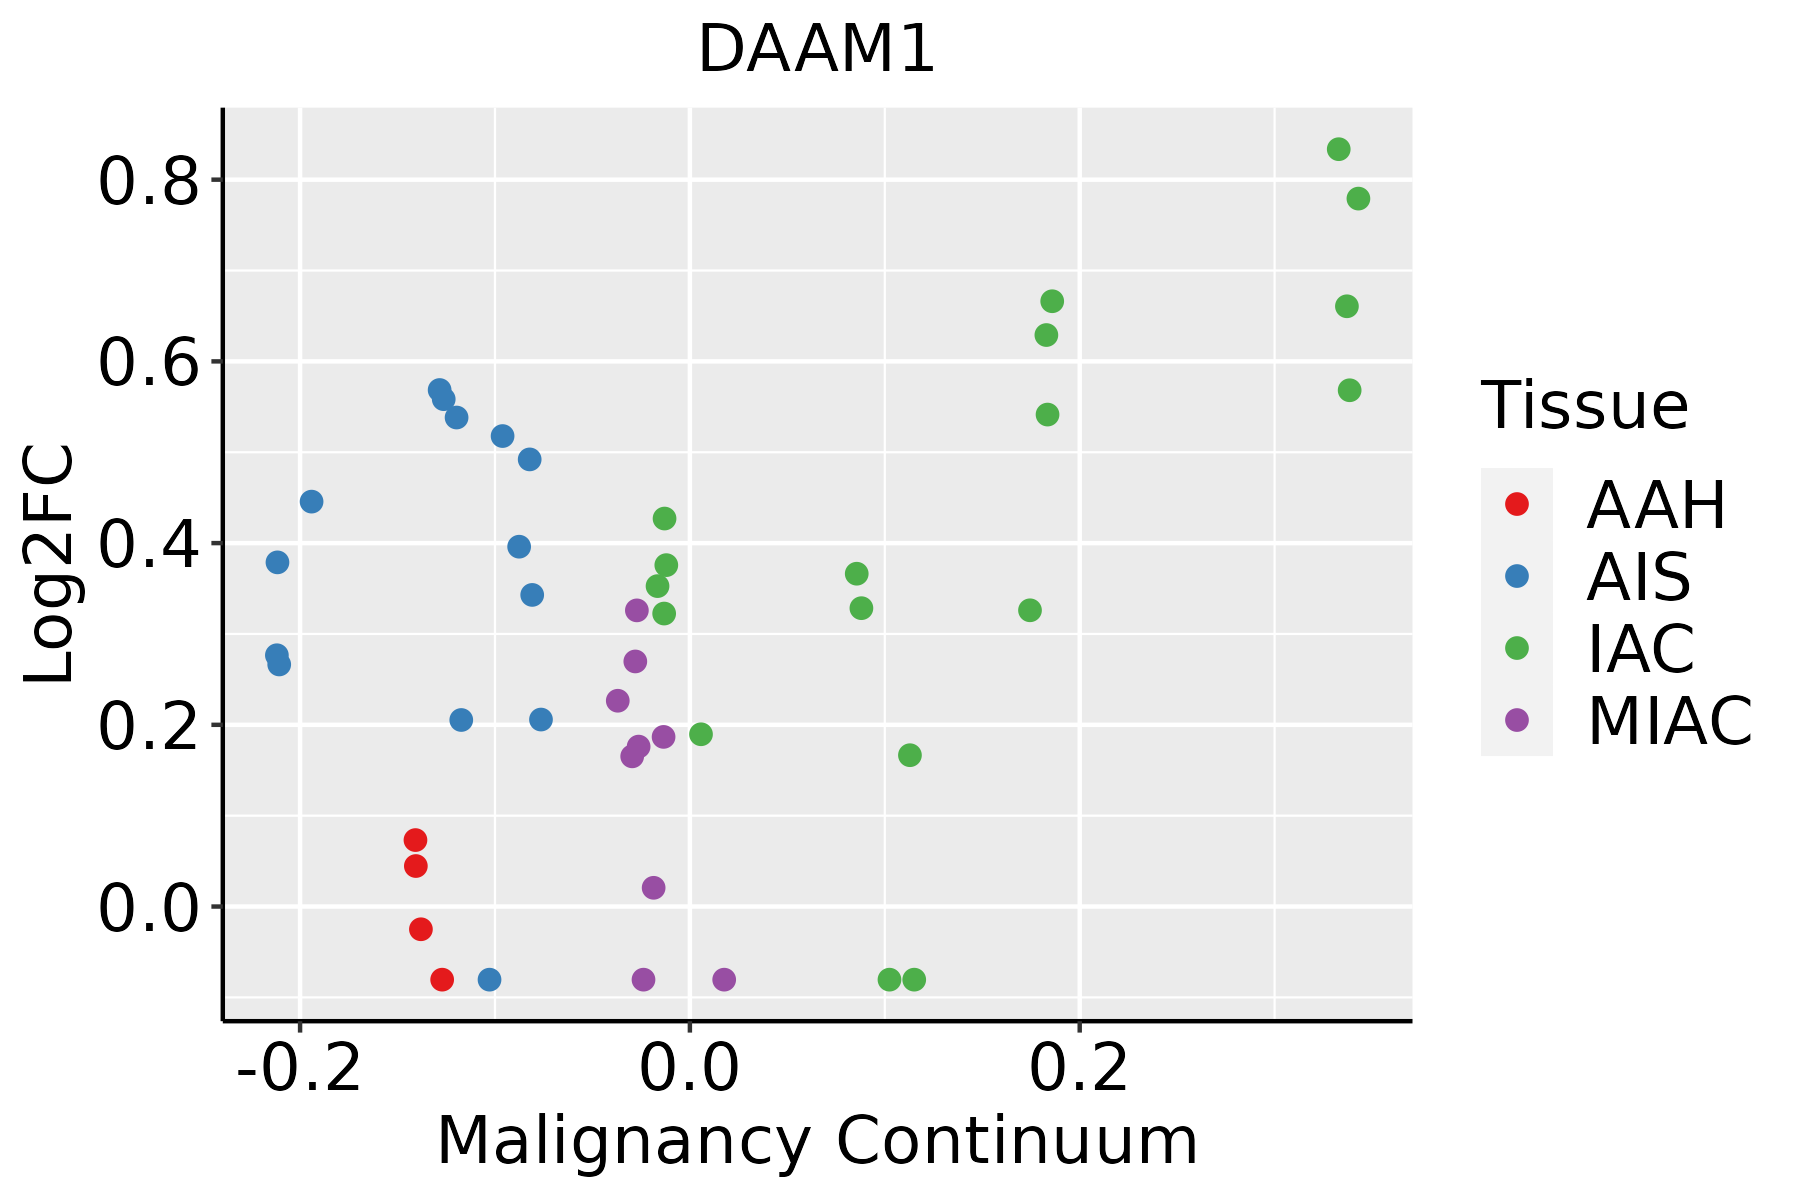 | AAH: Atypical adenomatous hyperplasia |
| AIS: Adenocarcinoma in situ | ||
| IAC: Invasive lung adenocarcinoma | ||
| MIA: Minimally invasive adenocarcinoma | ||
| Oral Cavity | 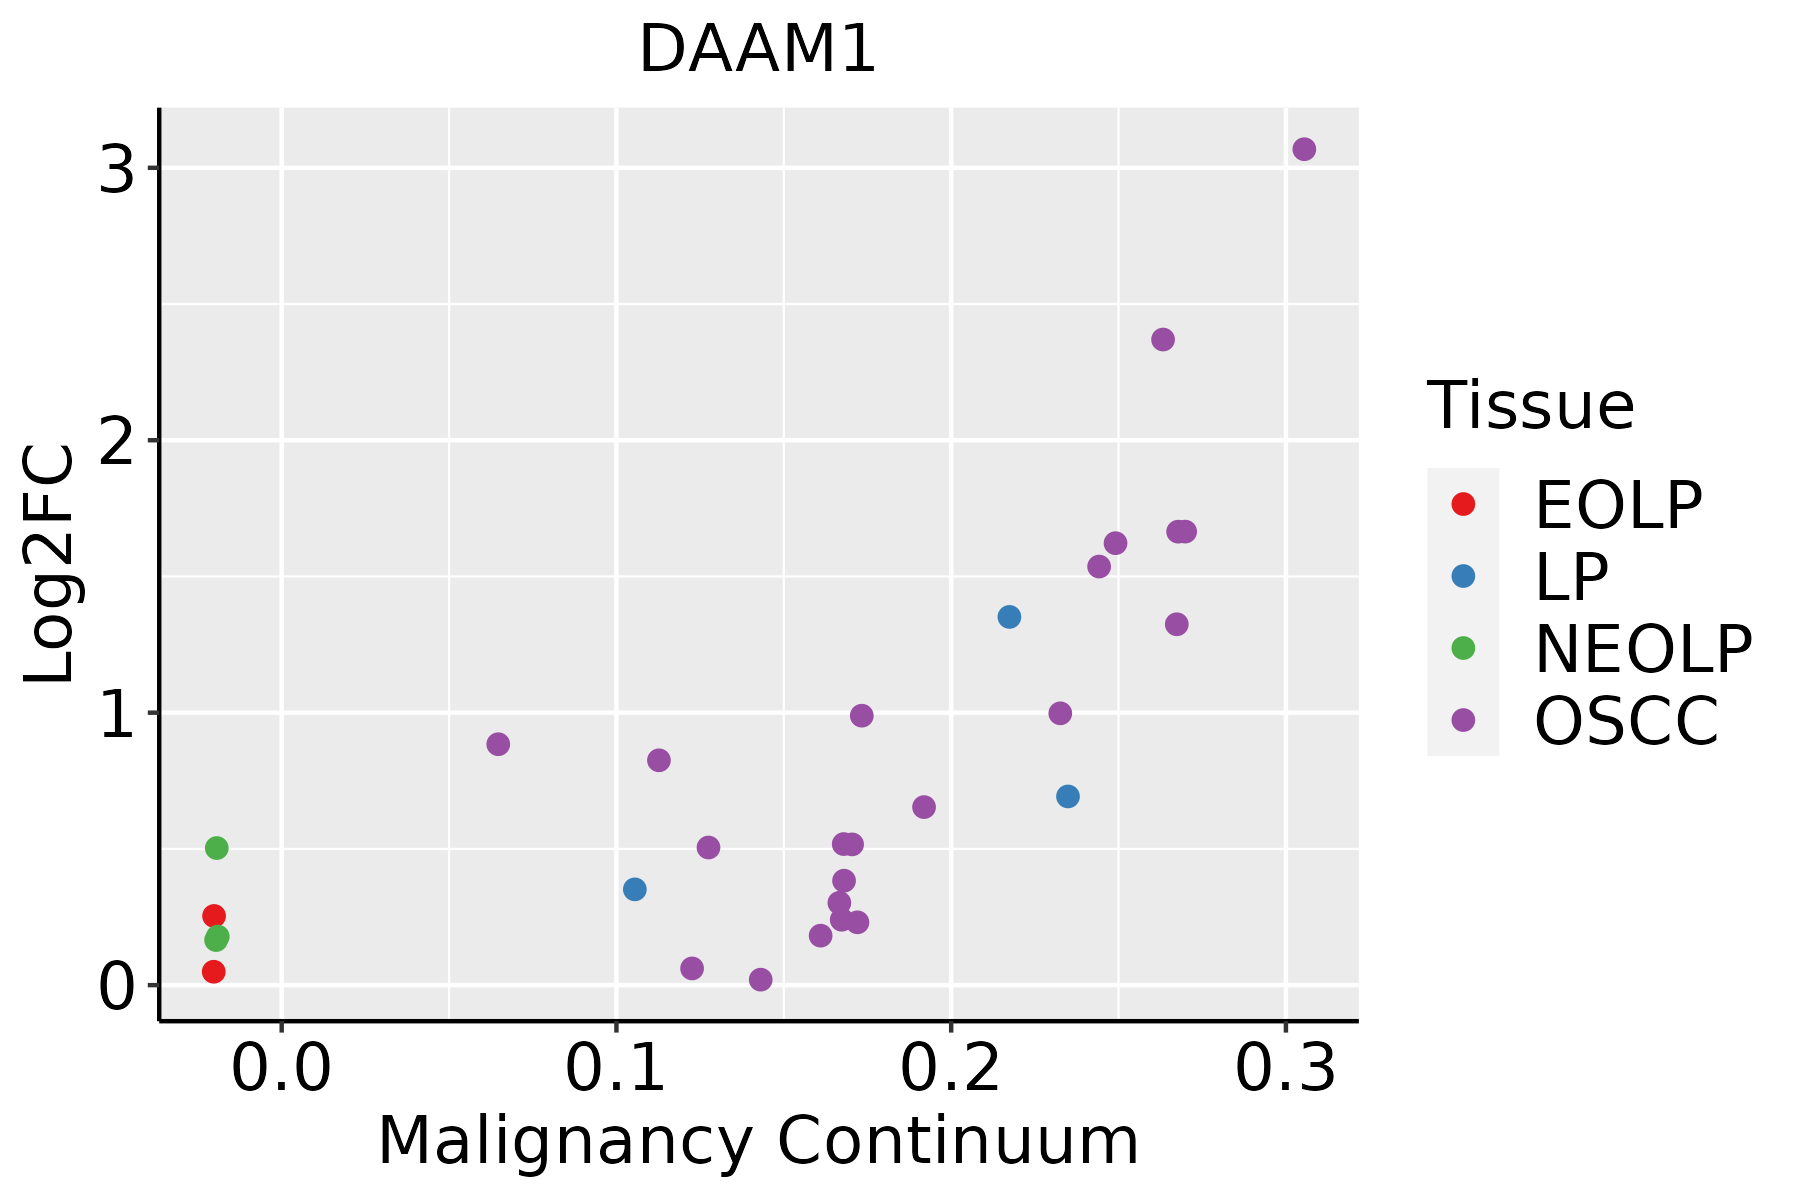 | EOLP: Erosive Oral lichen planus |
| LP: leukoplakia | ||
| NEOLP: Non-erosive oral lichen planus | ||
| OSCC: Oral squamous cell carcinoma | ||
| Skin |  | AK: Actinic keratosis |
| cSCC: Cutaneous squamous cell carcinoma | ||
| SCCIS:squamous cell carcinoma in situ | ||
| Thyroid | 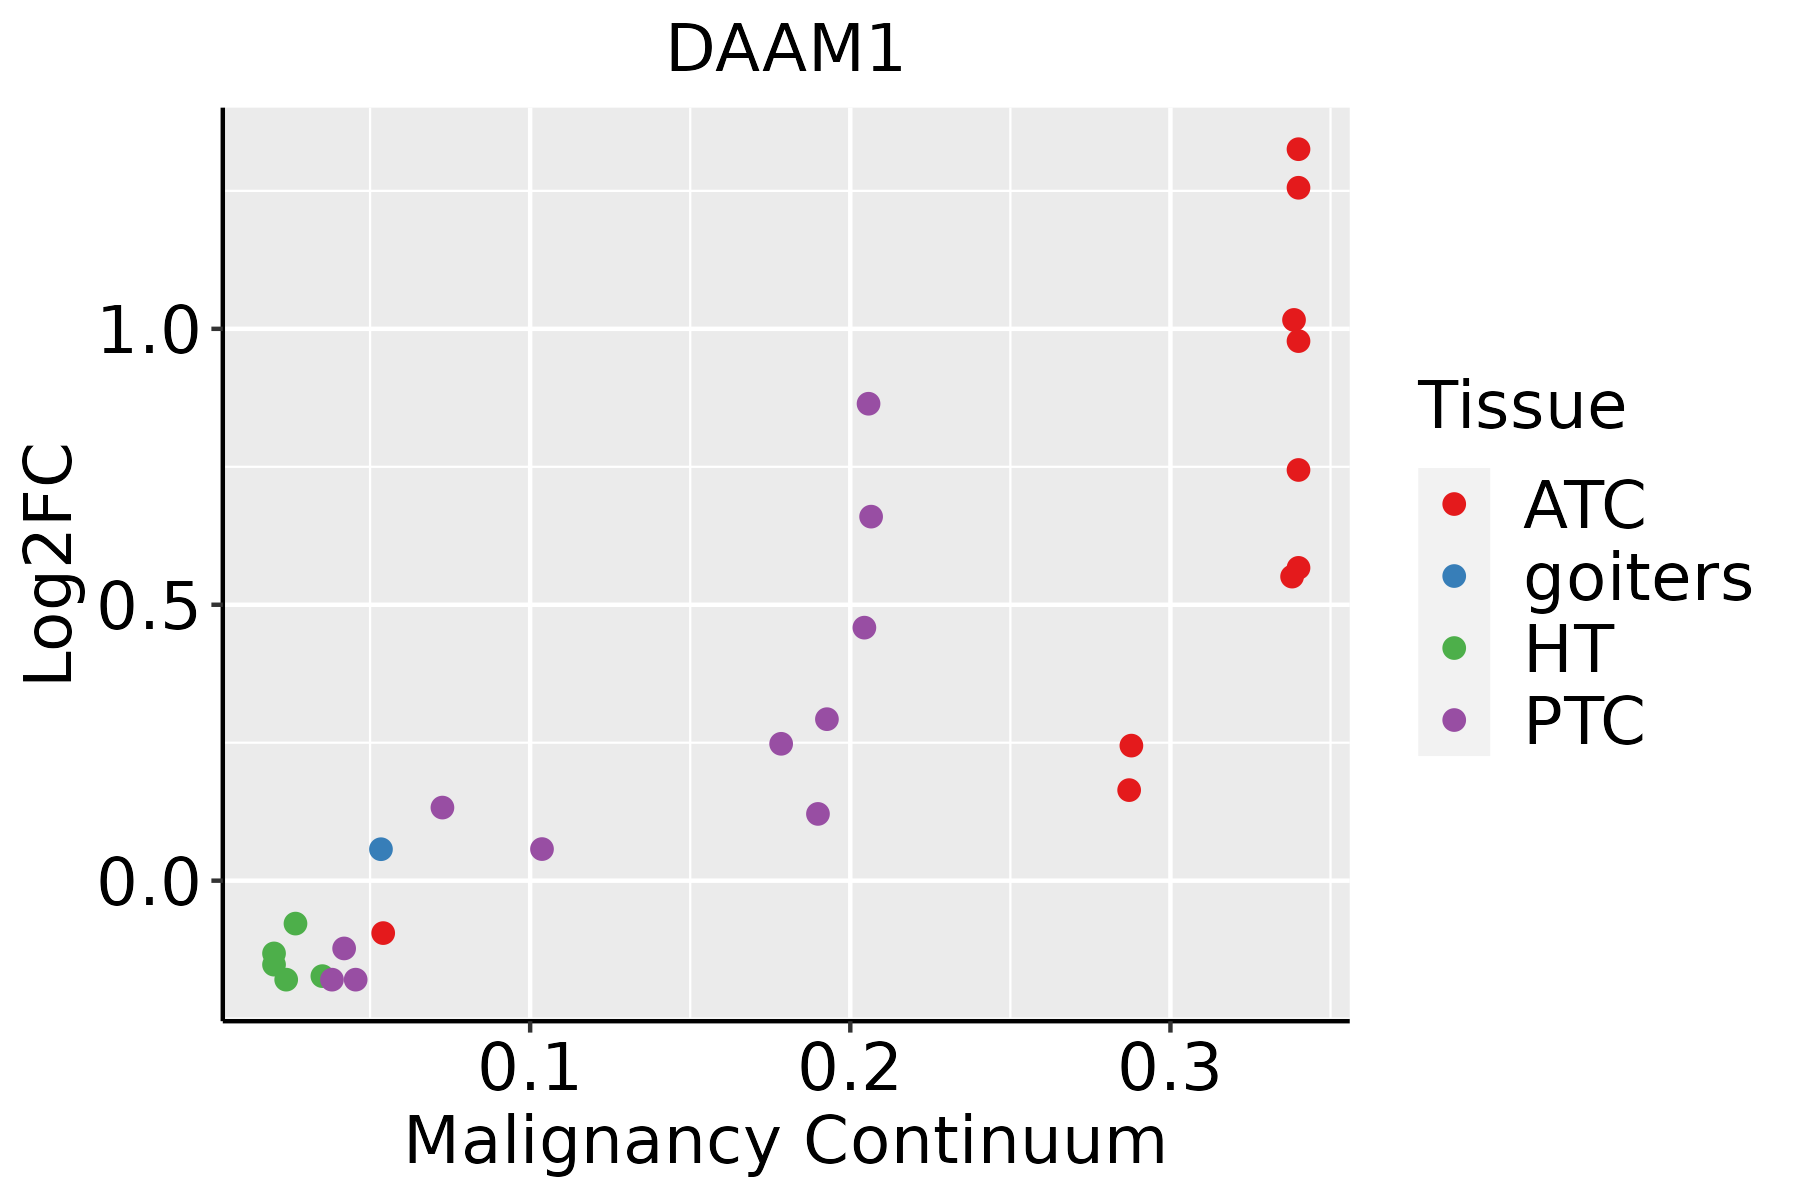 | ATC: Anaplastic thyroid cancer |
| HT: Hashimoto's thyroiditis | ||
| PTC: Papillary thyroid cancer |
| ∗log2FC in expression of this searched gene in stem-like cells from each diseased tissue sample relative to stem-like cells in normal samples in each tissue plotted against the malignancy continuum. Samples are colored based on if they are from different disease stage. |
Top |
Malignant transformation related pathway analysis |
| Find out the enriched GO biological processes and KEGG pathways involved in transition from healthy to precancer to cancer |
| Tissue | Disease Stage | Enriched GO biological Processes |
| Colorectum | AD |  |
| Colorectum | SER |  |
| Colorectum | MSS |  |
| Colorectum | MSI-H |  |
| Colorectum | FAP |  |
| ∗Top 15 enriched GO BP terms are showed in the bar plot of each disease state in each tissue. Each row represents a significant GO biological process which is colored according to the -log10(p.adjust). |
| Page: 1 2 3 4 5 6 7 8 9 |
| GO ID | Tissue | Disease Stage | Description | Gene Ratio | Bg Ratio | pvalue | p.adjust | Count |
| GO:00160557 | Cervix | CC | Wnt signaling pathway | 98/2311 | 444/18723 | 4.82e-09 | 4.65e-07 | 98 |
| GO:01987387 | Cervix | CC | cell-cell signaling by wnt | 98/2311 | 446/18723 | 6.16e-09 | 5.58e-07 | 98 |
| GO:00017384 | Cervix | CC | morphogenesis of a polarized epithelium | 22/2311 | 94/18723 | 2.09e-03 | 1.52e-02 | 22 |
| GO:00901752 | Cervix | CC | regulation of establishment of planar polarity | 14/2311 | 56/18723 | 6.93e-03 | 3.74e-02 | 14 |
| GO:00600712 | Cervix | CC | Wnt signaling pathway, planar cell polarity pathway | 13/2311 | 52/18723 | 9.09e-03 | 4.60e-02 | 13 |
| GO:0016055 | Colorectum | AD | Wnt signaling pathway | 130/3918 | 444/18723 | 1.60e-05 | 3.37e-04 | 130 |
| GO:0198738 | Colorectum | AD | cell-cell signaling by wnt | 130/3918 | 446/18723 | 2.02e-05 | 4.10e-04 | 130 |
| GO:0001738 | Colorectum | AD | morphogenesis of a polarized epithelium | 31/3918 | 94/18723 | 4.30e-03 | 2.95e-02 | 31 |
| GO:00160552 | Colorectum | MSS | Wnt signaling pathway | 124/3467 | 444/18723 | 6.06e-07 | 2.26e-05 | 124 |
| GO:01987382 | Colorectum | MSS | cell-cell signaling by wnt | 124/3467 | 446/18723 | 7.83e-07 | 2.77e-05 | 124 |
| GO:00160553 | Colorectum | FAP | Wnt signaling pathway | 104/2622 | 444/18723 | 4.92e-08 | 3.92e-06 | 104 |
| GO:01987383 | Colorectum | FAP | cell-cell signaling by wnt | 104/2622 | 446/18723 | 6.26e-08 | 4.54e-06 | 104 |
| GO:00017381 | Colorectum | FAP | morphogenesis of a polarized epithelium | 23/2622 | 94/18723 | 4.64e-03 | 3.14e-02 | 23 |
| GO:00160554 | Colorectum | CRC | Wnt signaling pathway | 88/2078 | 444/18723 | 3.91e-08 | 5.28e-06 | 88 |
| GO:01987384 | Colorectum | CRC | cell-cell signaling by wnt | 88/2078 | 446/18723 | 4.85e-08 | 6.04e-06 | 88 |
| GO:2000027 | Colorectum | CRC | regulation of animal organ morphogenesis | 24/2078 | 125/18723 | 5.12e-03 | 3.92e-02 | 24 |
| GO:001605516 | Esophagus | HGIN | Wnt signaling pathway | 83/2587 | 444/18723 | 2.27e-03 | 2.33e-02 | 83 |
| GO:019873816 | Esophagus | HGIN | cell-cell signaling by wnt | 83/2587 | 446/18723 | 2.58e-03 | 2.55e-02 | 83 |
| GO:001605517 | Esophagus | ESCC | Wnt signaling pathway | 268/8552 | 444/18723 | 2.32e-10 | 6.58e-09 | 268 |
| GO:019873817 | Esophagus | ESCC | cell-cell signaling by wnt | 269/8552 | 446/18723 | 2.41e-10 | 6.79e-09 | 269 |
| Page: 1 2 3 4 |
| Pathway ID | Tissue | Disease Stage | Description | Gene Ratio | Bg Ratio | pvalue | p.adjust | qvalue | Count |
| hsa043109 | Cervix | CC | Wnt signaling pathway | 43/1267 | 171/8465 | 3.03e-04 | 1.64e-03 | 9.68e-04 | 43 |
| hsa0431012 | Cervix | CC | Wnt signaling pathway | 43/1267 | 171/8465 | 3.03e-04 | 1.64e-03 | 9.68e-04 | 43 |
| hsa04310 | Colorectum | AD | Wnt signaling pathway | 56/2092 | 171/8465 | 1.03e-02 | 3.93e-02 | 2.51e-02 | 56 |
| hsa043101 | Colorectum | AD | Wnt signaling pathway | 56/2092 | 171/8465 | 1.03e-02 | 3.93e-02 | 2.51e-02 | 56 |
| hsa043102 | Colorectum | MSS | Wnt signaling pathway | 53/1875 | 171/8465 | 4.24e-03 | 1.86e-02 | 1.14e-02 | 53 |
| hsa043103 | Colorectum | MSS | Wnt signaling pathway | 53/1875 | 171/8465 | 4.24e-03 | 1.86e-02 | 1.14e-02 | 53 |
| hsa043104 | Colorectum | FAP | Wnt signaling pathway | 46/1404 | 171/8465 | 3.94e-04 | 3.06e-03 | 1.86e-03 | 46 |
| hsa043105 | Colorectum | FAP | Wnt signaling pathway | 46/1404 | 171/8465 | 3.94e-04 | 3.06e-03 | 1.86e-03 | 46 |
| hsa043106 | Colorectum | CRC | Wnt signaling pathway | 40/1091 | 171/8465 | 1.01e-04 | 1.57e-03 | 1.07e-03 | 40 |
| hsa043107 | Colorectum | CRC | Wnt signaling pathway | 40/1091 | 171/8465 | 1.01e-04 | 1.57e-03 | 1.07e-03 | 40 |
| hsa043108 | Lung | IAC | Wnt signaling pathway | 40/1053 | 171/8465 | 4.56e-05 | 7.06e-04 | 4.69e-04 | 40 |
| hsa0431011 | Lung | IAC | Wnt signaling pathway | 40/1053 | 171/8465 | 4.56e-05 | 7.06e-04 | 4.69e-04 | 40 |
| hsa0431021 | Lung | AIS | Wnt signaling pathway | 39/961 | 171/8465 | 1.29e-05 | 3.32e-04 | 2.12e-04 | 39 |
| hsa0431031 | Lung | AIS | Wnt signaling pathway | 39/961 | 171/8465 | 1.29e-05 | 3.32e-04 | 2.12e-04 | 39 |
| hsa0431016 | Oral cavity | EOLP | Wnt signaling pathway | 37/1218 | 171/8465 | 6.23e-03 | 1.83e-02 | 1.08e-02 | 37 |
| hsa0431017 | Oral cavity | EOLP | Wnt signaling pathway | 37/1218 | 171/8465 | 6.23e-03 | 1.83e-02 | 1.08e-02 | 37 |
| hsa0431024 | Oral cavity | NEOLP | Wnt signaling pathway | 34/1112 | 171/8465 | 8.05e-03 | 2.88e-02 | 1.81e-02 | 34 |
| hsa0431034 | Oral cavity | NEOLP | Wnt signaling pathway | 34/1112 | 171/8465 | 8.05e-03 | 2.88e-02 | 1.81e-02 | 34 |
| Page: 1 |
Top |
Cell-cell communication analysis |
| Identification of potential cell-cell interactions between two cell types and their ligand-receptor pairs for different disease states |
| Ligand | Receptor | LRpair | Pathway | Tissue | Disease Stage |
| Page: 1 |
Top |
Single-cell gene regulatory network inference analysis |
| Find out the significant the regulons (TFs) and the target genes of each regulon across cell types for different disease states |
| TF | Cell Type | Tissue | Disease Stage | Target Gene | RSS | Regulon Activity |
| ∗The dot plots of a searched regulon are shown for all cell subpopulations in each disease state of each tissue based on the regulon specific score inferred using pySCENIC and by calculating the average expression. |
| Page: 1 |
Top |
Somatic mutation of malignant transformation related genes |
| Annotation of somatic variants for genes involved in malignant transformation |
| Hugo Symbol | Variant Class | Variant Classification | dbSNP RS | HGVSc | HGVSp | HGVSp Short | SWISSPROT | BIOTYPE | SIFT | PolyPhen | Tumor Sample Barcode | Tissue | Histology | Sex | Age | Stage | Therapy Types | Drugs | Outcome |
| DAAM1 | SNV | Missense_Mutation | rs150686067 | c.2215A>G | p.Ser739Gly | p.S739G | Q9Y4D1 | protein_coding | tolerated(0.2) | benign(0.062) | TCGA-A8-A09Z-01 | Breast | breast invasive carcinoma | Female | >=65 | I/II | Unknown | Unknown | SD |
| DAAM1 | SNV | Missense_Mutation | rs763633195 | c.2057N>T | p.Ser686Leu | p.S686L | Q9Y4D1 | protein_coding | deleterious(0) | probably_damaging(0.998) | TCGA-AN-A046-01 | Breast | breast invasive carcinoma | Female | >=65 | I/II | Unknown | Unknown | SD |
| DAAM1 | SNV | Missense_Mutation | c.2916N>A | p.Phe972Leu | p.F972L | Q9Y4D1 | protein_coding | deleterious(0.02) | probably_damaging(0.967) | TCGA-AN-A046-01 | Breast | breast invasive carcinoma | Female | >=65 | I/II | Unknown | Unknown | SD | |
| DAAM1 | SNV | Missense_Mutation | c.772C>G | p.Gln258Glu | p.Q258E | Q9Y4D1 | protein_coding | deleterious(0) | probably_damaging(0.973) | TCGA-D8-A1J8-01 | Breast | breast invasive carcinoma | Female | >=65 | I/II | Hormone Therapy | nolvadex | SD | |
| DAAM1 | SNV | Missense_Mutation | c.1079C>T | p.Ala360Val | p.A360V | Q9Y4D1 | protein_coding | tolerated(0.07) | probably_damaging(0.994) | TCGA-D8-A1J8-01 | Breast | breast invasive carcinoma | Female | >=65 | I/II | Hormone Therapy | nolvadex | SD | |
| DAAM1 | SNV | Missense_Mutation | c.645N>C | p.Glu215Asp | p.E215D | Q9Y4D1 | protein_coding | tolerated(0.15) | probably_damaging(0.989) | TCGA-D8-A1JK-01 | Breast | breast invasive carcinoma | Female | >=65 | I/II | Unknown | Unknown | SD | |
| DAAM1 | SNV | Missense_Mutation | c.503N>C | p.Met168Thr | p.M168T | Q9Y4D1 | protein_coding | tolerated(0.06) | probably_damaging(0.954) | TCGA-D8-A1XK-01 | Breast | breast invasive carcinoma | Female | <65 | I/II | Chemotherapy | doxorubicine+cyclophosphamide | SD | |
| DAAM1 | SNV | Missense_Mutation | c.13N>C | p.Lys5Gln | p.K5Q | Q9Y4D1 | protein_coding | tolerated(0.1) | probably_damaging(0.95) | TCGA-E9-A1NC-01 | Breast | breast invasive carcinoma | Female | <65 | I/II | Chemotherapy | doxorubicin | CR | |
| DAAM1 | SNV | Missense_Mutation | novel | c.766N>A | p.Arg256Ser | p.R256S | Q9Y4D1 | protein_coding | deleterious(0) | probably_damaging(0.995) | TCGA-OL-A6VR-01 | Breast | breast invasive carcinoma | Female | <65 | I/II | Unknown | Unknown | SD |
| DAAM1 | SNV | Missense_Mutation | novel | c.991N>T | p.His331Tyr | p.H331Y | Q9Y4D1 | protein_coding | deleterious(0) | probably_damaging(0.988) | TCGA-2W-A8YY-01 | Cervix | cervical & endocervical cancer | Female | <65 | I/II | Chemotherapy | cisplatin | CR |
| Page: 1 2 3 4 5 6 7 8 9 10 11 12 13 14 15 |
Top |
Related drugs of malignant transformation related genes |
| Identification of chemicals and drugs interact with genes involved in malignant transfromation |
| (DGIdb 4.0) |
| Entrez ID | Symbol | Category | Interaction Types | Drug Claim Name | Drug Name | PMIDs |
| Page: 1 |

Copyright 2023-Present -The University of Texas Health Science Center at Houston |