
|
|||||
|
 | |
| |
| |
| |
| |
| |
|
Gene: D2HGDH |
Gene summary for D2HGDH |
| Gene information | Species | Human | Gene symbol | D2HGDH | Gene ID | 728294 |
| Gene name | D-2-hydroxyglutarate dehydrogenase | |
| Gene Alias | D2HGD | |
| Cytomap | 2q37.3 | |
| Gene Type | protein-coding | GO ID | GO:0006082 | UniProtAcc | B3KSR6 |
Top |
Malignant transformation analysis |
| Identification of the aberrant gene expression in precancerous and cancerous lesions by comparing the gene expression of stem-like cells in diseased tissues with normal stem cells |
| Entrez ID | Symbol | Replicates | Species | Organ | Tissue | Adj P-value | Log2FC | Malignancy |
| 728294 | D2HGDH | LZE4T | Human | Esophagus | ESCC | 4.69e-02 | 5.50e-02 | 0.0811 |
| 728294 | D2HGDH | LZE8T | Human | Esophagus | ESCC | 2.16e-02 | 9.99e-02 | 0.067 |
| 728294 | D2HGDH | LZE24T | Human | Esophagus | ESCC | 1.78e-10 | 2.28e-01 | 0.0596 |
| 728294 | D2HGDH | LZE21T | Human | Esophagus | ESCC | 3.46e-04 | 2.32e-01 | 0.0655 |
| 728294 | D2HGDH | P1T-E | Human | Esophagus | ESCC | 1.36e-03 | 5.11e-01 | 0.0875 |
| 728294 | D2HGDH | P2T-E | Human | Esophagus | ESCC | 9.99e-10 | 1.99e-01 | 0.1177 |
| 728294 | D2HGDH | P4T-E | Human | Esophagus | ESCC | 2.37e-06 | 1.45e-01 | 0.1323 |
| 728294 | D2HGDH | P5T-E | Human | Esophagus | ESCC | 5.15e-04 | 8.22e-02 | 0.1327 |
| 728294 | D2HGDH | P8T-E | Human | Esophagus | ESCC | 3.28e-14 | 2.33e-01 | 0.0889 |
| 728294 | D2HGDH | P9T-E | Human | Esophagus | ESCC | 2.82e-06 | 1.11e-01 | 0.1131 |
| 728294 | D2HGDH | P10T-E | Human | Esophagus | ESCC | 5.14e-22 | 1.82e-01 | 0.116 |
| 728294 | D2HGDH | P12T-E | Human | Esophagus | ESCC | 7.90e-13 | 1.85e-01 | 0.1122 |
| 728294 | D2HGDH | P15T-E | Human | Esophagus | ESCC | 4.33e-24 | 5.30e-01 | 0.1149 |
| 728294 | D2HGDH | P16T-E | Human | Esophagus | ESCC | 1.49e-07 | 1.87e-01 | 0.1153 |
| 728294 | D2HGDH | P17T-E | Human | Esophagus | ESCC | 4.84e-05 | 1.46e-01 | 0.1278 |
| 728294 | D2HGDH | P20T-E | Human | Esophagus | ESCC | 2.23e-25 | 5.68e-01 | 0.1124 |
| 728294 | D2HGDH | P21T-E | Human | Esophagus | ESCC | 6.52e-19 | 3.27e-01 | 0.1617 |
| 728294 | D2HGDH | P22T-E | Human | Esophagus | ESCC | 4.10e-10 | 2.91e-01 | 0.1236 |
| 728294 | D2HGDH | P23T-E | Human | Esophagus | ESCC | 3.55e-06 | 1.19e-01 | 0.108 |
| 728294 | D2HGDH | P24T-E | Human | Esophagus | ESCC | 5.13e-06 | 1.41e-01 | 0.1287 |
| Page: 1 2 3 |
| Tissue | Expression Dynamics | Abbreviation |
| Esophagus | 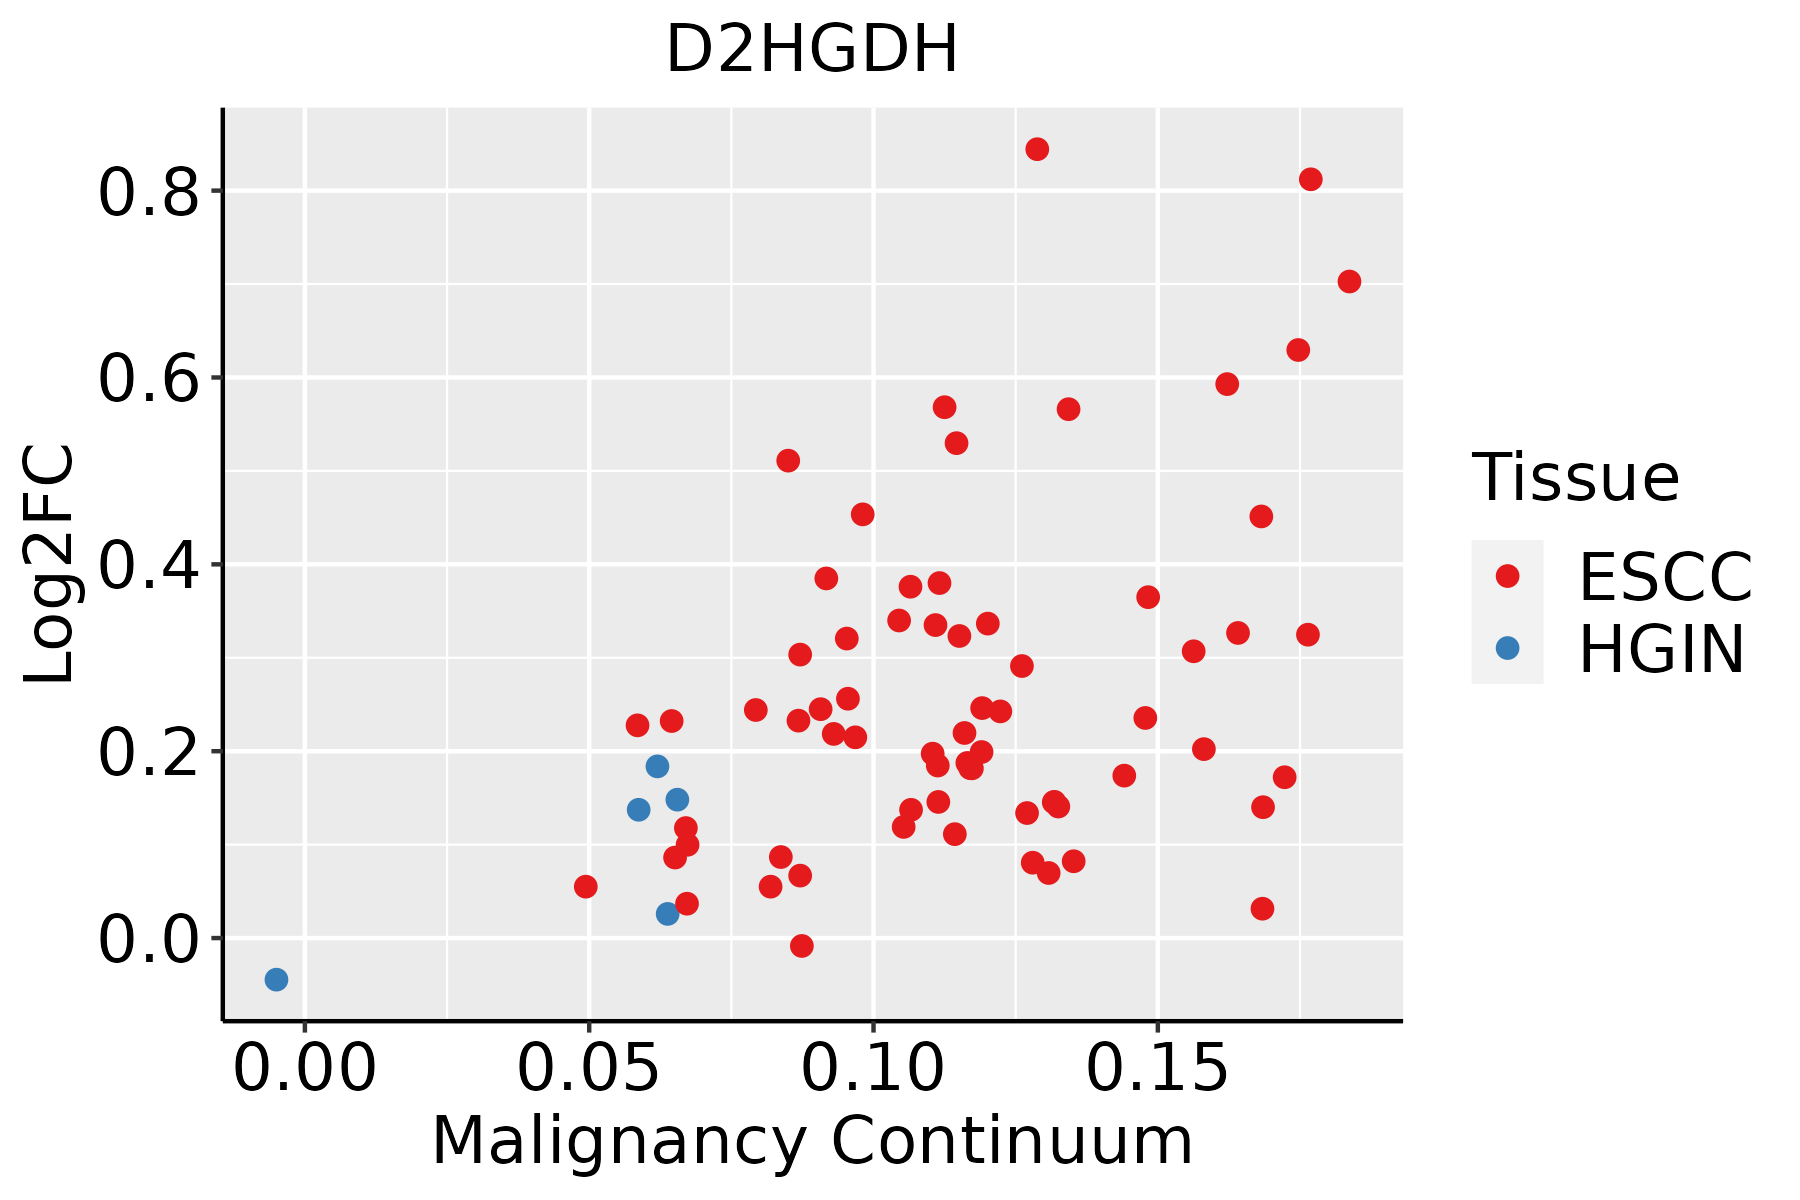 | ESCC: Esophageal squamous cell carcinoma |
| HGIN: High-grade intraepithelial neoplasias | ||
| LGIN: Low-grade intraepithelial neoplasias |
| ∗log2FC in expression of this searched gene in stem-like cells from each diseased tissue sample relative to stem-like cells in normal samples in each tissue plotted against the malignancy continuum. Samples are colored based on if they are from different disease stage. |
Top |
Malignant transformation related pathway analysis |
| Find out the enriched GO biological processes and KEGG pathways involved in transition from healthy to precancer to cancer |
| Tissue | Disease Stage | Enriched GO biological Processes |
| Colorectum | AD |  |
| Colorectum | SER |  |
| Colorectum | MSS |  |
| Colorectum | MSI-H |  |
| Colorectum | FAP |  |
| ∗Top 15 enriched GO BP terms are showed in the bar plot of each disease state in each tissue. Each row represents a significant GO biological process which is colored according to the -log10(p.adjust). |
| Page: 1 2 3 4 5 6 7 8 9 |
| GO ID | Tissue | Disease Stage | Description | Gene Ratio | Bg Ratio | pvalue | p.adjust | Count |
| GO:001003827 | Esophagus | ESCC | response to metal ion | 208/8552 | 373/18723 | 5.02e-05 | 3.90e-04 | 208 |
| GO:00436485 | Esophagus | ESCC | dicarboxylic acid metabolic process | 58/8552 | 96/18723 | 2.55e-03 | 1.09e-02 | 58 |
| Page: 1 |
| Pathway ID | Tissue | Disease Stage | Description | Gene Ratio | Bg Ratio | pvalue | p.adjust | qvalue | Count |
| Page: 1 |
Top |
Cell-cell communication analysis |
| Identification of potential cell-cell interactions between two cell types and their ligand-receptor pairs for different disease states |
| Ligand | Receptor | LRpair | Pathway | Tissue | Disease Stage |
| Page: 1 |
Top |
Single-cell gene regulatory network inference analysis |
| Find out the significant the regulons (TFs) and the target genes of each regulon across cell types for different disease states |
| TF | Cell Type | Tissue | Disease Stage | Target Gene | RSS | Regulon Activity |
| ∗The dot plots of a searched regulon are shown for all cell subpopulations in each disease state of each tissue based on the regulon specific score inferred using pySCENIC and by calculating the average expression. |
| Page: 1 |
Top |
Somatic mutation of malignant transformation related genes |
| Annotation of somatic variants for genes involved in malignant transformation |
| Hugo Symbol | Variant Class | Variant Classification | dbSNP RS | HGVSc | HGVSp | HGVSp Short | SWISSPROT | BIOTYPE | SIFT | PolyPhen | Tumor Sample Barcode | Tissue | Histology | Sex | Age | Stage | Therapy Types | Drugs | Outcome |
| D2HGDH | SNV | Missense_Mutation | c.866T>A | p.Phe289Tyr | p.F289Y | Q8N465 | protein_coding | tolerated(0.6) | possibly_damaging(0.601) | TCGA-EW-A1IW-01 | Breast | breast invasive carcinoma | Female | >=65 | I/II | Hormone Therapy | aromasin | SD | |
| D2HGDH | SNV | Missense_Mutation | c.1249N>A | p.Asp417Asn | p.D417N | Q8N465 | protein_coding | deleterious(0.03) | benign(0.316) | TCGA-JW-A5VL-01 | Cervix | cervical & endocervical cancer | Female | <65 | I/II | Unknown | Unknown | SD | |
| D2HGDH | SNV | Missense_Mutation | rs142050154 | c.326N>T | p.Ser109Leu | p.S109L | Q8N465 | protein_coding | deleterious(0) | benign(0.244) | TCGA-VS-A8EL-01 | Cervix | cervical & endocervical cancer | Female | <65 | I/II | Chemotherapy | cisplatin | CR |
| D2HGDH | SNV | Missense_Mutation | novel | c.550N>T | p.Arg184Trp | p.R184W | Q8N465 | protein_coding | tolerated(0.08) | benign(0.045) | TCGA-AZ-4313-01 | Colorectum | colon adenocarcinoma | Female | <65 | I/II | Unknown | Unknown | SD |
| D2HGDH | SNV | Missense_Mutation | c.691N>A | p.Ala231Thr | p.A231T | Q8N465 | protein_coding | deleterious(0.02) | possibly_damaging(0.619) | TCGA-CM-5861-01 | Colorectum | colon adenocarcinoma | Female | <65 | I/II | Unknown | Unknown | PD | |
| D2HGDH | SNV | Missense_Mutation | c.387N>T | p.Gln129His | p.Q129H | Q8N465 | protein_coding | deleterious(0) | probably_damaging(0.999) | TCGA-A5-A0G1-01 | Endometrium | uterine corpus endometrioid carcinoma | Female | >=65 | I/II | Unknown | Unknown | SD | |
| D2HGDH | SNV | Missense_Mutation | c.644N>A | p.Arg215Gln | p.R215Q | Q8N465 | protein_coding | deleterious(0.02) | possibly_damaging(0.638) | TCGA-AX-A0J0-01 | Endometrium | uterine corpus endometrioid carcinoma | Female | <65 | I/II | Unknown | Unknown | SD | |
| D2HGDH | SNV | Missense_Mutation | rs201837754 | c.610N>A | p.Val204Met | p.V204M | Q8N465 | protein_coding | deleterious(0) | possibly_damaging(0.893) | TCGA-AX-A1CE-01 | Endometrium | uterine corpus endometrioid carcinoma | Female | <65 | I/II | Unspecific | Paclitaxel | SD |
| D2HGDH | SNV | Missense_Mutation | novel | c.622G>A | p.Ala208Thr | p.A208T | Q8N465 | protein_coding | deleterious(0) | probably_damaging(0.991) | TCGA-AX-A2HC-01 | Endometrium | uterine corpus endometrioid carcinoma | Female | <65 | III/IV | Chemotherapy | paclitaxel | PD |
| D2HGDH | SNV | Missense_Mutation | novel | c.560N>C | p.Ile187Thr | p.I187T | Q8N465 | protein_coding | tolerated(0.11) | benign(0.038) | TCGA-AX-A2HJ-01 | Endometrium | uterine corpus endometrioid carcinoma | Female | <65 | I/II | Unknown | Unknown | SD |
| Page: 1 2 3 4 |
Top |
Related drugs of malignant transformation related genes |
| Identification of chemicals and drugs interact with genes involved in malignant transfromation |
| (DGIdb 4.0) |
| Entrez ID | Symbol | Category | Interaction Types | Drug Claim Name | Drug Name | PMIDs |
| Page: 1 |

Copyright 2023-Present -The University of Texas Health Science Center at Houston |